


 nueva página del texto (beta)
 Inglés (pdf)
 Artículo en XML
 Referencias del artículo
 Enviar artículo por email
 Citado por SciELO
  Similares en
SciELO
Similares en
SciELO 
 Permalink
Introduction
Communication tools are evolving to become increasingly more visual in many fields (e.g., marketing, education) driven largely by the commercial preference of younger generations (Pitta, Kilian, Hennigs, & Langner, 2012; Selwyn, 2009), providing promising opportunities in many areas, including research. Younger generations are considered technologically sophisticated multitaskers who see technology as part of their lives instead of something to adopt or incorporate into their existence, thereby making technology inseparable from who they are or what they do. Given that the rate of introduction to new technologies for the millennial generation (i.e., those born between 1980-2000) was faster than that for any other generation, it is expected that millennials will be more fundamentally affected by technology (Deal, Altman, & Rogelberg, 2010). Research about the workforce, education, marriage, parenthood, and major purchases preferences for millennials has become important in the last several years (Jones, 2014; Moss, Kirby, & Donodeo, 2009). Visual images used in any form of communication among different generations are crucial because visuals are processed approximately 60,000 times faster in the brain than text; additionally, 40% of people respond better to visual information than to plain text, and visual content boosts engagement (Walter & Gioglio, 2014). Research preferences among younger people have not been explored extensively, particularly in regard to visual content. Visuals provide an opportunity to make questionnaires and scales more appealing. At the same time, visuals can distract participants or alter the content of the questions, thereby reducing the instrument validity and making it more challenging to use. Visuals that consist of juxtaposed pictorial images arranged in a deliberate sequence and that are clear and aesthetically pleasing can be most promising communication tools of our time (McCloud, 1994). Pictorial descriptions have certain advantages over other visuals because they can explain simple to complex processes with one or more drawings (Felzenszwalb & Huttenlocher, 2005; Hegarty & Kozhevnikov, 1999; Katz, Kripalani, & Weiss, 2006). Using this type of image (i.e., pictorial descriptions) in questionnaires and scales might be a solution to issues concerning the validity of the questionnaire as well as potential negative effects on the viewer’s responses by other visuals.
A limited number of visual and pictorial assessments (screening tools, scales, etc.) have been developed for older and younger population groups (Bados López, 2015; Leiner, Peinado, Villanos, & Blunk, 2013; Scott, Short, Singer, Russ, & Minnes, 2006), facilitating the understanding of and responses to questions. Pictorial assessments used by adults have proven to be most valuable among groups confronting functional literacy (Leiner, Puertas, Caratachea, Perez, & Jimenez, 2010; Leiner, Peinado, Villanos, & Jimenez, 2013; Leiner, Rescorla, Medina, Blanc, & Ortiz, 2010). Some pioneers in cultural adaptations of psychological tests suggested that pictorial responses help those confronting communication barriers better respond to the questions because the pictorial responses simplify complex abstractions and solve numeracy limitations (Reyes-Lagunes, 1993). When pictorial assessments are used, readers better understand the questions, without introducing bias or other confounding factors (Leiner, Balcazar, Straus, Shirsat, & Handal, 2007).
In addition, these pictorial questionnaires have shown remarkable consistency in their validity with the original non-pictorial questionnaires. This is an advantage because the same assessment can be used by adding only pictorial descriptions, which reduces the cost of customization for specific groups (e.g., ethnic, low literacy skills). A limited number of research studies have assessed participant preferences for different questionnaire formats, with most of the studies dedicated to determining the effects of tool format on response rates and/or data quality (Berk, Schur, & Feldman, 2007; Brambilla & McKinlay, 1987; Brogger, Nystad, Cappelen, & Bakke, 2007; Link & Mokdad, 2005). Questionnaire response rates are highly influenced by a number of factors: 1) relevant questions that perceive importance of the findings; 2) adequate privacy to complete questionnaire when the questions involve personal information; 3) the amount of time necessary to complete the survey; 4) the length and style of questionnaire, including the clarity of the rating scales and incentives for completing the survey; and 5) the hierarchy and order of the questions (Gill, Leslie, Grech, & Latour, 2013; Goodman, 2013; Lagerros, Sandin, Bexelius, Litton, & Lof, 2012; Patrick, Singer, Boyd, Cranford, & McCabe, 2013; Svensson, Svensson, Hansen, & Trolle Lagerros, 2012; Ziegenfuss, Niederhauser, Kallmes, & Beebe, 2013). Some of these key elements to increase survey responses, however, do not reveal much regarding the preferences of younger generations, who are generally more knowledgeable of digital media and more tech savvy in the digital era. Younger generations are avid consumers and belong to a global community, and they are also some of the most educated generations (DeBard, 2004; Hershatter & Epstein, 2010). Thus, a more up-to-date questionnaire that fits their needs and likes might be better and increase response rates compared to traditional questionnaire formats, which exclusively use written questions.
In this study, we sought to increase the scarcity of research in the area and proposed that pictorial questionnaires would be preferred by younger users versus the traditional written format. Additionally, we sought to confirm that visual images (i.e., pictorial descriptions) added to written questions in a scale do not alter the scale’s validity.
Respondents’ preferences were measured by comparing the opinions of Mexican college students between the Pictorial Perceived Stress Scale (PPSS) and the original Perceived Stress Scale (PSS) described by Cohen et al. (Cohen, Kamarck & Mermelstein, 1983). The PSS is considered a global stress measure that relies on a respondent’s self-appraisal of stressful situations that occurred within the preceding month (Cohen, Liberzon & Richeter-Levin, 2009).
Methods
Three studies are presented here to assess the test reliability and internal consistency, survey principal component analyses (PCA), and respondents’ preferences of the PPSS vs the PSS scale using three studies. The validity of the scale was determined by comparing the written and pictorial formats of the Spanish version of the scales (Ramirez & Hernandez, 2007).
This is a correlational study with a cross-sectional design in which all the variables were assessed at the same time. Study participants for this study were drawn from an electronic database containing data of a cross-sectional study of exposure to violence and stress among college students in a large metropolitan university in Mexico. This large database contained more than 10,000 records, including the responses of college students from either the PSS or the PPSS. This electronic database has been updated every year since 2009. All data were anonymized and assigned an identification number that was not linked to the student’s name or school identity.
Measures: The PSS is a self-reported questionnaire that was designed to measure, through individual evaluation, the perception of psychological stress in a person’s life during the previous month (e.g., how unpredictable, uncontrollable, and overloaded the person felt) (Cohen, Kamarck & Mermelstein, 1983). For this study, the Spanish version that was validated in Mexico was used (Ramirez & Hernandez, 2007). The PSS scale contains 14 items that are scored on a five-point Likert-type scale: 0 = Never, 1 = Almost Never, 2 = Sometimes, 3 = Fairly Often and 4 = Very Often. Half of the items (1, 2, 3, 8, 11, 12, and 14) are considered negative and represent stress, whereas the remaining seven items are positive and represent coping items (4, 5, 6, 7, 9, 10, and 13). Total scores were calculated after reversing positive items scores and summing all item scores. The total scores ranged from 0 to 56, with higher scores indicating greater stress levels.
The PPSS is an adaptation of the original PSS, in which pictorial descriptions were added to each of the PSS questions. A portion of the questionnaire, including questions 10 and 14, is presented in Figures 1 and 2. Pictorial descriptions were designed by a group of professionals (researchers) and a graphic designer.
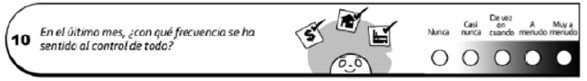
Figure 1 Item 10 in the PPSS. In the last month, how often have you felt that you were on top of things?

Figure 2 Item 14 in the PPSS. In the last month, how often have you felt difficulties were piling up so high that you could not overcome them?
Database General Information: Information included in this database consists of results from participants selected using both stratified and random cluster sampling. Participants pursuing different majors were randomly selected from stratification by college (4) with random cluster sampling by department and classroom. Approval for the retrospective analyses of these data was obtained from the Institutional Review Board of Texas Tech University Health Sciences Center at El Paso, Texas.
Statistical Analysis: Data are presented as the means ± standard deviations (SD), ranges, and percentages of populations. More information is included below in each study.
Results
Study 1: Test-Retest Reliability and Internal Consistency of the PPSS and PSS
Participants: Study 1, the test-retest reliability study, included 150 college students who responded to either the PSS or the PPSS twice within 7-10 days. The mean age of the students who completed the forms twice was 23.8±3.8 years (range, 19-32 years). Male students composed 50.3% of the PSS sample and 51.6% of the PPSS sample.
Procedure: The participants for Study 1 were selected by searching the database for students who completed either the same form of the scale or an alternate version of the scale twice within 7-10 days; 25 students completed the original PSS twice, 25 students answered the pictorial PSS twice, and 50 students responded the first time to the written (25) or the pictorial (25) and the second time to the other survey version.
Analyses and Results: Reliability was assessed by internal consistency (Cronbach’s alpha) and test-retest reliability (intraclass correlation, r) with 7-10 days between the test and retest. The Cronbach’s alpha coefficients of the groups for Factor 1, Factor 2, and Total Scores are presented in Table 1. Cronbach’s alpha values for Factor 1, Factor 2, and Total Score ranged from 0.80-0.96, 0.69-0.97, and 0.80-0.97, respectively. The test-retest reliability scores (r) for the two Factors and Total Scores were similar, with the lowest value of 0.69 for Factor 2 in the mixed group response where the original PSS preceded the PPSS.

Study 2: Exploratory Factor Analysis
Participants: This study included 815 students who had completed the PSS questionnaire and 1,595 participants who had completed the PPSS questionnaire. For the PSS group, the mean age was 23.0±5.0 years (range 18-54 years), and 387 subjects (45.3%) were male. For the PPSS group, the mean age was 20.8±4.0 years (range, 18-68 years) and 718 (45.0%) were male.
Analyses and Results: Principal-component analyses (PCA) were performed on the PSS and PPSS question scales that measure perceived stress, using varimax rotation (Wastell, 1981). This rotation has been used in a few studies, including validation of the Mexican version of the PSC (Gonzalez-Ramirez, Rodriguez-Ayan, & Hernandez, 2013; Lee, 2012; Reis, Hino, & Añez, 2010; Sandhu & Asrabadi, 1994). Reliability was assessed by internal consistency (Cronbach’s alpha).
PCA Results on the PSS: The suitability of PCA for the PSS was assessed prior to analysis by inspecting the correlation matrix. Only one of the questions (#12) "In the last month, how often have you found yourself thinking about things that you have to accomplish?" did not have a correlation coefficient greater than 0.3. The overall Kaiser-Meyer-Olkin (KMO) measure was 0.89 with all individual KMO measures greater than 0.83, which are classified as "meritorious" to "marvelous," according to Kaiser (Kaiser, 1974). Bartlett's test of sphericity was statistically significant (p<0.0005), indicating that the data were likely factorizable.
The analysis revealed that the two components (Stress and Copying) had eigenvalues greater than 1, which explained 31.5% and 19.9% of the total variance, respectively. Visual inspection of the scree plot indicated that the two components should be retained (Cattell, 1966). The two-component solution explained 51.3% of the total variance. Varimax orthogonal rotation was employed to aid interpretability. The rotated solution exhibited 'simple structure’ (Thurstone, 1947). The data interpretation was consistent with the questionnaire attributes to measure strong loadings of "Stress" items on Component 1 and "Coping" items on Component 2. Component loadings and communalities of the rotated solution are presented in Table 2.
Table 2 PSS and PPSS Component Loadings and Communalities of the Rotated Solution

Higher factor loading values are in bold type for the two factors.
Factor Variance
PCA Results on the PPSS: As in the PSS, inspection of the correlation matrix indicated that Question #12 did not have a correlation coefficient greater than 0.3, and the overall KMO measure was 0.91, with all individual KMO measures greater than 0.89. Bartlett's test of sphericity was also statistically significant (p<0.0001).
Similar to the PSS, the analysis revealed two components that had eigenvalues greater than 1, which explained 37.6% and 14.3% of the total variance, respectively. Visual inspection of the scree plot also indicated that two components should be retained, which explained 51.9% of the total variance. The interpretation of the data was consistent with the predicted questionnaire attributes with strong loadings of "Stress" items on Component 1 and "Coping" items on Component 2. Component loadings and communalities of the rotated solution are presented in Table 2. For the PSS, Factor 1 explained 31.5% of the variance, and Factor 2 accounted for 51.3%. For the PPSS, Factor 1 explained 37.6% of the variance, and Factor 2 accounted for 51.9%. Reliability was assessed by internal consistency (Cronbach’s alpha of the PSS = 0.80 and PPSS = 0.86).
Study 3: Preference Study
Participants: Study 3 included 115 students identified in our database who had completed the PSS or the PPSS, and a preference survey composed of nine questions. The mean age of this group was 22.6±4.2 years (range, 18-62 years), and 52 students (45.2%) were males.
Measures: A preferences questionnaire that contained eight questions regarding student preferences for the PSS versus the PPSS was included. The questions included four open questions to determine the principal reasons of preference (attributes) regarding the original versus pictorial version of PSS. Additionally, multiple choice questions related to which questionnaire was easier and faster to complete, and which questionnaire (PSS or PPSS) would be selected if the participant needed to respond again. A pilot study was conducted with 24 subjects and required 6 minutes, on average, to complete the questions. Evaluations were positive regarding the instrument's length and ease of completion as well as the subjects' willingness to complete the scales and preferences questionnaire.
Analyses and Results: The findings of the closed questions were revised using simple descriptive frequencies. The qualitative analysis was done for open-ended questions. The results of participants’ preferences are presented in Table 3. Almost 75% of the participants indicated their preference for the PPSS questionnaire, as well as the intention to select this format if they needed to complete another survey in the future. Almost 70% of participants reported that the PPSS was easier to respond, and almost 75% of students found the pictorial format to be faster to complete.
Table 3 Descriptive Statistics for Preference Questions Regarding the PSS and PPSS
| Questions | PSS | PPSS | Undecided |
| Preferred questionnaire, % | 23.5 | 72.3 | 4.3 |
| Easier to respond % | 23.5 | 68.7 | 7.8 |
| Faster to complete % | 22.6 | 73.0 | 4.3 |
| Which questionnaire will you prefer if needed to respond one more time % | 27.0 | 70.4 | 2.6 |
The main attributes of the satisfaction questionnaire are presented in Table 4. The most relevant results indicate that pictorial illustrations helped participants to understand the questions (86.1%) and that the written questionnaire was boring or more difficult to complete (56.5%). A total of 32.2% of respondents reported that the written PSS was easier to respond to.
Table 4 Attributes of the PSS and PPSS Scales
| Attributes | PSS (%) |
| Why do you like the written questionnaire (PSS)? | |
| It is easy to respond to and images are helpful | 32.2 |
| Traditional | 7.8 |
| Why do you like the pictorial questionnaire (PPSS)? | |
| Illustration help to understand the questions | 86.1 |
| Stimulating | 13.9 |
| Why do you not like the written questionnaire (PSS)? | |
| Boring/hard to respond to | 56.5 |
| Confusing | 9.6 |
| Why do you not like the pictorial questionnaire (PPSS)? | |
| Not traditional | 28.7 |
| Distracting | 4.3 |
Discussion
In this study, pictorial or non-pictorial questionnaires were completed by college students to compare their psychometric properties and to determine preferences for these scales. Although previous research has documented the advantages of visual images (i.e., pictorial descriptions) in assessment tools when used by those confronted by communication disparities, to our knowledge, no study has directly examined the preference of individuals for written versus pictorial scales and their validity.
The preference questions indicated that college students found the PPSS to be shorter and easier to complete, even though both surveys contained the exact same number of questions. This characteristic provides an important consideration to increase survey responses, because the pictorial scale’s perceived shorter completion time was appealing to participants. Some studies have indicated that the perception of a shorter versus longer survey may have an impact on the completion rate (Rolstad, Adler, & Rydén, 2011).
Although evidence of the advantages of pictorial versus written-only assessments remains a recent topic of investigation, early studies indicate that pictorial descriptions can be a powerful tool for younger generations. For example, illustrations have been demonstrated to provide an overwhelming advantage for learning (Brem, Ran, & Pascual-Leone, 2013; Plumley, Armstrong, De Ribaupierre, & Eagleson, 2013; Timulak, 2014). Additionally, illustrations appear to facilitate learning by emphasizing certain points more than others that can be very useful when we consider the characteristics of the questions included in an assessment. Pictorial descriptions that include cartoon-like images have been shown to increase rates of interest and enjoyment in survey participants, providing a friendlier environment and improved testing outcomes when responding to assessments (Azer, 2007; Miyahara, Bray, Tsujii, Fujita, & Sugiyama, 2007). Thus, preferences derived from the results of this study might offer a new area of opportunity to increase survey response rates and enhance data acquisition among younger generations. Some reports indicate that response rates can be influenced by the cover design of a questionnaire, in the same way as the effectiveness of an advertisement is influenced by what is considered more likeable (Edwards et al., 2007).
The PSS scale is considered a globally applicable measure of stress (Cohen, Kamarck & Mermelstein, 1983) and has been administered to diverse college student populations (Allen, Bocek, & Burch, 2011; Gentile, Woodhouse, Lynch, Maier, & McJunkin, 2011; Janusis & Weyandt, 2010; Lee, 2012; West, Otte, Geher, Johnson, & Mohr, 2004), including Mexican students (Gonzalez-Ramirez et al., 2013; Ramirez & Hernandez, 2007). Studies 1 and 2 provided strong support for the psychometric equivalence of the PPSS and the standard PSS. Thus, test-retest reliability and factor analysis of the PPSS were comparable to those parameters measured for the standard PSS. Because sample sizes were relatively large, the lack of significant differences in these studies does not seem to be due to statistical power limitations. Thus, our findings indicate that when administered to Mexican college students, the PSS and PPSS provide similar scores.
An important strength of this study was that the samples were drawn from a large electronic database of more than 10,000 cases. However, a limitation of the study is that it was a cross-sectional, retrospective study instead of a prospective study, and that stress was not measured using other scales. However, the PSS is considered a reliable and valid measure of the degree of an individual's response to stressful situations, and the main purpose of this study was to discuss challenges and opportunities when using pictorial questionnaires among younger generations, not to determine the stress levels of the participants.
Conclusion
The two scale versions (pictorial vs. non pictorial) demonstrated comparable test-retest reliability and internal consistency (Study 1), and performed in theoretically predicted ways (Study 2). College students preferred the pictorial format versus the original text-only version and considered the pictorial format to be friendlier, clearer, and faster to complete (Study 3). Based on these results, it is suggested that pictorial descriptions added to questions might offer advantages versus other type of visuals because pictorial descriptions have been consistently shown to have a minimal effect on the psychometrics of scales, both in previous studies and in the present study (Leiner, Balcazar, Straus, Shirsat, & Handal, 2007; Leiner, Peinado, Villanos, & Jimenez, 2013; Leiner, Rescorla, Medina,Blanc, & Ortiz, 2010). Using this strategy in questionnaires, surveys, and scales can offer a more up-to-date appearance to engage younger generations and possibly encourage participation in research studies.

