


Serviços Personalizados
Journal
Artigo
 texto em
  Inglês (pdf)
 Artigo em XML
 Referências do artigo
 Enviar este artigo por email
Indicadores
-
 Citado por SciELO
 -
 Acessos
Links relacionados
-
 Similares em
SciELO
Similares em
SciELO
Compartilhar

 Permalink
Contaduría y administración
versão impressa ISSN 0186-1042
Contad. Adm vol.62 spe 5 Ciudad de México 2017
https://doi.org/10.1016/j.cya.2017.09.001
Articles
Fuzzy logic and financial risk. A proposed classification of financial risk to the cooperative sector
a Universidad Técnica de Ambato, Ecuador
Applying fuzzy logic to financial indicators is not a well disseminated proposal in the accounting field. This methodology allows observing the results of financial ratios with a broader perspective, showing neither completely true nor completely false results, since they can take an undetermined truthfulness value within a set of values, applying the fuzzy logic theory. The objective of this work is to introduce the reader to the application of fuzzy logic on financial risk indicators, using the ratios of one of the sector one cooperatives of Ecuador, and thus validate the level of relevance of this indicator when compared to the standardized objective of the CAMEL model and its risk rating. To apply this theory, linguistic variables were used, the ranges of which were evaluated in 0-1 scales. It was determined that the fuzzy methodology, applied to financial risks, presents a greater level of relevance toward a good credit rating, ensuring a low level of risk and a very good solvency. However, in periods of low economic activity it would stagnate in this level due to the increased risk.
Keywords: Fuzzy logic; Financial indicators; Xfuzzy environment; Risk rating
JEL classification: C15; C44; C65
Aplicar la lógica difusa en indicadores financieros es una propuesta poco difundida en el ámbito contable. Esta metodología permite observar los resultados de ratios financieras con una perspectiva más amplia, mostrando resultados no totalmente ciertos ni totalmente falsos, ya que pueden tomar un valor indeterminado de veracidad dentro de un conjunto de valores, aplicando la teoría de lógica difusa. El objetivo de este trabajo es presentar al lector la aplicación de la lógica difusa en indicadores de riesgo financieros, utilizando las ratios de una de las cooperativas del segmento uno del Ecuador y, de esta manera, validar el nivel de pertinencia que tiene este indicador al compararlo con la meta estandarizada del modelo CAMEL y sus calificaciones de riesgo. Para aplicar esta teoría se utilizaron variables lingüísticas, cuyos rangos se valoraron en escalas de 0 a 1. Se determina que la metodología difusa aplicada a los riesgos financieros presenta un nivel de pertenencia mayor hacia la calificación crediticia buena asegurando un nivel de riesgo escaso y una muy buena solvencia. Sin embargo, en periodos de actividad económica baja se estancaría en este nivel por el aumento del riesgo.
Palabras clave: Lógica difusa; Indicadores financieros; Entorno Xfuzzy; Calificación de riesgo
Códigos JEL: C15; C44; C65
Introduction
Fuzzy logic possesses a broad utility in different fields of knowledge. The objective of this study is to categorize the status of a creditor entity from the interpretation of the financial risk indicators. To this end, fuzzy logic is used; and through the use of linguistic variables, a better interpretation of the traditional financial indicators can be achieved (Benito & Duran, 2009).
According to the report of the Superintendent of Popular and Supportive Economy corresponding to 5 years of management, the Ecuadorian cooperative financial sector registers a total of 696 credit unions, including a central fund, as of May 2017. These are categorized into 5 segments, with assets totaling 9978 million dollars as of March 2017, and 5,977,169 members according to data as of May of the same year. This shows great growth in recent years, with segment 1 conferring 66% of the microcredit (SEPS, 2017). Said growth is accompanied by the sudden closure of institutions of the cooperative sector that did not manage to comply with the operating rules determined by the control organisms. This sector was taken as a referent for our study because these institutions are evaluated through the financial risk indicators to determine their level of solvency.
By interpreting the financial risk indicators with emphasis on fuzzy logic, a more flexible environment is obtained in the interpretation of the financial information. The context used by the fuzzy methodology in the decision-making process allows the decision maker to graphically observe the membership levels to each of the credit ratings proposed. This study uses the objectives of the CAMEL financial analysis model (Capital, Asset, Management, Earning, and Liquidity) as reference, given that it is one of the most commonly used methodologies in the measurement of financial risk at the international level (Benito & Duran, 2009).
Bibliographic review
Fuzzy logic
The fuzzy logic methodology was developed in the mid-1970s by Lotfy A. Zadeh at Berkeley University (California), known at first as the incompatibility principle and subsequently recognized as fuzzy logic, and which description is: "As the complexity of a system increases, our capability to be precise and to create instructions regarding its behavior decreases until the threshold beyond which precision and meaning are excluding characteristics". (Zadeh, 1994, p. 80)
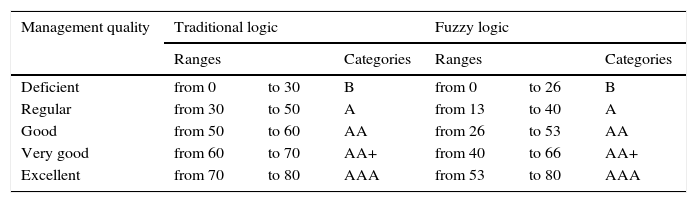
Figure 1 describes the interpretation of information for traditional logic and fuzzy logic, allowing to observe the strong change in the transition curve between the proposed ranges. The search for order within chaos leads to bifurcation, however, fuzzy logic produces a symmetry rupture point that has a traditional geometry in fractal terms that describes a geometric object, with wide scale ranges (Gil, 2000, 2005). This means that it emphasizes the blurriness of the variables, particularly on the everyday and corporate bases due to the dissonance with reality (Restrepo & Vanegas, 2015).

The processes in which the qualities or competences of the set are compared must be carried out after defining the fuzzy set or subsets (Ávila & Galeana, 2013). According to Cardona (2015), when the conjugations of variables are of the "if..., then..." type, the fuzzy logic model establishes categories (linguistic values) and membership functions for each input and output variable (denominated linguistic variable). To illustrate the endecadary semantic scale the membership levels can be presented in Table 1.

Types of fuzzy logic models
There are three classifications for this type of logic: (1) models in fuzzy continuous-time (MFC), used to estimate real financial options through the use of trapezoidal numbers; (2) fuzzy pay-off method (FPOM), works with triangular distributions, the value of which emerges from the representative fraction of the positive value area divided for the total area of possible values of the triangle and the possible average value of the fuzzy landscape; (3) models in fuzzy discrete-time (MFD), which adapt the binomial model to the fuzzy logic allowing to estimate the upward and downward movements (Milanesi, 2014).
Fuzzy logic and financial risk analysis
Rico and Tinto (2008) present the application of the fuzzy sets in five areas of business organizations related to accounting, where we find problems concerning: portfolio selection, financial mathematics, capital budget, technical analysis, credit analysis, and financial analysis.
Management control is a tool on which a financial institution relies in order to measure its performance. Risk indicators are indispensable tools in measuring said performance through formulas and mathematical calculations applied to the financial statements, the results of which help us measure the health of individual financial institutions (Valencia & Restrepo, 2016).
There are many systems that allow measuring the performance of lending institutions, and from their application, the credit ratings are created. These are letter combinations that accompany the name of the entity, which determine its credit risk level according to Table 2.

Medina (2006) proposes fuzzy logic as a tool to solve financial problems, since it is useful in the optimal selection of investment portfolios as well as in dealing with the uncertainties of financial assets in the stock market. The traditional methodology requires extensive information due to the historical sequences requirement that determines the usual analysis models, whereas the uncertainty methodology handles a more flexible form due to its possibilistic approximation (Kaufmann & Gilaluja, 1988).
The fuzzy inference models were proposed by Medina and Paniagua (2008) to measure the credit study by determining its viability to minimize the counterparty risk in the credit granting processes, since it could be measured through indicators applied to the client such as payment capacity, debt capacity, credit rating that feeds the fuzzy system as an evaluation tool, providing consistent answers regarding the amount and the concession period (González, Flores, & Gil, 2010) .
CAMEL model
The CAMEL model allows identifying financial difficulties in institutions, particularly banking institutions. Its acronym stands for: Capital (C), Asset quality (A), Management (M), Earnings (E), and Liquidity (L), "it is defined as a uniform rating system for financial institutions" (Crespo, 2011) . The process to measure credit risk is done based on models that allow measuring the performance (Velez, 2003) through the application of financial ratios.
The CAMEL method can develop a type of financial analysis that is sustained on the construction of financial reasons, which originate in the balances derived from the financial institutions.
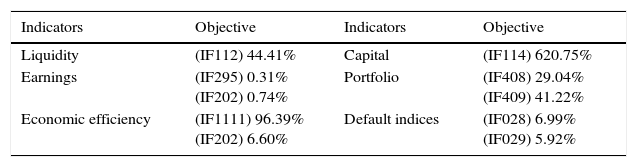
In this list, we can observe some of the ratios that have application objectives or standards in the CAMEL model.
Table 4 presents the reference values that an institution must reach for each indicator. A credit rating described in Table 1 is determined with the financial reasons applied to the consolidated statements. Traditional logic would understand it as follows:
CAC "X" AAA+ Met the required objectives
CAC "Y" BBB+ Below the required average
CAC "Z" CCC Far below the required average
Table 4 Indicators of the CAMEL model.

FD, available funds; SP, patrimonial sufficiency; PP, average capital; AP, average asset; CCCMV, maturing commercial credit portfolio; CCCNV, maturing consumer loan portfolio; GO, operating expense; GPO, estimated personnel costs; MCCCM, default commercial credit portfolio; MCCCN, default consumer loan portfolio.
Source: Own elaboration.
Fuzzy logic based systems
A fuzzy logic based system is comprised by Figure 2.

For its understanding, the diffuser block is placed according to the membership degree to each of the fuzzy sets through the characteristic function. Subsequently, the data of the variable to be analyzed is entered with its concrete values, obtaining as outputs the membership degrees to the studied sets.
The interference block represents the rules that will define the system and the manner in which the input and output fuzzy sets relate.
The method that allows obtaining the concrete result with degrees of security from the fuzzy sets, after applying mathematical defuzzification methods, is called defuzzification (Rico & Tinto, 2008).
Its implementation is done through a fuzzy logic based system, which functions as a program that is executable through a conventional microprocessor (or microcontroller), which unlike other systems, the calculation resources used are relatively low (Lorenzana, Barberá, & Terceno, 2001). Considering that there are various fuzzy logic based systems, we present some LD application software such as: FuzzyTECH, MATLAB, TILShell and FIDE, among others. Where MATLAB is currently the most complete environment since it allows working from a single environment with both classic and innovating techniques.
However, it was analyzed that the Xfuzzy software is an accessible application that allows identifying the development planning and execution processes according to the stated objectives (Morillas Raya, 2006).
The aim of the study proposed is to interpret the financial risk indicators from the perspective of fuzzy logic, aiming to determine the credit rating membership levels. This process helps us measure their performance level from a perspective that values the qualities more than the quantities. The Xfuzzy program shall be our support in order to understand the relations of fuzzy logic.
Cooperativism in Ecuador
Cooperativism in Ecuador begins with the formation of human society, whose practices have survived the test of time, particularly, indigenous organizations created with the purpose of building roads and housing, among others. Other organizations that standout are unions and artisans, whose capacity has demonstrated forms of cooperativism.
The beginnings of organized cooperativism in Ecuador emerge toward the end of the 19th century and beginnings of the 20th century, with the creation of the first Savings Bank of the Artisans Society, lovers of progress in 1886. By 1937 to 1963, laws and standards were created to regulate cooperativism, classifying them into four cooperative classes: (1) Production, (2) Credit, (3) Consumer, and (4) Mixed. Subsequently, from 1964 to 1988 the boom of the cooperative sector took place, creating the National Cooperative Council (NCC) and a great interaction from the Federation of Savings and Credit Cooperatives (FECOAC for its acronym in Spanish). Consecutively, from 1989 to 2006, free-market policies emerged, which modify the General Law for Institutions of the Financial System, the result of which was the financial crisis of 1999 and the dollarization and emergence of the National Association of Savings and Credit Cooperatives (ASOCOAC for its acronym in Spanish) due to the closing of various sector entities, thus leading Ecuador toward a new horizon of cooperative management (Miño, 2013).
From 2007 onward, the new constitution mandates Ecuador to create standards for the regulation and control of the cooperative sector, such as the Organic Law of the Popular and Supportive Economy and the regulatory body of the Popular and Supportive Economy Superintendence (SEPS for its acronym in Spanish), which began their functions in June 2012. These institutions are classified by segments that go from one to five. Their status is identified by their contribution in the sector, transaction volume, number of associates, number and geographical location of operational offices throughout the country, amount of assets, and capital (Superintendencia de Economía Popular y Solidaria, 2013).
Methodology
Through the case study methodology, this work intends to observe the financial ratio results with broad analysis perspectives, showing not entirely irrefutable nor completely inexistent results; applying the fuzzy logic theory and comparing it with the traditional analysis, it can be classified into the credit ratings issued by both international and local organizations. To this end, the SEPS database was used in order to obtain the financial information from the Cooperativa Coprogreso from segment one.
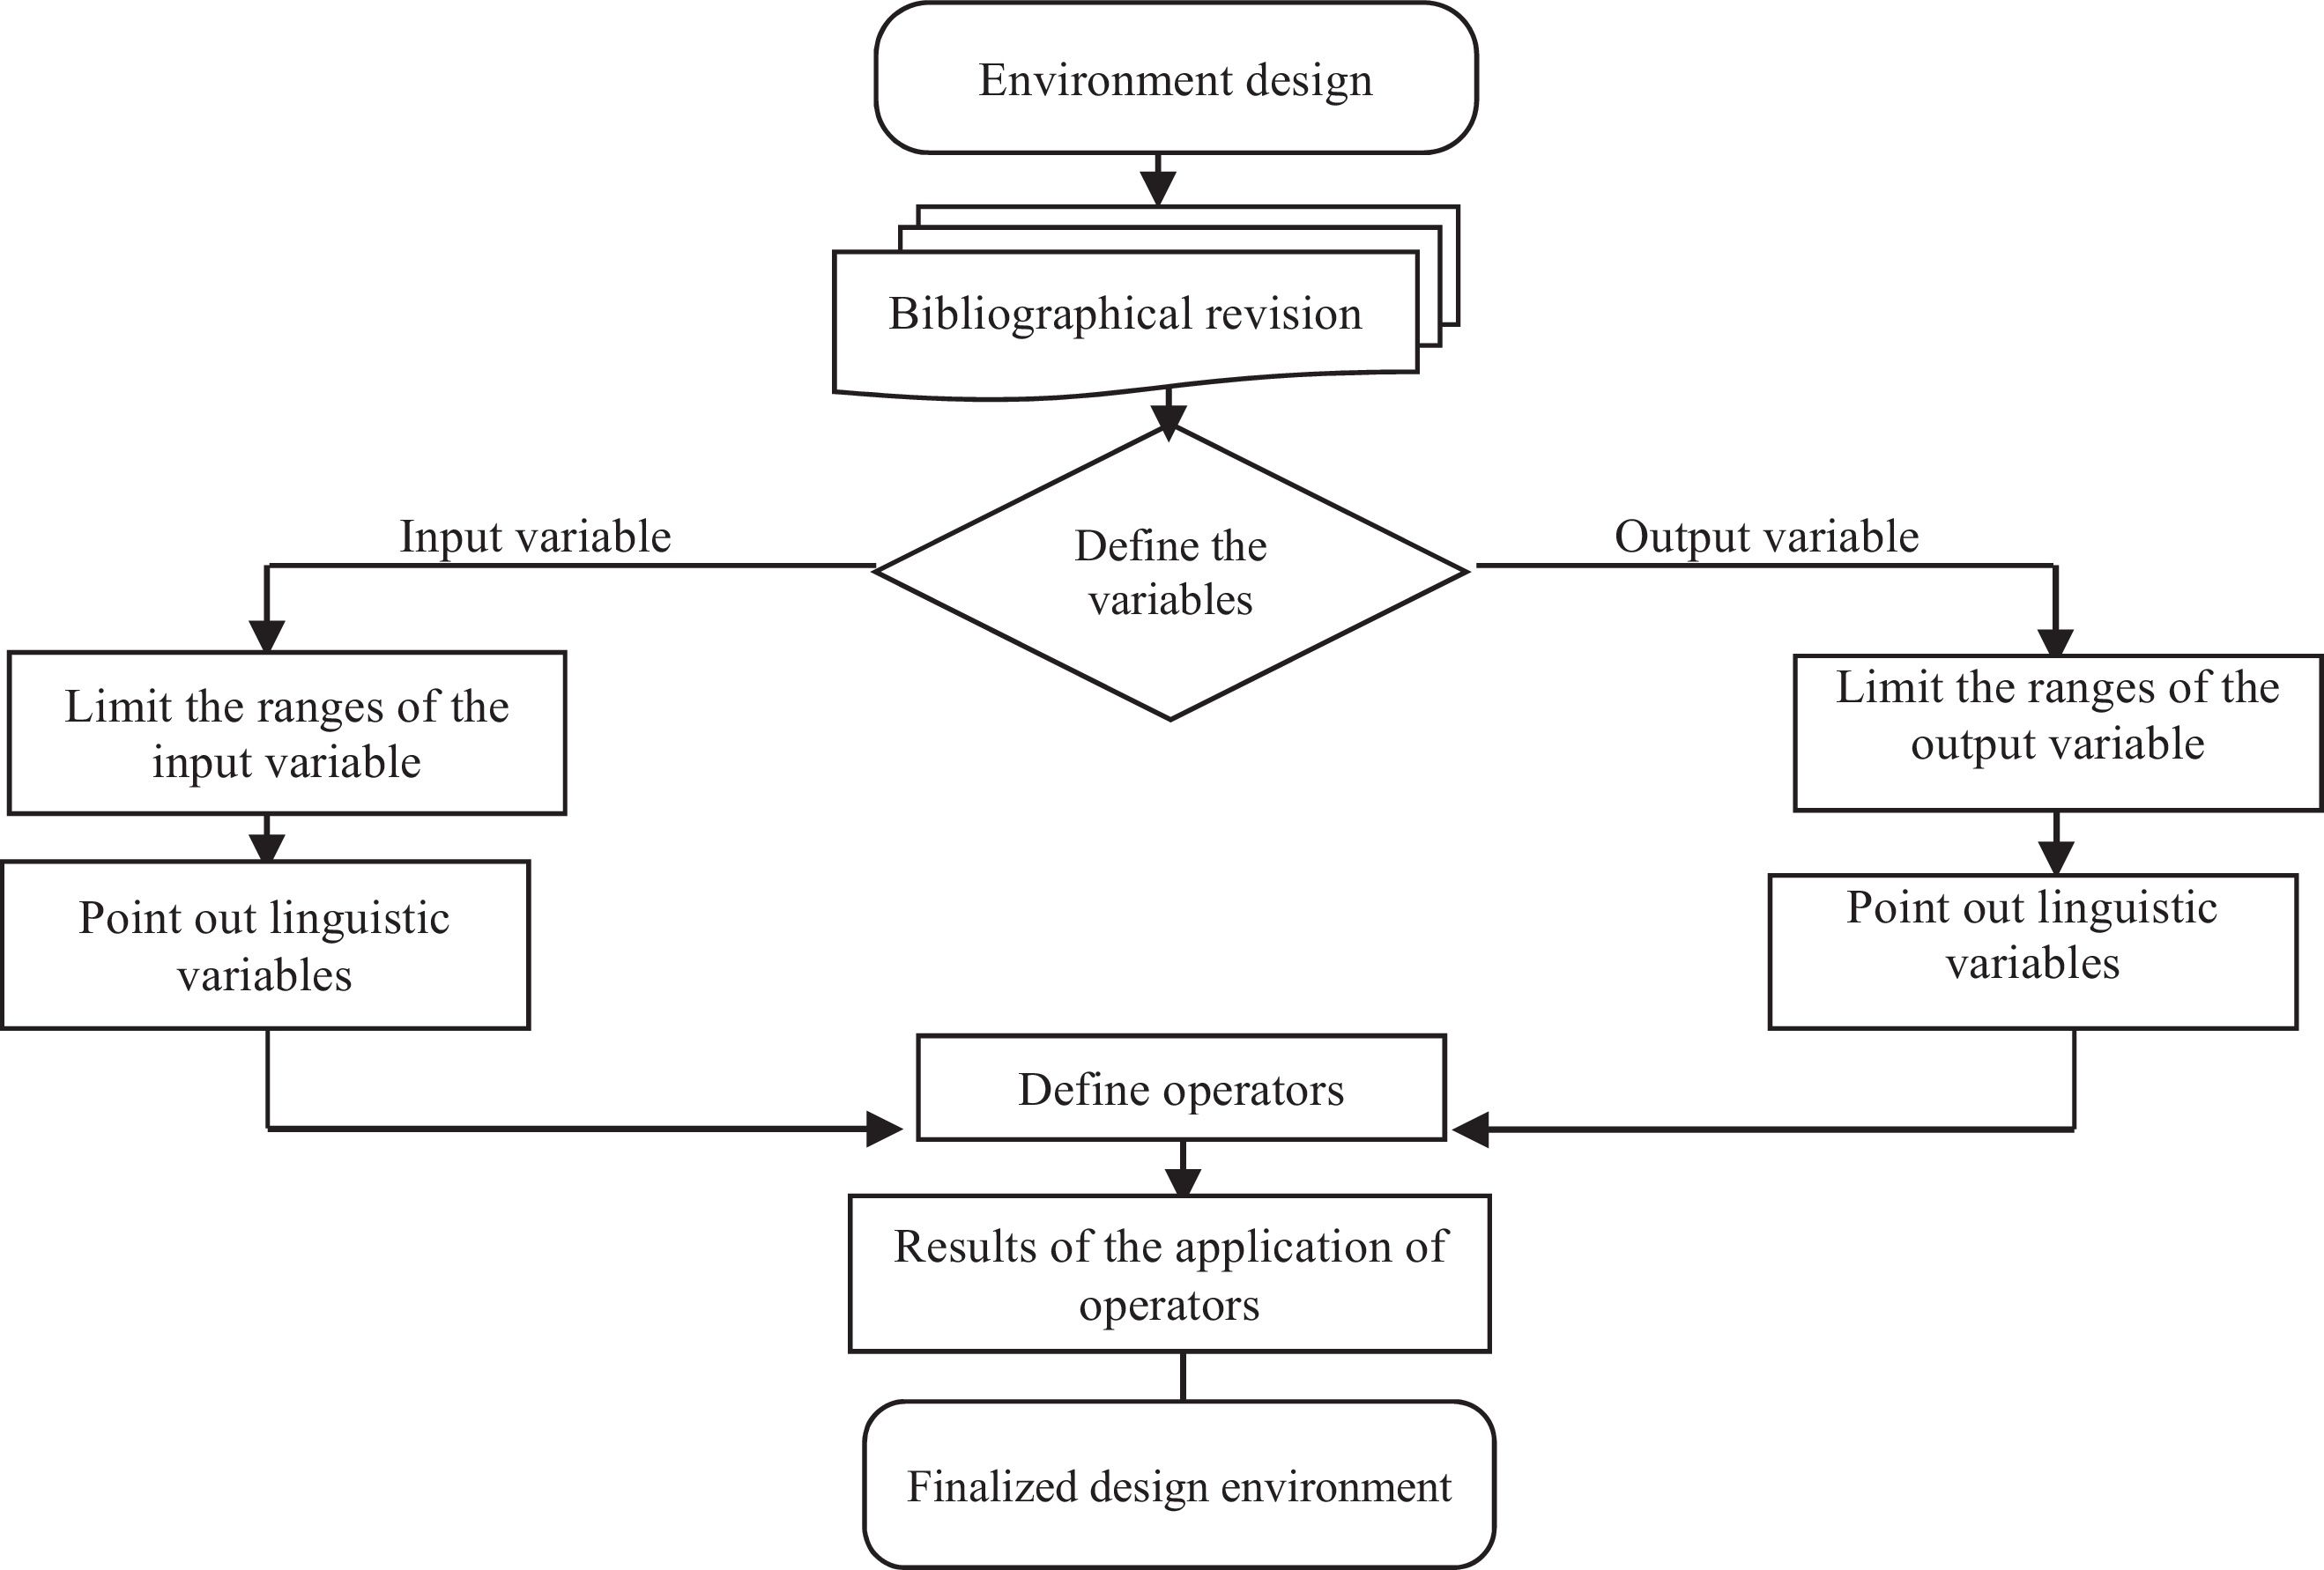
Using the Xfuzzy program, we proceeded to determine the different relations between the indicators of capital adequacy and available funds, which served as reference in understanding the relations of the fuzzy logic; the resulting graphs of this process will help us understand the proposed study. Said process is detailed in Figure 3.
The target objectives preestablished by the CAMEL model are our defined reference to compare with the indicators of the cooperative sector and the model company (Fig. 4).

The maximum and minimum values of each variable are defined with reference to the population sample (Segment 1 Cooperative Sector Ecuador), and ranges are defined using statistical methods to reference the previously required values.
Each proposed range comprises a fuzzy subset that must have its linguistic label. The limit for each subset provides us with the default system, making it possible to customize them for fuzzy logic; in traditional logic, we obtain it through statistical methods.
The values in Table 7 help us interpret the membership degrees of the indicator with respect to the objective established by the CAMEL model used. By observing the descriptive ranges of the input variables, it is possible to identify that fuzzy logic differs from traditional logic, given that in fuzzy logic the rating frequency is not sequential, whereas the ranges in traditional logic possess a formal and uniform sequence. This is due to the fuzzy methodology utilized for this study, the information of which helps us in the interpretation and reading of the results obtained.

The values in Table 7 show the membership degrees of the financial institution with respect to the credit rating of both the traditional form and the fuzzy form. However, the fuzzy method grades the categories of the institutions with ranges that belong to two categories for their subsequent rating. Unlike the traditional logic that contains sequential ranges for its categorization in one of the ranges, the fuzzy linguistic variables allow the decision maker to identify with greater amplitude the category in which the indicator belongs to with a greater inclination, and the category in which the result belongs to with a lesser inclination (Table 8).
Once the fuzzy variables have been structured, the operators to be worked with are selected to obtain the expected results as detailed in Table 9.

The input and output variables were entered into the environment of the program, as delimited in Table 6.

Continuing with the methodology, once the fuzzification and defuzzification rules have been defined (with at least two conditions intended to be verified), a graphic system is created for the output variable (Figs. 5-7) (6).
Input variable: Reference subsets by indicator.
Output variable: Subsets by credit rating.
Source: Xfuzzy program.
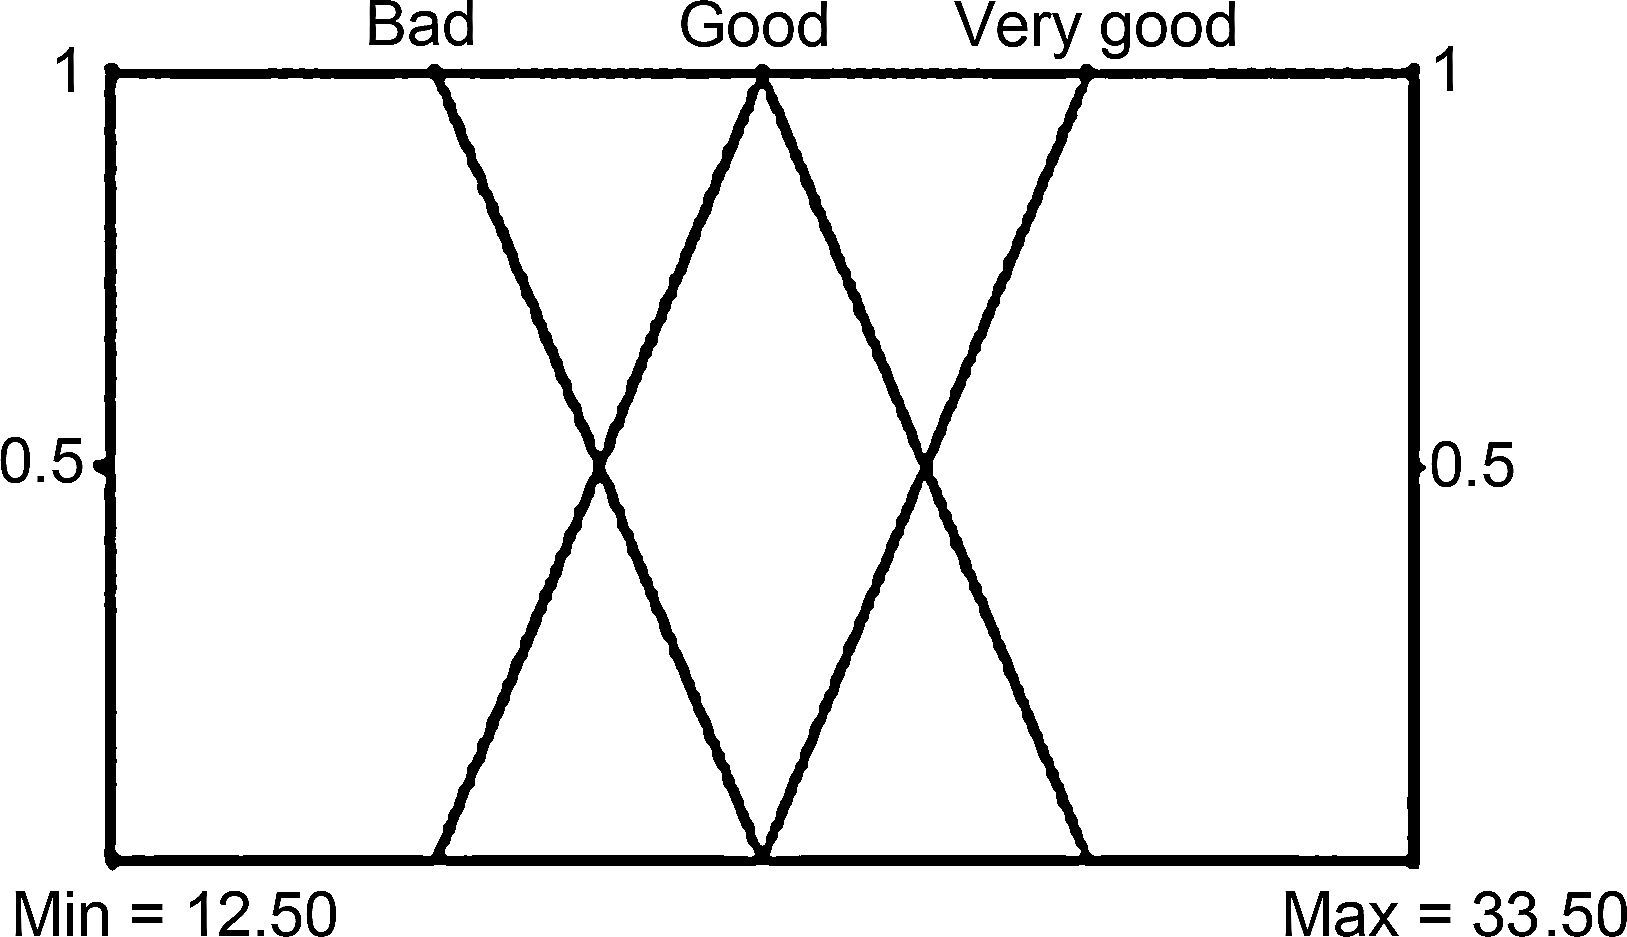
Figure 5 Graphic representation of the input variable.


Figure 7 represents the environment of the program, where the different subsets created are visualized and, depending on the input value, makes it possible to graphically visualize the set that belongs to the entered value and its membership percentage. Finally, in this part of the process the values of each of the input variables can be changed, using the cursors for visualization in the output variable.
Figure 8 visualizes the transition curve between the ranges of the formed variables, presenting a subtle curve. The result of the application of the fuzzy methodology is visualized through the colors or nuances that help identify the data entered and the membership levels between the proposed subsets.

Case study
As has been described in the literature, the cooperative sector of Ecuador is comprised by five segments. For the application of the fuzzy methodology, a cooperative called Cooperativa Coprogreso from segment one was analyzed, as it had available information, with the following financial indicators: earnings, adequacy, available funds, and capital for the year 2015. With the identified data, the input operational variables were applied.
The cooperative selected for our study, which we shall call Coop "X", had the risk rating and analysis applied through both traditional and fuzzy logic in order to identify the advantages that this tool could have in the financial sector.
Results
Application of the traditional logic
Table 10 presents the indicators that the SEPS (control body in the country) defines to qualify the ratings of each subset along with its respective evaluation, using three ranges, both for traditional logic and for fuzzy logic (Table 11).


As can be observed in Table 2, this provides the ranges defined for each indicator, detecting that Coop "X" has a valuation of 51 points, allowing to verify in Table 3 that the category granted by its credit quality rating is AA or a Good management quality, with strong protective factors, modest risk, very high credit rating, and protection from acceptable investors.

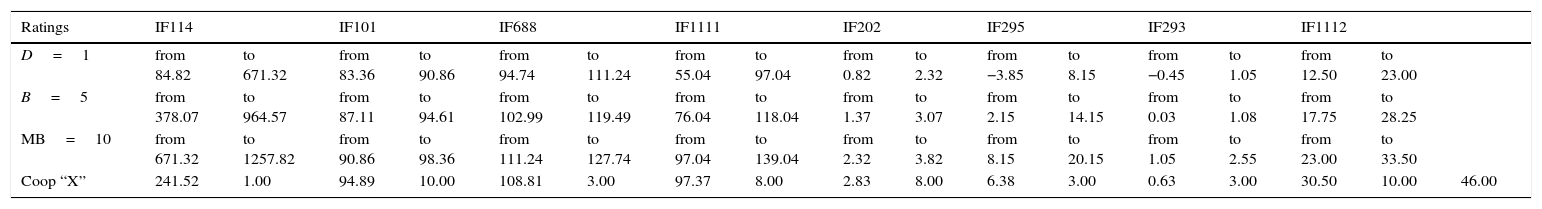
Application of fuzzy logic
The application of the non-traditional logic in Table 4 shows the ranges of the fuzzy indicators, obtaining the result that Coop "X" has indicators such as: IF688, IF1111, IF202, IF295, IF293, with values that belong to two fuzzy subsets, providing a score of Good and Very Good due to the 46 points it shows in Table 5. The fuzzy methodology places the cooperative in two credit ratings, with 0.8 (over one) being a good rating, where the protective factors are strong, the risk is modest, the credit quality is very good, and the protective factors from the investors are very strong (Tables 12 and 13).

However, said score also grants a membership level of 0.4 to the very good plus rating, since it places it at a superior level with excellent risk and credit ratings.
Conclusions
The traditional financial analysis shows an interpretation and linear rating ranges through categories and statistical objectives established by the control body, which are pursued by its institutions in order to obtain the optimal categories that reflect their level or status in the market. The results from applying fuzzy logic in Coop "X" show a break in symmetry with varied scale ranges as detailed by Gil (2000, 2005). Measuring these ratings using flexible methods allows understanding the business information in a broader context, and not only evaluate the quantity but also the qualities of the different ranges as described by Valencia and Restrepo (2016).
The cooperative sector is very important in the financial system of Ecuador, and the control bodies evaluate it using the established standardized models. By applying fuzzy logic, it is possible to verify that the membership levels for the cooperative segment were placed at the good and very good levels. This means that the credit quality is in the upper ranges, providing strong protective factors and moderate risks; however, in periods of low economic activity their risk can increase, thus decreasing its rating.
The analysis on the application of fuzzy logic in the financial sector allows us to determine a risk rating, without omitting the effects of the environment in which said rating is produced, or to obtain said rating through the study of CAMEL indicators, and applying defuzzification mathematics as mentioned by Rico and Tinto (2008).
Finally, we would like to note that the application of the Xfuzzy program contributes with greater objectivity in the application of fuzzy logic in the financial sector, due to its 3D presentation.
This way, we can identify the approximation level of rating tendency of a cooperative within the different credit categories.
Referencias
Arias, L. y Carrero, J. (2011). Diseño de un modelo CAMEL para evaluar inversiones realizadas por las cooperativas financieras en títulos emitidos por el sector real. Universidad ICESI [consultado 15 Ago 2016]. Disponible en: Disponible en: https://www.icesi.edu.co/departamentos/finanzas_contabilidad/images/micro/2011/micro_camel.pdf . [ Links ]
Ávila, C. F. y Galeana, F. E. (2013). La lógica difusa en la planeación de la capacitación. INCEPTUM-Revista de Investigación en Ciencias de la Administración, 15, 159-176. http://inceptum.umich.mx/index.php/inceptum/article/viewFile/229/210. [ Links ]
Benito, M.T., Duran, V.I. (2009). Lógica borrosa. Universidad Carlos III [consultado 30 Nov 2016]. Disponible en: Disponible en: http://www.it.uc3m.es/jvillena/irc/practicas/08-09/10.pdf . [ Links ]
Cardona, O.L., (2015). Sistema difuso para la evaluación de un modelo de riesgo de mercado en un portafolio de deuda pública en Colombia. Universidad EAFIT [consultado 8 Nov 2016]. Disponible en: Disponible en: https://repository.eafit.edu.co/bitstream/handle/10784/7431/LuisGuillermo_CardonaOchoa_2015.pdf?sequence=2&isAllowed=y . [ Links ]
Crespo, G. J. (2011). CAMEL vs. discriminante, un análisis de riesgo al sistema financiero venezolano. Ecos de Economía, 33, 24-47 [consultado 2 Feb 2016]. Disponible en: http://www.scielo.org.co/pdf/ecos/v15n33/v15n33a2.pdf. [ Links ]
Gil, J. (2000). Génesis de una teoría de la incertidumbre. Encuentros Multidisciplinares, 6, 1-8 [consultado 14 Abr 2016]. Disponible en: Disponible en: http://www.encuentros-multidisciplinares.org/Revistan%BA6/Jaime%20Gil%20Aluja%201.pdf . [ Links ]
Gil, J. (2005). La matemática borrosa en economía y gestión de empresas II. Matematicalia-Revista Digital de Divulgación Matemática, 4, 1-6. http://www.matematicalia.net/index.php?option=com content&task=view&id=131&Itemid=106. [ Links ]
González, F., Flores, B., & Gil, A. (2010). Modelos y Teorías para la evaluación de inversiones Empresariales. FeGoSa - Ingeniería Administrativ S.A. [ Links ]
González, F. (2012). Las decisiones financieras en la incertidumbre en la empresa: usando Black-Scholes como estrategia. Real Academia de Ciencias Económicas y Financieras.,. Disponible en: Disponible en: https://racef.es/archivos/discursos/216_gonzalezsantoyo_web.pdf , fecha de consulta 30/06/2017. [ Links ]
Kaufmann, A. y Gilaluja, J. (1988). Modelos para investigación de efectos olvidados. Vigo: Milladoiro. [ Links ]
Lorenzana, T., Barberá, M. y Terceño, A. (2001). Aplicaciones de la teoría de los subconjuntos borrosos en el análisis y selección de inversiones reales en ambiente incierto. Non idem iterum, Semper novum: homenaje al Prof. Dr. Manuel Ortigueira Bouzada. Sevilla: Edición Digital@ tres. [ Links ]
Mascareñas, J. (2008). Riesgos económico y financiero. Gaceta Financiera. Universidad Complutense de Madrid. [consultado 20 Jul 2016]. Disponible en: Disponible en: http://www.gacetafinanciera.com/REF.pdf . [ Links ]
Medina, H. S. (2006). Estado de la cuestión acerca del uso de la lógica difusa en problemas financieros. Cuaderno de Administración, 32, 195-223, [consultado 20 Jul 2016]: Cuaderno de Administración, 32, 195-223, [consultado 20 Jul 2016]: http://www.redalyc.org/articulo.oa?id=20503209 . [ Links ]
Medina, S. y Paniagua, G. (2008). Modelo de inferencia difuso para estudio de crédito. Dyna, 75(154), 215-229. Disponible en: http://www.redalyc.org/articulo.oa?id=49615421. [ Links ]
Milanesi, G. S. (2014). Valoración probabilística versus borrosa, opciones reales y el modelo binomial. Aplicación para proyectos de inversión en condiciones de ambigüedad. Estudios Gerenciales, 30, 211-219. http://dx.doi.org/10.1016/j.estger.2014.01.018 [consultado 2 Oct 2016]. [ Links ]
Miño, W. (2013). Historia del cooperativismo en el Ecuador. Quito: Editogran S.A. [consultado 5 Abr 2017]. Disponible en: Disponible en: http://www.politicaeconomica.gob.ec/wp-content/uploads/downloads/2013/04/Libro-Cooperativismo-Final-op2-Alta-resolucio%CC%81n.pdf . [ Links ]
Morillas Raya, A. (2006). Introducción al análisis de datos difusos. Edición electrónica [consultado 18 May 2016]. Disponible en: Disponible en: http://www.eumed.net/libros-gratis/2006b/amr/ . [ Links ]
Puente, S., Perdomo, C.C., Gaona, E. (2013). Generación automática de sistemas lógicos difusos tipo Mamdani sobre microcontrolador de 8 bits. Tecnura (Número especial), 93-108 [consultado 11 Jun 2016]. Disponible en: Disponible en: http://revistas.udistrital.edu.co/ojs/index.php/Tecnura/article/view/7240/8899 . [ Links ]
Restrepo, J. y Vanegas, J. (2015). Internacionalización de las pymes: análisis de recursos y capacidades internas mediante lógica difusa. Contaduría y Administración, 60(4), 836-863. http://dx.doi.org/10.1016/j.cya.2015.07.008. [ Links ]
Rico, M. y Tinto, J. (2008). Matemática borrosa: algunas aplicaciones en las ciencias económicas, administrativas y contables. Contaduría Universidad de Antioquia, 52, 201-213 [consultado 2 Jun 2016]. Disponible en: Disponible en: https://search.proquest.com/docview/750061085?accountid=36765 . [ Links ]
SEPS, (2017). Informe 5 años de gestión 2012-2017. Superintendencia de Economía Popular y Solidaria [consultado 29 Jun 2016]. Disponible en: Disponible en: http://www.seps.gob.ec/documents/20181/584491/Informe+5+años+de+gestión+2012-2017.pdf/7be16704-446b-4a1a-ad6d-0470e128d9e7?version=1.0 . [ Links ]
Superintendencia de Economía Popular y Solidaria, (2013). Boletín trimestral I. Un vistazo del sector cooperativo por segmentos y niveles. Superintendencia de Economía Popular y Solidaria [consultado 7 Sep 2016]. Disponible en: Disponible en: http://www.seps.gob.ec/documents/20181/26626/Bolet%C3%ADn%20trimestral%2024_04_2013_final.pdf/68b53d50-3a0d-461a-8bd9-bbad0c5589a6 . [ Links ]
Superintendencia de Economía Popular y Solidaria (2015). Boletines Financieros Mensuales. Disponible en: http://www.seps.gob.ec/estadistica?boletines-financieros-mensuales. [ Links ]
Valencia, M. y Restrepo, J. (2016). Evaluation of financial management using latent variables in stochastic frontier analysis. DYNA, 199, 35-40. http://dx.doi.org/10.15446/dyna.v83n199.54612. [ Links ]
Velez, I. (2003).Decisions under uncertainty [decisiones bajo incertidumbre]. SSRN, 1-47. http://dx.doi.org/10.2139/ssrn.986876. [ Links ]
Zadeh, L. A. (1994). Fuzzy logic. Neural networks and soft computing. Communications of the ACM, 77-84. http://dx.doi.org/10.1145/175247.175255. [ Links ]
Received: January 11, 2017; Accepted: August 15, 2017
 Este es un artículo publicado en acceso abierto bajo una licencia Creative Commons
