


 text new page (beta)
 English (pdf)
 Article in xml format
 Article references
 Send this article by e-mail
 Cited by SciELO
  Similars in
SciELO
Similars in
SciELO 
 Permalink
Introduction
The international business literature has recently begun to produce a growing number of studies of the phenomenon of real activities management, and this is particularly true of North America. Interest intensified after a series of financial scandals in large corporations, such as Enron, resulted in the United States passing the "Sarbanes-Oxley Act" (SOX) in July of 2002. Among other provisions, the SOX stipulates more restrictive accounting standards, with the objective of limiting management's discretion with relation to disclosure of transactions that have an effect on the company's results. Some studies, such as one by Cohen and Zarowin (2008), found that some managers reacted by trading off accruals-based management against real activities after the SOX was passed. Brazil is going through a process of convergence with International Accounting Standards and since 2010 a large proportion of companies have been obliged to publish financial statements in accordance with the International Financial Reporting Standards (IFRS). Little is currently known about the impact that adoption of the IFRS has had on earnings management by companies on the Brazilian capital markets and less still is known about each of the two strategies for manipulation of results - accruals-based management and real activities management (Medeiros Cupertino, Lopo Martinez, & da Costa, 2016).
In view of this gap, the subjects that this article will discuss are identification of manipulation by real activities, the impact of real activities management on future performance and the trade-off between manipulation by accruals and by real activities, with reference to the Brazilian setting (Lopo Martinez, 2013).
The overall objective chosen for this study was to identify whether earnings management through real activities (specifically, earnings management through manipulation of sales, discretionary expenses and costs of production) has an impact on the results reported in the financial statements. This general study design can be refined to allow investigation of the interrelationships between real activities and accruals when used for earnings management. This is an important step in the analysis for two reasons. Fields, Lys, and Vincent (2001) point out that investigations centered on just one of the two forms of manipulation will not capture the entire effect of earnings management activities and, therefore, can only report partial rather than conclusive results.
Zang (2012) points out that analysis of management strategies in conjunction makes it possible to identify the economic implications of accounting choices. Specifically, it becomes possible to verify whether the costs of accruals-based manipulation impact on the choice to employ manipulation by real activities. Therefore, in this step evidence is sought that could demonstrate possible trade-off between the types of management in manipulation of financial results, considering the determinants (restrictions/costs) of each strategy (Francis, Hasan, & Li, 2016). Additionally, the effect of adoption of the IFRS on the levels of manipulation by accruals and by real activities will also be investigated in this step.
This study contributes to the literature on earnings management in Brazil by presenting evidence of the trade-off between strategies for manipulation of results and the impact on companies' future performance. Brazil has been attracting more and more direct and financial investment from the international community. Earnings management is a hot issue under debate in the United States, United Kingdom, and other European countries. The strategies of earnings management applied in Brazil and its costs may be an issue of interest to foreign regulators and investors as well as other players. Thus, it is envisaged that this research should prove useful to a range of different stakeholder groups. For example, investors need to be able to identify the existence of manipulation of results by real activities and the implications it has for the current and future performance of the entity in order to provide a firm foundation for their investment decision-making processes. In turn, regulatory authorities also need to be alert to the practice of manipulation of financial statements, in order to be in a position to institute appropriate regulations to prevent earnings management or encourage its adequate disclosure.
Review of the literature
The term "earnings management" is used to describe the decision that some managers take to employ accounting methods or to direct operational activities in such a way as to affect earnings with the intention of meeting specific objectives in terms of the results reported in financial statements. In turn, the earnings management methods employed for such ends can be classified in terms of whether they affect the process of accruals-based accounting or impact on normal operational activities (Enomoto, Kimura, & Yamaguchi, 2015; Sohn, 2016; Zhu, Lu, Shan, & Zhang, 2015). The first approach is known as "accrual-based management" (ABM) and the second as real activities management (RAM).
Relationship between RAM and ABM
Graham, Harvey, and Rajgopal (2005) point out that managers employ the techniques of earnings management with the objective of hitting their previously defined profit targets. Zang (2012) warns that it is unlikely that just one of the two manipulation strategies - RAM or ABM - will be employed, explaining that it is more likely that there will be a degree of balancing between them, in order to achieve the desired effect on the end of year results. One factor that encourages adoption of a combination of these techniques is the fact that both management by accruals and management by real activities impose restrictions (costs) on management. For example, accruals stated in a current period must be reversed in future periods, which allows little room for management to employ the same tool in consecutive periods. On the other hand, one of the consequences of the other possibility, real activities management, is to reduce the value of the company (Badertscher, 2011). Zang (2012) claims that management trade off the two management techniques against each other and that the balance that is struck is linked to the costs of employing RAM and ABM. Specifically, the manager will favor the manipulation technique with the lowest costs attached.
Manipulation by accruals or by real activities has different impacts on the results. This is because the effects of RAM are unknown at the time at which the manager chooses this type of manipulation and will only be known when the results are calculated. In contrast, discretionary accruals are applied at the end of the financial period, at which point management already know the extent to which accounting profit - before the effects of earnings management - falls short of the target profit (Cupertino, Martinez, & da Costa, 2015). This characteristic of ABM enables its effects to be direct and in proportion to the sums manipulated. Seen from this perspective, it is clear that to study just one form of manipulation could only lead to partial conclusions about the methods management use to manage earnings and their motivations for doing so (Badertscher, 2011). A number of studies have reported evidence of interaction between different manipulation techniques that is compatible with this view. For example, the results of analyses conducted by Barton (2001) suggest that management use derivatives and accruals as substitutes for manipulation, and Pincus and Rajgopal (2002) have also reported the same finding. Badertscher (2011) found that management switch between RAM and ABM when the objective is to support overvalued asset prices on the capital markets. He also suggests that overvalued companies come up against barriers to earnings management via manipulation of accruals and therefore engage in more aggressive forms of real activities management. This finding is in agreement with the position adopted by Ettredge, Scholz, Smith, and Sun (2010), who state that companies cease to employ earnings management or adopt alternative strategies when they encounter barriers to a given manipulation mechanism.
Bruns and Merchant (1990) points out that managers themselves consider that profits manipulated using real activities techniques are more "acceptable" than when managed using manipulation of accruals. However, accruals are the first choice for earnings management (Xu, 2008) because they are under the auspices of company administration and do not involve sacrificing the organization's future performance. It is therefore reasonable to assume that a combination of accruals and real activities management will be used to manipulate the results actually reported. This is because both management strategies are based on activities the use of which is subject to restrictions (Zang, 2012). It is therefore expected that when managers take the decision to employ a form of manipulation they will have considered a series of variables, including the following: the sums needed to hit the desired level of earnings, the characteristics of the company and the sector in which it does business and the costs associated with each management strategy. Management will then select the least expensive strategy, i.e. the one that is subject to the fewest restrictions. This expectation defines the first research hypothesis:
H1. Ceteris paribus, the level of manipulation using each management strategy is dependent on their relative costs.
It is important to point out that the two different strategies tend to be applied at different times. Real earnings management is conducted by taking operational decisions throughout the operational cycle, in contrast with accruals-based management which is conducted with greatest intensity in the period between the end of the financial year and publication of financial statements, in other words, when management already has a clear idea of the sums needed to hit the targets that have been set for the year's financial results (Chen, 2009).
As Zang (2012) has shown, the impact of accruals-based management is more immediate and more direct than the effect generated by manipulation of real activities. Postulated in this manner, when real activities management is insufficient to achieve the target result desired, management may make the remaining adjustment by manipulating accruals. It is therefore expected that there will be a direct relationship of substitution between the two strategies. In agreement with Zang (2012), this conjecture provides the basis for hypothesis H1:
H1a. Management adjust results using accruals after real activities management decisions have been taken; the level of accruals-based management has a negative relationship to the unexpected portion of the results of manipulation by real activities.
Additionally, it is also expected that the recently introduced obligation to publish financial statements according to the IFRS will have had an effect on the magnitude of management exerted through each manipulation strategy. This assertion is founded on the fact that forcing convergence of the Brazilian accounting regulations with the internationally-adopted IFRS improves the quality of the accounting numbers reported (Costa, 2012) and, consequently, restricts the degree of discretionary freedom allowed to managers to manipulate results via accruals. This expectation leads to the second sub-hypothesis of H1:
H1b. Adoption of IFRS caused migration of the level of manipulation from accruals-based management to real activities management.
Methodology
This section presents the procedures employed to achieve the chosen research objectives. First there is a brief description of selection and capture of the observations comprising the study sample and then the remainder of the section discusses the procedures conducted to test the hypotheses empirically.
Data and sample selection
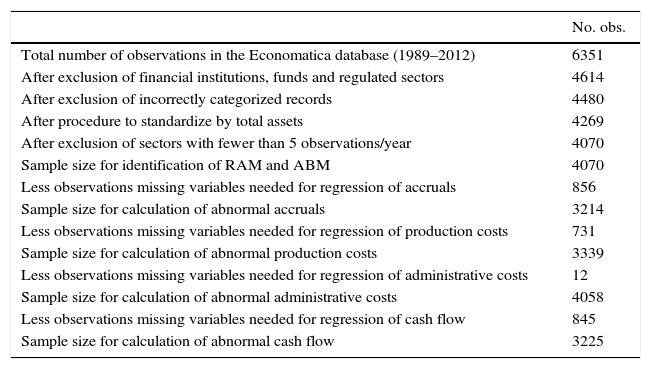
The sample comprised all companies listed on the São Paulo stock exchange (BOVESPA) for which financial and accounting data were available via the Economatica provider. Assets representing financial companies (insurance, banking and investment funds) or companies in the energy or telecommunications sectors were excluded from the analyses, as is customary in studies of this nature (Badertscher, 2011). One of the reasons for excluding these shares is the fact that these are heavily regulated sectors that have proprietary legislation and these specific standards have an idiosyncratic effect on accounting (Gunny, 2010). Yearly results were collected for the period 1989-2012. Table 1 summarizes the criteria applied to select data and the number of observations available for each of the tests to identify earnings management variables.
Models of real earnings management and accruals-based management
Identification of manipulation by real activities requires the application of models to empirical data. These models estimate the "normal" level of real activities and, as a result, the regression residuals represent the "abnormal" level, i.e. proxies for earnings management variables. In other words, the abnormal level of real activities is obtained by calculating the difference between the real observed value and the estimate obtained by applying the models (Gunny, 2010; Roychowdhury, 2006).
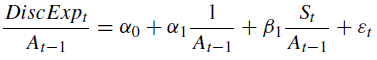
The abnormal level of discretionary expenses was calculated using a model derived from seminal work by Dechow, Kothari, and Watts (1998) and Roychowdhury (2006), with the following formula:
 (1)
(1)
where DiscExp represents discretionary expenses, A is total assets and S is sales revenues.
Eq. (1) is specified with panel data covering all shares in the sample for the entire sample period. Additionally, the Hausman test was applied to detect correlated random effects. The model basically defines discretionary expenses for the current financial year as a function of the current level of sales, and the regression residual ε t reflects the magnitude of manipulation achieved by cutting discretionary expenses (RAM DDt ).
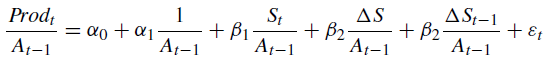
The second proxy employed to capture manipulation by real activities is abnormal level of production (RAM PRODt ), presented by Dechow et al. (1998) and applied by Roychowdhury (2006):
 (2)
(2)
where Prod represents production costs and Δ is the first difference operator.
Martinez and Cardoso (2009) state that this formula's functionality enables its application to any type of industry, whether manufacturing or otherwise. In turn, Roychowdhury (2006) explains that inclusion of the intercept standardized by total assets allows the independent variable to be different from zero even when there are no sales for the period t or t - 1. Gunny (2010) explains that analysis according to production costs (rather than by cost of products sold (CPS) or changes in inventory) is an important decision that avoids the confounding influence of accruals-based management. For example, a manager's decision to delay writing off a stock of obsolete products in order to reduce the cost of products sold could manifest as an abnormally low CPS. As a result, if CPS were used as the variable of analysis, the effects of ABM could be erroneously classified as the effects of RAM. In contrast, by using production costs - i.e. CPS plus (minus) difference in inventory - the effect of accruals would not be confused with that of real activities because the reduction in CPS would be compensated by an increase in difference in inventory.
Abnormal cash flow levels were used to detect manipulation of sales, specified as presented in studies such as Ge (2010):
 (3)
(3)
where CFO is cash flow of operations.
As was the case with formulae (1) and (2), regressions were conducted in a panel data specification, using the Hausman test to detect correlated random effects. The equation specified in (3) defines expected operational cash flow as a linear function of sales revenues and of change in sales revenues.
Manipulation of real activities in order to increase earnings can potentially cause one of, or a combination of, the following effects (Cohen, Dey, & Lys, 2008): abnormally low operational cash flow; abnormally low discretionary costs; and/or abnormally high production costs. For the purposes of illustration, variables representing abnormal operational cash flow and abnormal discretionary costs were multiplied by - 1. As a result, high values for the proxies for abnormal cash flow (RAM CFO ) and abnormal discretionary costs (RAM DE ) indicate greater degrees of real activities management (Cohen & Zarowin, 2010; Cohen et al., 2008; Laksmana & Yang, 2014; Roychowdhury, 2006; Zang, 2012). Abnormal production costs were not multiplied by - 1 because high values of RAM PROD already indicated high degrees of manipulation by RAM.
Measures of earnings management were combined into other metrics in order to identify the effect of manipulation. The first of these metrics is the variable RAM, which captures the total impact of manipulation through real activities. It comprises the sum of abnormal cash flow (RAM CFO ), abnormal discretionary expenses (RAM DE ) and abnormal production costs (RAM PROD ). Since all of these measures are standardized by total assets for the preceding financial period, they can be summed and the result compared across companies of different sizes. Thus, high values for the RAM variable suggest intense utilization of real activities to manipulate the results for the financial period.
The second metric is total earnings management (TOTM), which was created to synthesize the effect of earnings management using both manipulation strategies. As defined, the variable comprises manipulation by accruals-based management (ABM) and by real activities management (RAM). As Cohen et al. (2008) explain, different measures of manipulation have distinct impacts on the results reported and so concentration into a single metric could dilute and mask individual effects. Therefore, where applicable, the results of the tests conducted will be presented with the variables that capture the individual effects of manipulation through real activities (RAM CFO , RAM DE and RAM PROD ) and also with the combined metrics (RAM and TOTM).
In order to verify the validity of the hypotheses, it is first necessary to calculate the value of accruals. The specification for accruals management, using a balance-sheet approach, was presented by Dechow, Sloan, Hutton, and Kim (2012), as follows:
 (4)
(4)
where CA is current assets; Cx is cash and cash equivalents; CL is current liabilities; Debt is short-term debt; Tax is taxes due and Dep is cost of depreciation. All of these variables are deflated by the preceding period's total assets.
The specification of total accruals shown in Eq. (4) is well-established in the academic literature on earnings management (Healy, 1985). Estimation of total accruals is just one step in the procedures to examine the behavior of accruals-based earnings management, since earnings management research focuses on studying the discretionary actions of managers that have repercussions for the results reported in financial statements (Dechow et al., 2012). The Jones model has been chosen, preserving comparability with previous studies, such as DeFond and Jiambalvo (1994), Subramanyam (1996) and Cohen and Zarowin (2010). It is specified as follows:
 (5)
(5)
where PPE represents property, plant and equipment. Discretionary accruals are given by the residual of the equation.
Even if there is much controversy in connection to accruals models so far, those models are still extensively used and still are able to attract most of the attention of the scholars. The cash flow approach was not used given the circumstances that cash flow statement became mandatory in Brazil only in 2008. Having defined the method for identification of accruals, it is now possible to move on to the analysis of trade-off between earnings management strategies.
Relationship between RAM and ABM
The first hypothesis states that use of each strategy for manipulation of results is dependent on their relative costs. Additionally, the two sub-hypotheses establish a relationship between accruals and real activities in manipulation of year-end results and state that adoption of IFRS provoked management to migrate from accruals-based management to manipulation by real activities.
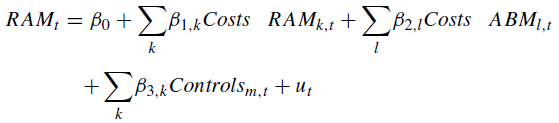
In this regard, it is important to emphasize that both RAM and ABM are activities that have costs/restrictions attached to them that function as limiting factors to their use as manipulation strategies. In view of this, management will tend to prefer to employ the type of manipulation that is subject to the fewest restrictions, meaning that, for example, if the costs linked with ABM (RAM) are high, then companies will employ RAM (ABM) with greater intensity to manipulate their year-end results. This trade-off between RAM and ABM is modeled as proposed by Zang (2012).
Given management's supposed preference for the strategy with the lowest costs attached, it is expected that β 2 in Eq. (6) and γ 2 in Eq. (7) will both be positive. It also follows from this interpretation that β 1 in Eq. (6) and γ 1 in Eq. (7) will both be negative. Since real activities decisions are taken during the financial year, and since management can still manipulate the results using accruals after the end of the financial year, Eqs. (6) and (7) constitute a recursive/interactive system in order to capture this sequence of decisions (Zang, 2012). The system incorporates the fact that the relationship between the two strategies is unidirectional, with the greater part of manipulation by accruals taking place after management by real activities. Therefore, the level of RAM is determined by the costs of both strategies, but is unaffected by the results of ABM. In turn, ABM is also determined by the costs of both strategies, but it incorporates both the results of RAM and the unexpected portion of RAM. Since the expectation is that there will be a trade-off by which excess RAM provokes a reduction in ABM - it is expected that the coefficient of γ 3 in Eq. (7) will be negative. The coefficients β 3 and γ 4 reflect the control variables common to both types of management.
 (6)
(6)
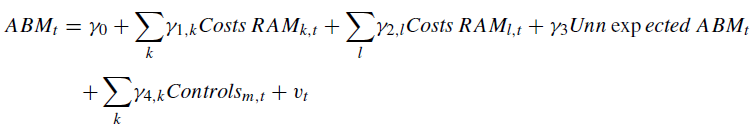 (7)
(7)
The following subsections present the costs variables and the control variables used in the study.
Costs associated with RAM
Four costs related to manipulation by real activities were included in the analysis. The first of these was the level of competition in the company's business sector. The assumption is that firms that are in highly competitive sectors and have small market shares are less likely to utilize real activities management because the costs involved would be high. In common with a study published by Badertscher (2011), the proxy employed to capture the level of competition was the Herfindahl index. This calculated by finding the share of sales of each company as a proportion of the total sales in its business sector, squaring this share and then summing the results for all firms in that sector. The Herfindahl index varies from 0 (perfect competition) to 1 (pure monopoly). As mentioned earlier, firms were allocated to business sectors according to their classifications in the Economatica database.
Firms face different levels of competition within a sector and so the results of diverting from the optimum strategy in operational terms also differ. Companies that are market leaders see RAM as the lower-cost strategy, since such manipulation does not significantly affect their competitive advantage. The ratio between firm turnover and total turnover of its business sector was used as a proxy to identify market share (MktShare) and was the second variable used to model RAM costs.
The third proxy employed for the cost of RAM was firm financial health. Zang (2012) supports the view that firms that are in precarious financial situations reduce manipulation by real activities because the strategy restricts available cash flow even further. In such cases, the relative cost of RAM is elevated. Firm financial health was represented by the ratio of cash flow over total debt. Beaver (1966 apud Joosten, 2012) argues that this ratio offers the best accuracy for representing a company's financial situation when compared with other available indicators.
The last variable representative of the costs of RAM was excess production. As has already been pointed out, firms can manipulate their results using RAM by dividing their fixed costs between larger numbers of units produced. However, the capacity to over produce requires an adequate level of fixed assets (operational) to support the increase in production. The proxy employed to capture this effect is the ratio between property, plant and equipment and sales. This variable measures the level of fixed assets needed to generate $1 in sales revenues. The higher the ratio, the larger the fixed costs component of the product.
Costs associated with ABM
Management's discretionary freedom to manipulate using accruals is restricted in several ways, primarily by imposition of accounting principles. In this study three variables were used to represent the costs of ABM: accounting flexibility, compliance with IFRS and operational cycle.
Barton and Simko (2002) claim that a firm's ability to employ ABM is limited by the sums disclosed as accruals during preceding financial periods. The claim is based on the fact that it is expected that sums declared as accruals in a given period will be reversed in subsequent financial periods. Net operating assets is the variable employed to capture accruals declared previously. Zang (2012) explains that because of the interrelationship between the statement of operating results and the balance sheet, discretionary accruals have an impact on current assets which, in turn, will be inflated if the firm has engaged in ABM in preceding periods. In line with Zang (2012)'s method, net operating assets are calculated as shareholders' equity less cash and cash equivalents plus total debt. The proxy employed to represent accounting flexibility - Flex - is a binary variable that takes the value 1 if net operating assets are above the median for the firm's business sector and 0 if they are not.
The second variable employed to capture the costs of ABM was compliance with the International Financial Reporting Standards (IFRS). In Brazil, compliance was made obligatory from the financial year ending in 2010 onwards. Accounting numbers reported according to the IFRS are of higher quality (Costa, 2012) and should restrict management's discretionary freedom to manipulate using accruals. The proxy employed to capture the effect of IFRS therefore takes the value 1 for observations from years after 2009 and 0 for all other years.
The last variable employed to capture the costs of ABM was length of the operational cycle. Reversal of accruals can be deferred for longer if a firm has a long operational cycle. In line with previous studies (Zang, 2012), the operational cycle was calculated as the mean receivables settlement time plus the mean inventory time less the mean liabilities payable settlement time.
Control variables
The control variables are included to control for the effect of certain situations or scenarios that could affect the extent of accruals or the level of real activities, without being directly related to the costs of RAM or of ABM. These variables are represented by the coefficients β 3 in Eq. (6) and γ 4 in Eq. (7) and are intended to capture the systematic effects attributed to profitability of the security, to firm size, to opportunities for growth and to variations in the national economic climate.
The proxy employed to capture the effect of firm performance was return on assets (ROA). The effect of firm size (Size) was controlled using the natural logarithm of total assets. The coefficient market to book value (MtB) was used to capture firms' growth rates, while variation in Gross Domestic Product (ΔGDP) was chosen to capture the background level of economic activity.
All of these variables have been used in previous studies, with studies by Cohen et al. (2008), Zang (2012), and Joosten (2012) of particular note. A variable was also included to control for the difference between stated profit and target profit, represented by profit before management (ExAnteProf), calculated as operating profit after correction for the effects of RAM and ABM.
Analysis of results
Table 2 lists the descriptive statistics (Panel A) and correlations (Panel B) between the variables employed in the principal tests for trade-off between earnings management strategies. The analyses were only run on data from suspect firms.
Table 2 Descriptive statistics for suspect firms.a
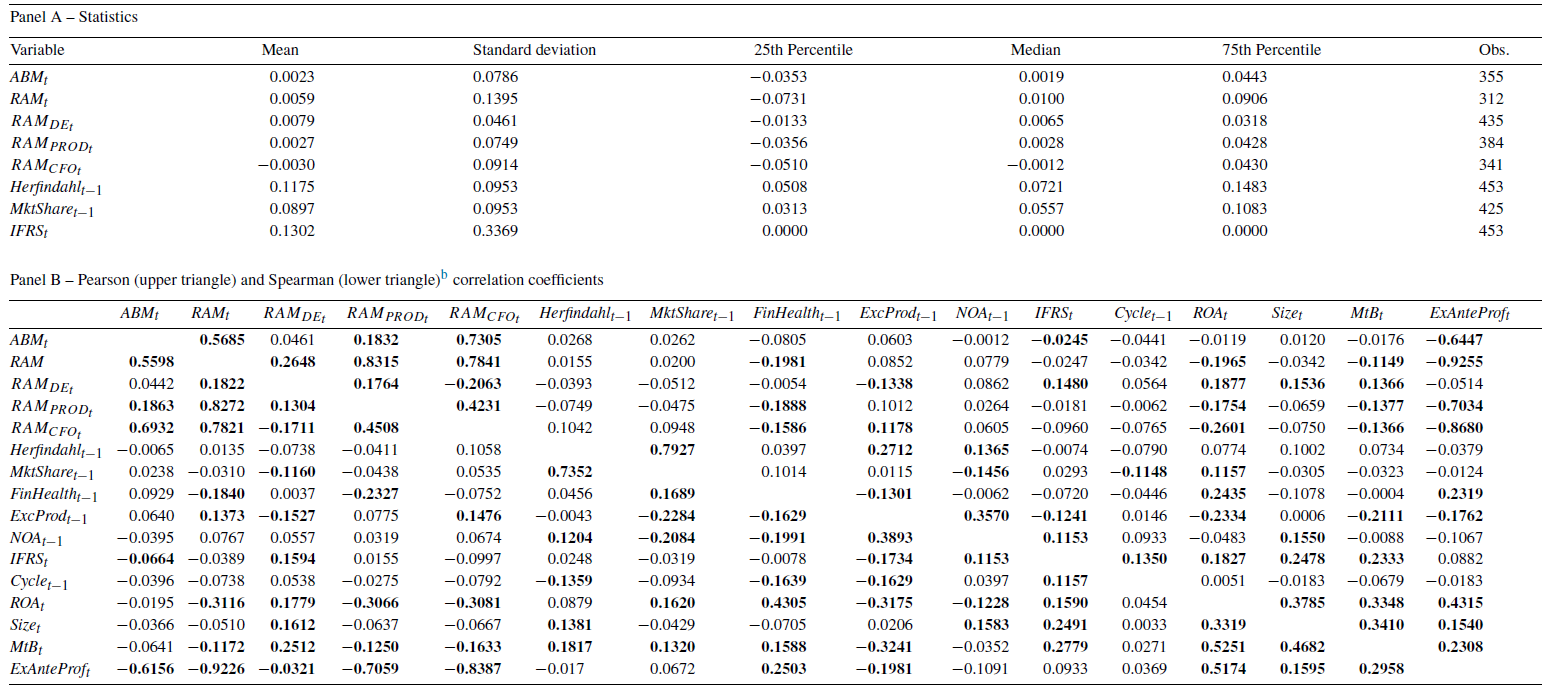
a Panel A lists the descriptive statistics used to measure earnings management (ABM t , RAM t , RAM DEt , , RAM PRODt and RAM CFOt ), the costs of accruals-based management (NOA IFRS t and Cycle t-1 ), the costs of real activities management (Herfindahl t-1 , MktShare t-1 ) and the control variables (ROA t , Size t and MtB t ).
b Coefficients in bold are statistically significant to 1%.
The Herfindahl index (represented by the variable Herfindahl t-1 ) was 0.1175 - for suspect firms, indicating that they do business in markets in which there is significant competition; in other words, the degree of concentration is not sufficient to suggest a monopoly. These firms have an 8.97% mean share of the market in their respective business sectors, as indicated by the variable MktShare t-1 .
On average, the suspect firms exhibited the capacity to manage their financial liabilities. The result for the variable FinHealth t-1 was 1.1799, suggesting that the cash flow generated by operations is sufficient to service total debt. This finding is comparable with the result reported by Zang (2012), who also found that suspect firms were in good financial shape. A high degree of investment in fixed assets was required to generate sales, represented by the variable ExcProd t-1 , with more than R$1.00 being invested in fixed assets in order to generate R$1.00 in sales revenue. The mean value of NOA t-1 was 0.4415, suggesting that approximately 44% of the suspect firms had net operating assets over the median for their respective industrial sectors. Data on the suspect firms for years after adoption of IFRS account for approximately 13% of the entire sample of firm-year observations. The mean operational cycle of suspect firms was approximately 168 days and their return on assets was approximately -7%. The suspect firms' size was slightly smaller than mean size of the remainder of the sample (figures not shown in table) and the price to book value coefficient was 1.7279, indicating that they are well-regarded by the market. Profit before management was the equivalent of approximately 7% of total assets.
Panel B of Table 2 shows Pearson and Spearman correlations between the variables used for the principal tests for trade-off of RAM against ABM. Significant coefficients are indicated in bold. There was a significant, high and linear correlation between manipulation by accruals (ABM) and manipulation by real activities (RAM), indicating that both strategies are employed in conjunction to manage the results declared. This evidence is in line with the results of Zang (2012)'s study of North-American firms, although the degree of association identified in the Brazilian market is very much higher. Of the individual strategies for manipulation by real activities, only RAM DEt did not have a significant coefficient for the correlation with ABM t .
There was a high correlation between manipulation by real activities strategies and the aggregated metric for RAM, but this is mechanical, since the latter is calculated by summing RAM DEt , RAM PRODt , and RAM CFOt . The association between financial health and RAM was negative and significant, which is compatible with the idea that management by manipulation of operational activities destroys cash flow for the period. The correlations between RAM and the control variables ROA and MtB were both negative and significant. This finding is in agreement with previous studies, in particular with work by Zang (2012), and Joosten (2012). The association between RAM (or ABM) and profit before management (ExAnteProf) is negative and significant, indicating that the large the value of ExAnteProf, the lower the incentive to manipulate the results declared.
There was a negative and significant linear association between the variables ExcProd t-1 and RAM DEt , which represent costs of earnings management. Additionally, RAM DEt had a significant, but positive, correlation with IFRS t and also with the control variables ROA t , Size t and MtB t . This evidence suggests a possible migration from accruals-based management to real activities manipulation and this supposition is reinforced by the negative and significant correlation between the variable IFRS t and ABM t . Another significant relationship was the negative correlation between RAM PRODt and FinHealth t-1 . One possible explanation is the cash flow needed to increase production. There was also a negative and significant association between RAM CFOt and FinHealth t-1 , which could be explained by the fact that weak financial health is a barrier to concession of discounts and favorable credit terms. In turn, RAM CFOt and ExcProd t-1 exhibited a positive and significant linear association, potentially indicating that increasing sales would require a higher level of investment in fixed assets to be able to meet demand and, since the margin on the product is lower because of offering discounts to increase demand, ExcProd t-1 tends to be greater.
Table 3 illustrates the results of the tests for trade-off between the two earnings management strategies - RAM and ABM. In common with the results shown in Table 2, only suspect firms were included in the estimations. The results are shown in four panels, where the first three (Panels A, B and C) list results for the individual types of manipulation by real activities and the last (Panel D) shows results for the aggregated metric RAM t .
Table 3 Tradeoff of manipulation by accruals against manipulation by real activities.a

* Statistical significance to 10% respectively.
** Statistical significance to 5% respectively.
*** Statistical significance to 1% respectively.
Panel A contains results for the analysis of manipulation by discretionary expenses (RAM DEt ). The negative and significant coefficients for associated costs represented by the variables Herfindahl t-1 and MktShare t-1 indicate that firms that are in highly competitive industrial sectors and have small market shares manipulate by reduction of discretionary expenses. In turn, in the ABM t equation all of the coefficients representative of costs associated with manipulation by accruals were significant, with the exception of Cycle t-1 . The negative coefficient for Flex t-1 shows that accruals-based management is restricted in situations in which firms have little accounting flexibility, i.e. when their financial statements at t - 1 were already "inflated" by accruals. The negative correlation between IFRS t and ABM t suggests that the extent of accruals-based management reduced after adoption of IFRS, probably because of the improved quality of the numbers declared as a result of the process of convergence of Brazilian financial statements with international accounting standards.
Panel B lists the estimates for manipulation through production costs. The positive and significant coefficient for Herfindahl t-1 indicates that firms in industrial sectors with little competition manipulate by increasing production. The negative and significant relationships with MktShare t-1 and ExcProd t-1 show that firms with small market shares do employ RAM PRODt to manipulate year-end results, but are reluctant to increase production if to do so demands increased investment in fixed assets. The equation for accruals-based management did not return significant coefficients for the correlation between ABM-related costs and manipulation by increased production.
Panel C shows that coefficients were significant and positive for Herfindahl t-1 and ExcProd t-1 in the RAM CFOt equation. This evidence suggests that sectors with greater market concentration, i.e. less competitive markets, are more likely to have firms that manage earnings by increasing sales. Since an increase in sales potentially requires a higher level of investment in fixed assets and the profit margin is narrowed by concession of discounts, the positive relationship between ExcProd t-1 and RAM CFOt appears reasonable. The equation for accruals-based management shows that firms with little accounting flexibility - i.e. those whose results are already inflated by prior use of ABM - have little incentive to manipulate using RAM CFOt .
Panel D contains the results for the aggregated measure, RAM t , which is the most interesting metric for observing the relationship between the two strategies for manipulation of results. The negative and significant coefficient for the variable Herfindahl t-1 in the ABM t equation indicates that firms that are in more competitive sectors consider that the accruals strategy is more costly. The significant associations for the variable MktShare t-1 and their inverted signs in the RAM t and ABM t equations suggest that firms with small market shares prefer to manipulate results using real activities rather than by accruals. The variable IFRS t has a positive (negative) and significant coefficient in the RAM t (ABM t ) equation, suggesting that manipulation by real activities (accruals) increased (reduced) after adoption of IFRS.
The primary hypothesis H1 stated that management of results is conditioned by the relative costs of each manipulation strategy. Taken in conjunction, the findings appear to support this supposition. Among these findings were the preference for accruals-based management when firms are in sectors with fierce competition or when their financial health is weak. It was also observed that there was a trend to use management by accruals to a lesser extent when accounting flexibility is low and that manipulation by ABM reduced after adoption of IFRS. These findings are compatible with the predictions made with relation to the costs of earnings management. Notwithstanding, the variable MktShare t-1 has the opposite sign to what the theoretical framework predicts and Cycle t-1 did not exhibit statistical significance. This could be due to idiosyncrasies (Zang, 2012) of the Brazilian capital markets or errors in measurement of the variable.
The first sub-hypothesis H1a stated that management adjust results via accruals after real activities manipulation has taken place and also that the extent of accruals-based management is negatively linked to the unexpected portion of manipulation by real activities. Zang (2012) claims that this relationship of substitution can be observed when management use more (less) ABM because the result of manipulation by real activities is unexpectedly low (high), which creates a negative relationship between accruals-based management and the unexpected portion of RAM. This association is confirmed by the negative coefficient for the variable unexpectedRAM, which was significant to 1%.
The confirmation that management strategies are chosen on the basis of their respective costs (hypothesis H1) and that there is a relationship of substitution between RAM and ABM (first part of sub-hypothesis H1a), suggests that management manipulate the results using real activities during the financial year and then, after the year-end, they adjust the level of accruals that will be declared on the basis of the actual results of RAM. In conjunction, the findings confirm hypothesis H1a. These results are in line with what has been observed in studies of the North-American market, but they diverge from conclusions drawn by Martinez and Cardoso (2009) with relation to the Brazilian market.
Sub-hypothesis H1b stated that IFRS would have provoked migration of the level for manipulation from accruals-based management to manipulation by real activities. The results shown in Panel D of Table 3 are consistent with this theory, indicating that (1) the general level of real activities management increased after adoption of IFRS, since the coefficient for IFRS t is positive and significant in the RAM t equation; (2) the level of manipulation by accruals reduced after adoption of IFRS, since the coefficient for IFRS t is negative and significant in the AMB t equation. Taken in conjunction, these findings suggest that a process of substitution of management strategies took place after adoption of IFRS, specifically in the direction of replacing manipulation by accruals with real activities management. This result agrees with the findings of Cohen et al. (2008) and corroborates the supposition embodied in hypothesis H1b.
Coefficients were estimated by regression for observations in the sample for the period 1989-2012, using panel data:
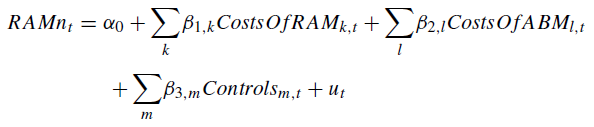 (8)
(8)
 (9)
(9)
where the dependent variable RAMn t corresponds to one of the measure of real activities earnings management (RAM t , RAM DEt , RAM PRODt or RAM CFOt ), while the dependent variable ABM t represents accruals-based management. UnexpectedRAMn t and Predicted RAM represent the residuals and predicted values (fitted values) from Eq. (6) respectively. The table shows the tradeoff between manipulation by accruals and manipulation by discretionary expenses (Panel A), production (Panel B), cash flow (Panel C) and aggregated real activities (Panel D).
Conclusions
The basic hypothesis underlying this study was that the extent of manipulation using each management strategy is dependent on their relative costs. Analysis of this premise involved identification of restrictions to accruals-based management and real activities manipulation. Drawing on previous work by authors such as Zang (2012), Cohen et al. (2008), and Joosten (2012) the principal costs associated with manipulation by accruals and by real activities were included in the hypothesis tests. The following were the most relevant costs linked to real activities: level of competition in firm's business sector, firm market share, firm financial health and level of investment in fixed assets. Accruals management is limited by accounting flexibility, length of operational cycle and adoption of the IFRS international accounting standards for reporting results. All of these restrictions were analyzed using a system of equations to model the expected sequence of management strategies. The system was estimated for each type of manipulation by real activities -RAM DE , RAM PROD and RAM CFO - and also for an aggregated measure that incorporates all three types (RAM). The results support the hypothesis that application of the management strategies is dependent on their respective costs.
Two additional hypotheses related to H1 were also tested. The first (H1a), states that management adjusts results using accruals after real activities management has been utilized and that the level of accruals-based management has a negative relationship with the unexpected portion of the results of manipulation by real activities. Initially, RAM was estimated according to its determinant costs. The sum effectively achieved by manipulation by real activities, and its unexpected portion (given by the regression residual) were then included in the equation for the determinant costs of accruals. The significant coefficients for RAM achieved and for unexpected RAM in the equation for the determinant costs of ABM made it possible to demonstrate that the sequence of manipulation events is RAM before ABM. The negative coefficient for unexpected RAM in the equation for the determinant costs of ABM shows that the level of discretionary accruals is higher (lower) the lower (higher) the unexpected portion of RAM. This evidence therefore upholds H1a.
The second sub-hypotheses to H1 (H1b) postulates that adoption of IFRS triggered migration of the level of manipulation from accruals-based management to real activities management. As such, adoption of IFRS was included in the equations of the determinant costs of ABM as a restriction. Although these results are still incipient (since the IFRS were effectively implemented in 2010), these results support hypothesis H1b. More specifically, it was found that the overall level of real activities management increased after adoption of IFRS and the coefficient of the variable IFRS t is both positive and significant in the equation for the determinant costs of RAM t . In turn, the level of manipulation by accruals fell after adoption of IFRS (shown by the negative and significant coefficient).
The study described in this paper did not address an exhaustive list of all potential techniques for RAM, leaving out possibilities such as delaying or canceling new investment projects and hedging in derivatives. Potential avenues for fruitful future research involve controlling institutional differences, the legal regime adopted, corporate governance, the role of auditing, the influence of sophisticated investors and the relevance of accounting information. Future studies could advance the field by considering other forms of manipulation by real activities and additional determinant costs, thereby further increasing knowledge of the effects of these strategies for results management as used by firms on the Brazilian capital market.

