


Servicios Personalizados
Revista
Articulo
 texto en
  Inglés (pdf)
 Artículo en XML
 Referencias del artículo
 Enviar artículo por email
Indicadores
-
 Citado por SciELO
 -
 Accesos
Links relacionados
-
 Similares en
SciELO
Similares en
SciELO
Compartir

 Permalink
Contaduría y administración
versión impresa ISSN 0186-1042
Contad. Adm vol.62 no.4 Ciudad de México oct./dic. 2017
https://doi.org/10.1016/j.cya.2015.12.004
Articles
Long-term effects of the asymmetry and persistence of the prediction of volatility: Evidence for the equity markets of Latin America
1Universidad Autónoma del Estado de México, México
2Universidad Nacional Autónoma de México, México
This article proposes an extension to the CGARCH model in order to capture the characteristics of short-run and long-run asymmetry and persistence, and examine their effects in modeling and forecasting the conditional volatility of the stock markets from the region of Latin America during the period from 2 January 1992 to 31 December 2014. In the sample analysis, the estimation results of the CGARCH-class model family reveal the presence of short-run and long-run significant asymmetric effects and long-run persistency in the structure of stock price return volatility. The empirical results also show that the use of symmetric and asymmetric loss functions and the statistical test of Hansen (2005) are sound alternatives for evaluating the predictive ability of the asymmetric CGARCH models. In addition, the inclusion of long-run asymmetry and long-run persistency in the variance equation improves significantly the out of sample volatility forecasts for emerging stock markets of Argentina and Mexico.
Keywords: Asymmetric volatility; Emerging stock markets; Symmetric and asymmetric loss functions; Superior predictive ability test
JEL classification: C22; C32; C51; C52
Este trabajo propone una extensión al modelo CGARCH a fin de recoger las características de asimetría y persistencia de largo plazo, e investiga sus efectos en el modelado y predicción de la volatilidad condicional de los mercados accionarios de la región de América Latina en el periodo del 2 de enero de 1992 al 31 de diciembre de 2014. En el análisis dentro de la muestra, los resultados estimados de la familia de modelos CGARCH indican la presencia de efectos asimétricos significativos y persistencia de corto y largo plazos en la estructura de la volatilidad de los rendimientos accionarios. Los resultados empíricos también muestran que el uso de medidas simétricas y asimétricas y la prueba estadística de Hansen (2005) son excelentes alternativas para evaluar el poder predictivo de los modelos CGARCH asimétricos. La incorporación de la asimetría y persistencia de largo plazo en la ecuación de la varianza mejora significativamente las predicciones de la volatilidad fuera de la muestra para los mercados accionarios emergentes de Argentina y México.
Palabras clave: Volatilidad asimétrica; Mercados accionarios emergentes; Medidas de errores; simétricas y asimétricas; Prueba de poder predictivo superior
Clasificación JEL: C22; C32; C51; C52
Introduction
The new millennium has witnessed the transformation and fast growth of the equity markets in the emerging economies. In the context of globalization and financial integration, the equity markets of Latin America have experienced astounding growth rates that surpass those of advanced economies. This is largely due to the reforms implemented by authorities in the region during the late eighties and early nineties that contributed to the liberalization of the capital markets, which favored the procurement of important foreign investment flows toward these emerging markets and led to fundamental changes in their financial structures (Bekaert & Harvey, 2003). Moreover, the biggest presence of institutional investors for the administration of retirement savings systems is by far another one of the essential factors that explains the recent evolution of the equity markets in the Latin American region.
However, the recent international uncertainty generated by the global financial crisis of the United States and the European sovereign debt crisis, have interrupted the dynamic financial development in the equity markets with strong adjustments to the low in the stock-exchange listings. The global nature of the recent financial crises has been characterized by the lack of liquidity, increase in the risk and high volatility, which has negatively affected the yields of the participants of emerging equity markets with fragile economies and different structural characteristics in their financial systems compared to the more liquid and efficient structure of advanced countries.
During periods of financial turbulence, the behavior of volatility tends to be more persistent before reaching its lowest level. This typical phenomenon of emerging equity markets is generally attributed to important macroeconomic factors such as erratic fluctuations of the exchange rates, financial crises and unbalances in the economic and political systems (Abrugi, 2008; Caner & Onder, 2005; Ikoku, Chukwunonso, & Okany, 2014). Thus, in long periods of instability, the presence of new information has been considered by experts and academics to be the main source of volatility and vulnerability in the international financial markets in the last decades (Engle, Ghysels, & Sohn, 2013; Vitor, 2015). Consequentially, the task of understanding the natural behavior of volatility and its intensity in emerging equity markets has become a challenge and a priority among academics, financial institutions, individual and institutional investors, because when volatility is defined as the main indicator of uncertainty, it transforms into a key component in the decision-making process.
The modeling and proper prediction of volatility is an important factor in the selection and administration of conventional portfolios, for the simple fact that the institutional investors and financial intermediates use it as a parameter in the determination of the level of risk that they are willing to accept at the time of the investment. While the management of risks and optimal determination of capital reserves help estimate and resolve the losses of the market positions of the financial institutions in the face of unexpected changes in the risk factors. Also, the correct estimation of the structure of volatility is fundamental in the implementation of valuation models for the premiums of financial options, because the operators require the knowledge it provides to monitor the dynamic of the underlying assets from the start of the contract until its expiration. Finally, the reasonable prediction of volatility could be of use as a thermometer of the degree of vulnerability and fragility of the financial systems, and therefore, of the efficient assignation of the capitals in equity markets that are highly volatile.
Since the publication of the seminal work of Engle (1982), the auto-regressive model of conditional heteroscedasticity and its generalized extension by Bollerslev (1986) in the GARCH model have been acknowledged in modern financial literature in order to explain the characteristics of volatility in the financial series of high frequency commonly known as volatility clustering,5 persistence and the unquestionable excess of kurtosis. Even though there are several studies that favor the performance of the GARCH models for the prediction of volatility (Andersen and Bollerslev, 1998; Brailsford and Faff, 1996; McMillan & Speigth, 2004; McMillan, Speight, & Apgwilym, 2000), the empirical results are still not convincing regarding the predictive power outside the sample. For the equity markets of Tokyo and Singapore, Tse (1991) and Tse and Tung (1992) provide solid empiric evidence against the performance of the GARCH models in the volatility prediction outside the sample. Likewise, Figlewski (1997) states that the models of mobile means report better predictions of volatility outside the sample. Recent studies based on bicorrelation statistics (Hinch-Portmanteau) show the inefficiency of the GARCH models to describe the statistic structure of the equity markets of Latin America and Asia (Bonilla & Sepúlveda, 2011; Lim, Melvin, Hinich, & Liew, 2005).
Another weakness of the GARCH model, which affects the estimation and prediction of conditional volatility, refers to the asymmetry of the positive and negative shocks of the same magnitude or leverage effect. Black (1976) was one of the first to discuss the problem of asymmetry in volatility, by demonstrating that bad news intensify the levels of volatility and good news reduce them. Since then several asymmetric volatility models have been developed to collect the asymmetric impact of the recent information on the market, among these models are: the GARCH exponential model (EGARCH) by Nelson (1991) and the GARCH-GJR model developed by Glosten, Jaganathan, and Runkle (1993).
The study of asymmetric volatility in the equity markets of emerging economies is still limited in literature when compared with industrialized countries, particularly in the Latin American region. López (2004) evaluates the predictive performance of a family of ARCH models, and found evidence that the EGARCH model provides the best adjustment to explain the dynamic of the future volatility of the yields of the Index of Prices and Listings of the Mexican Stock Exchange under different measures of predictive errors, even though their results do not have a strong statistical support. Alberg, Shalit, and Yosef (2008) assume different distributions in the innovations of the yields, and demonstrate that the asymmetric GARCH models present the best prediction performance to collect the characteristics of the asymmetric volatility and persistence in the equity market of Israel. To the equity markets of Sudan and Turkey, Ahmed and Suliman (2011) and Gökbulut and Pekkaya (2014), they confirm a high degree of persistence in the process of variance and the presence of leverage effects in the equity yields. In the phases of relative tranquility regarding the equity market of Malaysia, Lim and Sek (2013) confirmed the predictive power of the GARCH model; however, in periods of crisis, it is surpassed by the asymmetric specifications.
For the most part, the empirical evidence indicates that the GARCH asymmetrical models are open, in theory, to the natural interpretation of the behavior of the magnitude of the asymmetric effects and the persistence of shocks in the temporary volatility. Nevertheless, recent investigations have broadly documented that the emerging equity markets are more exposed to the experimentation of extraordinary events such as exchange rate devaluations (Chue & Cook, 2008; Walid, Chaker, Masoud, & Fry, 2011); financial crises (Llaudes, Salman, & Chivakul, 2010); stock market crashes and speculation (Brugger, 2010; Kwhaja and Mian, 2005); and political and social changes (Chen, Bin, & Chen, 2005). In this regard, the contagion effect of stock market crises of mature markets to emerging equity markets is a key factor that triggers a higher volatility and negative effects on these markets (Tasdemir & Yalama, 2014). The duration of this type of events does not only generate negative panic information among investors in order to pressure investors to liquidate their portfolios, but also creates abrupt changes in the structure of volatility in the short and long terms, which reduces the capacity of the GARCH, EGARCH and GARCH-GJR models to collect the asymmetry and the degree of persistence in the long-term.
From a conditional auto-regressive heteroscedasticity, Engle and Lee (1999) proposed the GARCH model of two components (CGARCH) to explore the degree of persistence in the volatility structure; its main advantage is the capacity to decompose conditional volatility in two components, temporary (short-term) and permanent (long-term) in the presence of heterogeneous rational operators or heterogeneous information. The permanent component, modeled as the long-term process or tendency, represents the impact of innovations generated by the expected changes in the economic fundaments, and describes the behavior of the persistence in volatility in the long-term. Conversely, the temporary component has the function of collecting the fluctuations of random events or destabilizing shocks that the financial markets frequently experience. That is, deviations in the balance level of the volatility in the long-term. Even though Christoffersen, Jacobs, Ornthanalai, and Wang (2008) have brought forth some concluding arguments regarding the predictive power of the CGARCH specification to describe the dynamic of volatility. However, there is still concern when forecasting the conditional volatility outside the sample, because the standard specification completely omits the impact of the asymmetry of informational shocks on the temporary and permanent component of the variances.
The main objective of this work is to spread the CGARCH model to explore the importance of asymmetric information and the long-term persistence, and to investigate its effect in the modeling and prediction of conditional volatility. The study provides important contributions to the literature on the topic. First of all, the CGARCH model is broadened to collect the effects of asymmetry and persistency in the short and long terms under the EGARCH and TGARCH processes. Second, the CGARCH asymmetric models are adjusted in order to predict the volatility of the yields of the six more important emerging equity markets of the Latin American region in the period from January 2nd, 1992, to December 31st, 2014. Third, the performance outside the sample of the GARCH standard models, and asymmetric CGARCH and CGARCH models is evaluated in the period of 2010-2014 and under four measures of predictive errors through Hasen's (2005) superior predictive ability test.
The empirical results within the sample reveal that in the yields of the equity markets of the Latin American region, asymmetry and persistence effects can be observed in the volatility structure, particularly in Chile, Colombia, Peru, and Mexico. These findings support the claims that negative shocks such as financial crises and stock market crashes increase the short and long-term volatility. The strong results of the superior predictive ability test support the predictive power of the CGARCH asymmetric models to predict the volatility outside the sample in the equity markets of Argentina and Mexico.
The rest of the work is structured in the following manner: Two-component GARCH models section summarizes the methodology that includes the CGARCH models, symmetric and asymmetric, the measures of errors and the superior predictive ability test for the evaluation of the volatility models. Application to the Latin American Equity Markets section presents the description of the data and summarizes the main findings that were obtained. Conclusions section comprises the final conclusions.
Two-component GARCH models
In this section we present an alternative approach for the capture of the common characteristics of asymmetry and persistency, short and long-term, in the conditional volatility.
Standard GARCH model
The standard GARCH model (1,1) proposed by Bollerslev (1986) in literature on volatility, is a generalized alternative of Engle's ARCH model (1982). In this context, the model of the conditional measure and the conditional variance is governed by:


where μ is the conditional measure, h t expresses the conditional variance that depends on the last innovation of the square residues ε2 t−1 also known as the ARCH effect and the previous conditional variance h t-1 , ω is a deterministic term, and its function allows for the conditional variance to reach a positive level as long as the level of persistence determined by α + β is lower than 1. The term AR(1) or autoregressive of the 1st order is aggregated to the equation of the conditional measure, given that the present yields are highly correlated with the distant yields in time.
One of the deficiencies of the GARCH model is that it does not allow differentiating the patterns of decline of the persistence in short and long-term volatility, so that a model that is able to capture the high persistence in volatility is recommended.
Two-component CGARCH model
Engle and Lee (1999) propose the CGARCH model as an alternative to capture the property of high persistence in volatility of the financial yields. The approximation allows decomposing the conditional volatility in two components and properly describes the behavior of decline of the persistence in short and long-term volatility.
The specification of the CGARCH model (1,1)6 is defined as


where h t indicates the short-term volatility level that captures innovations, fed through exogenous events related to economic, geopolitical and even speculative aspects, and which fluctuate in a cyclical manner; q t represents the long-term volatility or tendency, which converges at the level of the unconditional volatility ω to the velocity of (α+β) < δ < 1. The term (ε2 t−1 − h t−1 ) works as the dynamic power for the movements of the tendency and the difference between the conditional variance and its tendency, (h t-1 - q t-1 ) is the temporary component that converges to zero at a velocity (α + β).
The CGARCH model collects the effects of short and long-term persistence, but its capacity is reduced before the presence of asymmetric effects. Due to the fact that negative shocks have a different impact on the volatility than positive shocks of the same magnitude, not only in the short-term, but in the long-term as well.
Asymmetric CTGARCH model
The flexibility of the CGARCH model allows for the capturing of asymmetric effects in the short and long-term, by only adding asymmetry parameters to its econometric structure, i.e., using the results of the TGARCH specification proposed by Glosten et al. (1993). The asymmetric structure or CTGARCH model captures the asymmetry effects in the following manner:


where the dummy variable is governed by the Heaviside indicator function I (•), which is equal to 1 if ε t-1 < 0 and zero in any other case. The asymmetry effect is observed if γ > 0 and ψ > 0, which indicates a greater impact than bad news with values (α + γ) and (ρ + ψ) on residuals ε2 t−1 in the short and long-terms and the effect of the optimistic news is measured by α and ρ.
CEGARCH asymmetric models
Another extension of the CGARCH model for the capture of asymmetric effects in the short and long-terms, is proposed in this study under Nelson's EGARCH structure (1991).
The CEGARCH model has the following form:


where the asymmetry parameters γ and ψ are negative unlike the CTGARCH model, which indicates a greater impact of the bad news in the short and long-term volatilities than the good news in the same magnitude. The total effect in the short and long-term volatilities is of (α−γ) |ε t−1 | and (ρ − ψ) |ε t−1 | if ε t-1 < 0 or (α + γ) |ε t−1| and (ρ + ψ) |ε t−1| when ε t-1 > 0
Evaluation of the predictive performance of the volatility models
In this section we describe the measures of errors for the predictive performance evaluation of the volatility models. In general, this process is carried out outside the sample because the participants in the equity markets are more interested in the capacity of reaction of the models when new information arrives to the market.
The predictive error measures are classified in symmetric and asymmetric. Among the more common symmetric measures are the mean squared error (MSE) and the mean absolute error, which are defined in the following manner:


where T indicates the number of predictions, h t is a proxy variable for the no observable volatility, which is generally obtained from the square yields, and ĥ t is the estimated volatility through the different GARCH specifications.
In an analytical study, Patton (2011) showed that these measures are strong in order to minimize the predictive error. However, none of them provide the additional information on the asymmetry in the errors; that is, when the models underestimate or overestimate the no observable volatility.
According to Brailsford and Faff (1996), the asymmetric error measures give a different weight to the underestimated and overestimated predictions of the volatility with a similar magnitude, and are defined in the following manner:


where U and O represents the underestimations and overestimations, and their sum indicates the total number of predictions T.
Recent investigations on the prediction of volatility outside the sample have empirically demonstrated the power of the error measures in the generation of information regarding the evaluation of the estimated models. However, one of the disadvantages of the measures is that, unlike the contrast hypothesis tests, it does not allow for a strong analysis in a statistical framework. This is due to the fact that it cannot be concluded that the predictive performance between the two estimated models is significantly different from a statistical point of view by only comparing their predictive errors. In order to alleviate this problem, this work uses Hansen's (2005) superior predictive ability test (SPA). This strong statistical test allows for the evaluation of the performance of two or more estimated models, unlike the Diebold-Mariano (1995) and White (2000) statistical tests.
In this context, the predictive evaluation of the models is carried out based on the measurements of errors, given that the base model (best approximation) is chosen by the measurement with smallest predictive error. The SPA statistic test consists in determining the model with the best predictive performance. In the period t, the superior predictive performance of the alternative model k in relation with the base model is defined as:

where L 0,t is the prediction error as determined in Eqs. (12), (13), (14) and (15) for the base model M 0 and L k,t is the prediction error associated with each alternative model M k .
Under the assumption that the vector d k,t is strictly stationary, the null hypothesis of interest, that none of the alternative models reach a higher predictive performance in relation to the base model, can be presented as:

Here, the use of the estimator μ k ≡ E [d k,t ] allows for the reduction of the impact of the models with a weak predictive performance, but at the same time it controls the impact of the alternative models with μ k = 0 as documented by Hansen (2005).

where 1{⋅} is an indicator function. Furthermore, an immediate result of the assumption of seasonality is that the selection of the threshold √2 log log n guarantees the consistency of the estimator μk c for a sufficiently large n, even for the alternative models with μ k = 0.
Consequently, the statistic of the null hypothesis is defined by:

where ŵ
k
2 is a consistent estimator of ω
k
2 ≡
 .
.
For the estimation of ω
k
2 ≡  and the probability of the statistic T
n
SPA
, Hansen (2005) suggests the use of the stationary bootstrap procedure based on Politis and Romano (1994) in order to obtain the empirical distribution of the contrasting statistic under the null hypothesis, defined by the following expression:
and the probability of the statistic T
n
SPA
, Hansen (2005) suggests the use of the stationary bootstrap procedure based on Politis and Romano (1994) in order to obtain the empirical distribution of the contrasting statistic under the null hypothesis, defined by the following expression:

where b = 1,...,B determines the number of bootstrap samples of the vector d
k,t
for k = 1,..., m and
 . In order to obtain reliable results that do not affect the current samples, B must be rather large.
The probability value of the SPA test is calculated in two stages. First of all, the values of the statistic T b,n SPA * are obtained for each of the bootstrap samples b = 1,...,B, which is defined as:


Finally, the values of the statistics T n SPA and T b,n SPA * are compared in order to obtain the bootstrap probability value, i.e.,

The null hypothesis is rejected when the probabilities reach small values.
Application to the Latin American Equity Markets
Description and preliminary analysis of the data
Even if the equity markets of the emerging countries are characterized by experiencing high volatility, effects of asymmetry and an elevated degree of persistence, their study has been concentrated in the temporal behavior of the characteristics common of volatility, and therefore there is the need for a study on the long-term effects of asymmetry and persistence on validity. This work investigates the long-term effect of asymmetry and persistence in the prediction of conditional volatility using the daily prices of the six most important equity markets of the Latin American region: Argentina, Brazil, Chile, Colombia, Peru and Mexico.7 The analysis covers the period from January 2nd, 1992, to December 31st, 2014, with a sample of approximately 5951 daily yields. The price series of the stock indexes were obtained from the Bloomberg database.
Table 1 shows the basic statistics of the stock yields. Apparently, all of the stock indexes show properties very similar with average positive yields, which is justified by the common tendency of the rise of the stock prices during the period of analysis, as shown in Fig. 1. Nevertheless, the standard deviation of the yields is relatively high, which implies a greater exposure to risks for the participants in these stock markets, particularly in Argentina and Brazil.

All the financial series, with the exception of Argentina, show the characteristics typical of positive asymmetry and an excess of kurtosis, which indicates that the positive shocks are more frequent than the negative and leptokurtic yield distributions, with longer and broader tails than the normal distribution, in particular the upper tail. The phenomenon of normality of the distribution is also confirmed by the Jarque-Bera statistic value. Regarding the statistics of Ljung-Box Q(10) for serial correlation, the results show that the hypothesis that there is no autocorrelation of the 10 order is rejected by the small probability values, which confirms the presence of linear dependence in the stock yields. Likewise, the statistically significant serial correlation in the squared yields, determined by Q2 (10), imply that there is non-linear dependence in the series of the yields of all the equity markets.
Furthermore, there is the strong presence of conditional heteroscedasticity or ARCH effects in all the series of the financial yields, which is supported by the significance of the statistic of the Lagrange Multiplier test with a level of 5%. This characteristic common in the financial yields is widely supported by Fig. 2, where one can appreciate strong evidence of validity in agglomerations. It can also be observed that the volatility intensity is more persistent when the prices of the stock indexes tend to decrease than when they increase.
Table 1: Descriptive statistics for each daily equity returns series.

Notes: The descriptive statistics of Latin America equity market returns are expressed as percentages for the period from 2 January 1992 to 31 December 2014. The numbers in parentheses are p-values of Jarque-Bera, ARCH effect, and Ljung-Box statistic tests of the return and squared return series.

In conclusion, the preliminary analysis of the data recommends the use of GARCH processes of two components that manage to capture the short and long-term effects of asymmetry and the phenomenon of persistence in the innovations of the stock yields.
Estimation results of the volatility models
In this paper, the CGARCH model of Engle and Lee (1999) is expanded in order to investigate if the characteristics of long-term asymmetry and persistence exercise effects in the prediction of conditional volatility of the yields of the equity markets of the Latin American region. The parameters of the volatility models are estimated within sample using the period of study from January 2nd, 1992, to December 31st, 2009, and assuming that the residuals are independent and identically distributed under a normal distribution.
The results of the parameters estimated under the four GARCH structures and their diagnostic tests on the simple and squared standardized residuals are reported in Table 2 for the indexes of Argentina, Brazil and Mexico and Table 3 for the indexes of Chile, Colombia and Peru. The estimators of μ that correspond to the specification of the conditional mean, are statistically significant at a level of 1%, except for the asymmetric CGARCH models of the equity markets of Argentina and Colombia. All the parameters ϕ of the autoregressive process of the 1st order are positive and significant at a level of 1%. This fact implies that the tendency in the changes of the stock prices is maintained in the same direction in the following period.
Table 2: Estimates of the volatility models for Brazil, Argentina and Mexico countries.
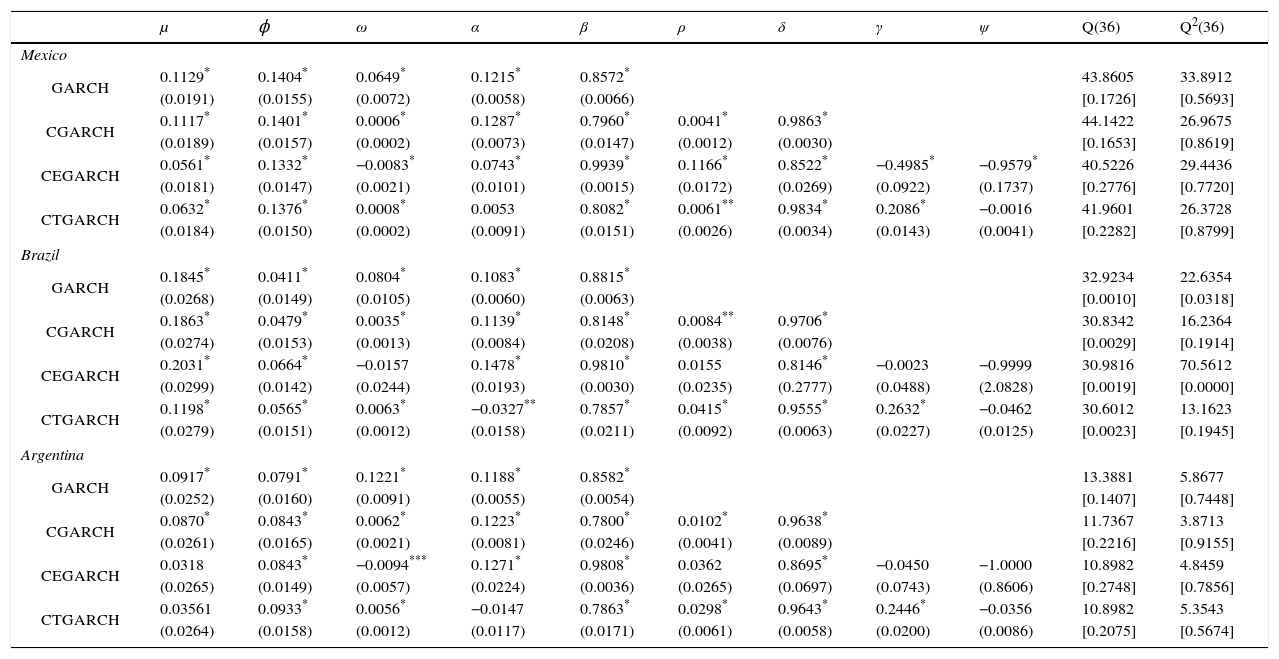
Notes: Q(36) and Q2 (36) denotes the Ljung-Box Q-statistics of order 36 computed on the standardized residuals and squared standardized residuals, respectively. p-Values are reported in square brackets. The numbers in parentheses are standard errors of the estimations. *Denotes significance at the 1% level. **Denotes significance at the 5% level. ***Denotes significance at the 10% level.
Table 3: Estimates of the volatility models for Chile, Colombia and Peru countries.

Notes: Q(36) and Q2(36) denotes the Ljung-Box Q-statistics of order 36 computed on the standardized residuals and squared standardized residuals, respectively. p-Values are reported in square brakets. The numbers in parentheses are standard errors of the estimations. *Denotes significance at the 1% level. **Denotes significance at the 5% level. ***Denotes significance at the 10% level.
Regarding the parameters of the process of conditional variance, all the models successfully capture the dynamic patterns of the short-term conditional volatility: its estimated parameters are positive and statistically significant at the conventional levels, with the exception of the CTGARCH model of the stock indices of Argentina and Mexico. The sum of the parameters α and β less than the unit indicates a considerable persistence in the volatility of the temporal component, especially in the traditional GARCH model. In fact, it can be observed that the persistence coefficients α + β reach values of 0.9655, 0.9770, 0.9772, 0.9787 and 0.9865 for Brazil, Argentina, Chile, Mexico and Peru, respectively. Although the results of the two component models based on the CGARCH and CTGARCH specifications confirm the opposite. The estimations between 0.9555 and 0.9881 of the parameters δ, for the six equity markets of the Latin American region, clearly reveal that the component of the long-term volatility is more persistent and declines at a slower rhythm than the component of the short-term volatility. This is attributed to the fact that the values of the persistence coefficient are lower than the values of δ, e.g., 0.9266 versus 0.9874 for Chile and 0.8521 versus 0.9881 for Peru for the CGARCH and CTGARCH models, respectively. In contrast, the results of the CEGARCH model, in all the stock indices, denote that the temporal component of volatility is the most persistent.
Considering the statistical significant and the sign of the parameters of asymmetry that capture the impact of the news in the short and long-terms associated with the financial crises, stock market crashes and/or economic booms. The results under the CEGARCH model are mixed, as effects of asymmetry in the short and long-term volatility can be observed for the equity markets of Mexico and Peru, and only the long-term component of volatility in the stock indices of Chile and Colombia. In the case of the CTGARCH model, the positive and significant parameter at a level of 1% indicates that there is only asymmetry in the response of temporal volatility in the presence of financial crises and stock market crashes for all the countries of the Latin American region. Consequently, the implementation of the asymmetric CGARCH models is clearly justified by empirical results.
Finally, the diagnostic of the simple and squared standardized residuals is reported at the end of Tables 2 and 3. The results of the Ljung-Box tests indicate that the null hypothesis of the absence of 36th order autocorrelation in the standardized residuals is impossible to reject at a level of significance of 5%, which implies sufficient evidence in favor of the correct specification of the conditional mean to explain the behavior of the yields of the stock indices of Argentina and Mexico. In the case of the squared standardized residuals, the insignificance of the Ljung-Box statistics confirms the good performance of the volatility models in correcting the 36th order autocorrelation in the equation of the conditional variance of the financial yields of Argentina and Mexico. These facts indicate that there is statistically significant evidence of specification error in the GARCH, and the symmetric and asymmetric CGARCH models in order to describe the heteroscedasticity exhibited in these equity markets.
Evaluation outside the sample based on the test of superior predictive ability
In this section, the evaluation outside the sample of the precision and efficiency of the GARCH, CGARCH, CEGARCH and CTGARCH models is carried out in the period from January 4th, 2010, to December 31st, 2014. The parameters of the equation of conditional variance are re-estimated using a mobile window of approximately 4957 observations, i.e., from January 2nd, 1992, to December 31st, 2009, which implies that the most remote observation is removed and the most recent observation is added to the sample. The prediction obtained is compared with the non-observable variance or proxy in order to calculate the prediction error. The process is repeated until obtaining the prediction of the conditional variance of December 31st, 2014, for the equity market. Thus, the sample size is kept fixed during the re-estimation of the volatility models and the predictions outside the sample do not overlap.
Table 4 shows the results of the measurements of prediction errors of MSE, MAE, MME(U), MMM(O) and the probabilities of the SPA statistic test, which were estimated on a base of 10 000 stationary bootstrap samples of the empirical test under the different measurements of predictive errors. In this case, the highest probabilities reached by any base model indicate that the null hypothesis that the predictive performance outside of the sample of the alternative models is widely surpassed by the base model cannot be rejected. The first column of the Table constitutes the name of the base model that will be compared with the other three alternative models.
Table 4: Results of the superior predictive ability test.

Notes: The values in bold face refer to the highest p-values of superior predictive ability test (SPA) under four criterions of the loss functions, i.e., MSE, MAE, MME(U), MME(O). The null hypothesis is that none of the alternative models have best performance than the benchmark model. The number of bootstrap replications to calculate the p-values is 10 000.
For the case of Argentina, Brazil and Mexico, the CEGARCH and CTGARCH models allow for more exact volatility predictions outside of the sample unlike the GARCH and CGARCH models under the four measurements MSE, MAE, MME(U) and MME(O). These findings are supported by the small values reached in the measurements of symmetric and asymmetric errors. Therefore, the empirical results clearly suggest that the volatility of the equity markets of Argentina, Brazil and Mexico respond in a different manner to good and bad news, which in turn implies that the negative shocks in these stock markets have a greater impact in the short-term, but limited effects in the long-term.
For their part, the probabilities of the SPA statistic test pointedly indicate that the CEGARCH model shows the best predictive performance outside of the sample than the alternative models based on the MSE, MAE and MME(O) models for the equity markets of Argentina and Mexico. In the case of the MME(U), the CTGARCH model provides the highest probability value of the SPA statistic test for all the predictions outside of the sample considered. This empirical finding is attributed to the fact that the asymmetric measurement MMM(U) penalizes the underestimated predictions of volatility, which in this case represent approximately 73.42 and 77.28% of the sample for Argentina and Mexico, respectively. Nevertheless, it is important to note that the probability of the SPA statistic test of the CEGARCH model is above the significance level of 5%, which means that it can still be considered an excellent base model in predicting future volatility in the equity market of Mexico, whereas in the case of the equity market of Argentina, model CGARCH is available as a second alternative. This finding is justified by the insignificance of the asymmetry parameter for both short and long-term.
The information generated by the measurements of asymmetric errors is relevant for the coverage strategies with contracts of options on stock indices, because there is a positive relation between volatility and the prime of the option. In this sense, the high percentage in the underestimated predictions of volatility can provide bias in the primes of the options, which would directly benefit the institutional investors who maintain long financial positions of replica portfolios on stock indices, and that in an uncertain environment have the need to protect them through put options, but at the same time harms option buyers.
On the other hand, the yields of the equity markets of the Latin American region possess similar characteristics. Nevertheless, the ability of the symmetric and asymmetric CGARCH models is not enough to provide precise estimations of future volatility in the equity markets of Brazil, Chile, Colombia and Peru. By analyzing the statistical results of Table 4, one can observe that the CTGARCH model reaches the best predictive performance in accordance with the small values of the measurements of symmetric and asymmetric errors. However, the results of the SPA statistic test contradict said empirical findings because the GARCH and CGARCH models provide the highest probabilities under the MSE, MAE and MME(O) criteria, respectively. This is attributed to the fact that none of the volatility models managed to eliminate the autocorrelation observed in the simple and squared standardized residuals in the equity market of Brazil, which leads to underestimate or overestimate future volatility.8
Conclusions
In this investigation, the CGARCH model of Engle and Lee (1999) was extended in order to investigate whether the characteristics of long-term asymmetry and persistence have effects in the prediction of conditional volatility of the yields of the equity markets of the Latin American region. In the empirical analysis within the sample, the logarithms of the daily stock yields from January 1992 to December 2009 were used, whereas in the analysis of the evaluation outside of the sample, the period between January 2010 and December 2014 was utilized. The empirical evidence shows that in the volatility of the stock yields there are vestiges of effects of long-term asymmetry in the cases of Chile, Colombia, Mexico, and Peru; this means that the negative shocks will not only have a greater impact in the component of short-term volatility, but also in their long-term tendency. Likewise, it was found that the CGARCH and CTGARCH models allow a flexible modeling of the asymptotic behavior of the yields in the equity markets of the Latin American region, with important implications for the measurement of the long-term persistence in the volatile structure. In the framework of the test of superior predictive power, the statistical results outside of the sample reveal that the CEGARCH model provides the best performance to predict volatility than the alternative models, given that it is accepted by 3 of the 4 measurements of errors, i.e., MSE, MAE and MME(O). Whereas under the criteria of the asymmetric MME(U) measurement, the CTGARCH model is the best option for the prediction of volatility in the equity markets of Argentina and Mexico. Another important empirical finding that is worth noting is that all the estimated models underestimate volatility in the considered equity markets. These results have important financial implications for the institutional investors with long and short positions, as the GARCH, and symmetric and asymmetric CGARCH models tend to be more appreciated by option sellers and less desirable by option buyers. The weak results derived from the symmetric and asymmetric CGARCH models in the case of the equity markets of Brazil, Chile, Colombia and Peru, leave an open agenda of future investigations on the estimation of more complex models such as FIGARCH and FIEGARCH specifications that allow for a complete understanding of the long-term persistence in conditional volatility.
Referencias
Abrugi, A. B. (2008). Empirical relationship between macroeconomic volatility and stock returns: Evidence from Latin American markets. International Review of Financial Analysis, 17(2), 396-410. [ Links ]
Ahmed, A. E. M. y Suliman, S. Z. (2011). Modeling stock market volatility using GARCH models evidence from Sudan. International Journal of Business and Social Science, 2(23), 117-128. [ Links ]
Alberg, D., Shalit, H. y Yosef, R. (2008). Estimating stock market volatility using asymmetric GARCH models. Applied Financial Economics, 18(15), 1201-1208. [ Links ]
Andersen, T. G. y Bollerslev, T. (1998). Answering the skeptics: Yes, standard volatility models do provide accurate forecasts. International Economic Review, 39(4), 889-905. [ Links ]
Bekaert, G. y Harvey, C. R. (2003). Emerging markets finance. Journal Empirical Finance, 10(1-2), 3-55. [ Links ]
Black, F. (1976). Studies of stock market volatility changes. Proceedings of the American Statistical Association, Business and Economic Statistics Section, 177-181. [ Links ]
Bollerslev, T. (1986). Generalised autoregressive conditional heteroskedasticity. Journal of Econometrics, 31(3), 307-327. [ Links ]
Bonilla, C. A. y Sepúlveda, J. (2011). Stock returns in emerging markets and the use of GARCH models. Applied Economics Letters, 18(14), 1321-1325. [ Links ]
Brailsford, T. J. y Faff, R. W. (1996). An evaluation of volatility forecasting techniques. Journal of Banking and Finance, 20(3), 419-438. [ Links ]
Brugger, S. I. (2010). Capital Especulativo y Crisis Bursátil en América Latina, Contagio, Crecimiento y Convergencia (1993-2005) [tesis doctoral]. Facultad de Economía, UNAM. [ Links ]
Caner, S. y Onder, Z. (2005). Sources of stock market volatility in emerging markets. Applied Economics, 37(8), 929-942. [ Links ]
Chen, D. H., Bin, F. S. y Chen, D. S. (2005). The impacts of political events on foreign institutional investors and stock returns: Emerging market evidence from Taiwan. International Journal of Business, 10(10), 165-188. [ Links ]
Christoffersen, P., Jacobs, K., Ornthanalai, C. y Wang, Y. (2008). Option valuation with long run and short-run volatility components. Journal of Financial Economics, 90(3), 272-297. [ Links ]
Chue, T. K. y Cook, D. (2008). Emerging market exchange rate exposure. Journal of Banking & Finance, 32(7), 1349-1362. [ Links ]
Diebold, F. X. y Mariano, R. S. (1995). Comparing predictive accuracy. Journal of Business & Economic Statistics, 13(3), 253-263. [ Links ]
Engle, R. F. (1982). Autoregresive conditional heteroskedasticity with estimates of the variance of the UK inflation. Econometrica, 50(4), 987-1008. [ Links ]
Engle, R. F. y Lee, G. G. J. (1999). A permanent and transitory component model of stock return volatility. En R. Engle y H. White (Eds.), Cointegration, Causality, and Forecasting: A Festschrift in Honor of Clive W. J. Granger (pp. 475-497). Oxford: Oxford University Press. [ Links ]
Engle, R. F., Ghysels, E. y Sohn, B. (2013). Stock market volatility and macroeconomic fundamentals. The Review of Economics and Statistics, 95(3), 776-797. [ Links ]
Figlewski, S. (1997). Forecasting volatility. Financial Markets Institutions and Instruments, 6(1), 1-88. [ Links ]
Glosten, L., Jaganathan, R. y Runkle, D. (1993). On the relation between the expected value and the volatility of the nominal excess returns on stocks. Journal of Finance, 48(5), 1779-1801. [ Links ]
Gökbulut, R. I. y Pekkaya, M. (2014). Estimating and forecasting volatility of financial markets using asymmetric GARCH models: An application on Turkish financial markets. International Journal of Economics and Finance, 6(4), 23-35. [ Links ]
Hansen, P. R. (2005). A test for superior predictive ability. Journal of Business and Economics Statistics, 23(4), 365-380. [ Links ]
Ikoku, A. L., Chukwunonso, T. y Okany, T. (2014). Did de economic and financial crisis affect stock market sensitivity to macroeconomic risk factors? Evidence from Nigeria and South Africa. Journal of Business, 19(3), 275-290. [ Links ]
Khwaja, A. y Mian, A. (2005). Unchecked intermediaries: Price manipulation in an emerging stock market. Journal of Financial Economics, 78(1), 303- 241. [ Links ]
Lim, K. P., Melvin, J., Hinich, V. y Liew, K. S. (2005). Statistical inadequacy of GARCH models for Asian stock markets: Evidence and implications. Journal of Emerging Market Finance, 4(3), 263-279. [ Links ]
Lim, C. M. y Sek, S. K. (2013). Comparing the performances of GARCH-type models in capturing the stock market volatility in Malaysia. Procedia Economics and Finance, 5(2), 478-487. [ Links ]
Llaudes, R., Salman, F. y Chivakul, F. (2010). The impact of the great recession on emerging markets. IMF Working Paper wp/10/237. [ Links ]
López, F. (2004). Modelado de la volatilidad y pronóstico del Índice de Precios y Cotizaciones de la Bolsa Mexicana de Valores. Revista de Contaduría y Administración, 49(2), 43-72. [ Links ]
Maheu, J. (2005). Can GARCH models capture long-range dependence? Studies in Nonlinear Dynamics & Econometrics, 9(4), 1-41. [ Links ]
McMillan, D. G., Speight, A. E. H. y Apgwilym, O. (2000). Forecasting UK stock market volatility. Applied Financial Economics, 10(4), 435-448. [ Links ]
McMillan, D. G. y Speigth, A. E. H. (2004). Daily volatility forecasts: Reassessing the performance of GARCH models. Journal of Forecasting, 23(6), 445-460. [ Links ]
Nelson, D. B. (1991). Conditional heteroscedasticity in asset returns: A new approach. Econometrica, 59(2), 347-370. [ Links ]
Patton, A. J. (2011). Volatility forecast comparison using imperfect volatility proxies. Journal of Econometrics, 160(1), 246-256. [ Links ]
Politis, D. N. y Romano, J. P. (1994). The stationary bootstrap. Journal of the American Statistical Association, 89(428), 1303-1313. [ Links ]
Tasdemir, M. y Yalama, A. (2014). Volatiity spillover effects in interregional equity markets: Evidence from Brazil and Turkey. Emerging Markerts Finance and Trade, 50(2), 190-202. [ Links ]
Tse, Y. K. (1991). Stocks returns volatility in the Tokyo stock exchange. Japan and the World Economy, 3(3), 285-298. [ Links ]
Tse, Y. K. y Tung, S. H. (1992). Forecasting volatility in the Singapore stock market. Asia Pacific Journal of Management, 9(1), 1-13. [ Links ]
Vitor, G. (2015). Sensitivity, persistence and asymmetric effects in international stock market volatility during the global financial crisis. Revista de Métodos Cuantitativos para la Economía y la Empresa, 19(19), 42-65. [ Links ]
Walid, C., Chaker, A., Masoud, O. y Fry, J. (2011). Stock market volatility and exchange rates in emerging countries: A Markov-state switching approach. Emerging Markets Review, 12(3), 272-292. [ Links ]
White, H. (2000). A reality check for data snooping. Econometrica, 68(5), 1097-1126. [ Links ]
Yang, J., Hsiao, C., Li, Q. y Wang, Z. (2006). The emerging market crisis and stock market linkages: Further evidence. Journal of Applied Econometrics, 21(6), 727-744. [ Links ]
Received: July 03, 2015; Accepted: December 04, 2015
 Este es un artículo publicado en acceso abierto bajo una licencia Creative Commons
