


 nova página do texto(beta)
 Inglês (pdf)
 Artigo em XML
 Referências do artigo
 Enviar este artigo por email
 Citado por SciELO
  Similares em
SciELO
Similares em
SciELO 
 Permalink
Introduction
One of the latest trends in global tax evolution during the last two decades is the tax burden transfer from the direct to indirect taxes (Taxation and Customs Union, 2011, 2013). These tendencies were intensified especially after 2009, when the revenues from indirect taxes increased (within the EU-27 during the period 2009-2012 in average for about 0.9%), while the average of the company's tax burden has decreased (within the EU-27 during the period 2009-2012 in average for about 0.2%). The trends seen in the taxation of corporations are focused on enlargement of the tax base, increase of the control, tax transparency, improvement and implementation of regulations to prevent tax frauds both at national as well as international level and also on increase in the amount of sanctions imposed with the purpose to receive sufficient state revenues (Taxation and Customs Union, 2014).
One of the reasons for the tax burden transfer is besides the European Commission recommendation (European Commission, 2001) also the fact, that is according to Hynes and O’Connor (2014), who reviewed academic literature on the economic effects of corporation taxes with particular attention to growth effects, that corporate taxes are considered to be the most distorted and harmful taxes for economic growth of all of the taxes. As authors state, the relationship between corporation taxes and economic growth indicates a negative relationship of between 0.6% and 1.8% of economic growth for each 1% change in the statutory corporate tax rate Hynes and O’Connor (2014, p. 12).
The corporate income tax is a corporate tax which aggregates economic, political and social aspects. Individual aspects are implemented into corporate taxation through many quantitative and qualitative determinant's impact. Their impact may be reflected directly through tax structure itself, or indirectly through the behaviour of taxpayers (Devereux & Griffith, 2003; Hall & Rabushka, 2007).
The economic aspect is in the level of corporate tax burden reflected both in a short-term, as well as, long-term period through measurable quantitative determinants (such as the economic performance and economic development in the country, the economic cycle, the level of inflation, the external balance of the country, fiscal balance and the debt service of the country, labour market indicators, exchange rate, financial policies) and qualitative factors (such as the quality of the business environment) (Karagöz, 2013; Kubátová & Říhová, 2009; Mura & Buleca, 2012; Šoltés & Gavurová, 2013; Tkáčová, Siničáková, & Kralik, 2015; Vasiliauskaite & Stankevicius, 2009; etc.). The corporate income tax aggregates political aspects, which are reflected through implemented legislation (the quality and simplicity of legislative framework), institutional factors, political stability and continuity of tax system and tax policy, the corruption, the priorities of governmental and legislative representatives, the membership in various integration groups of economic or political character (Bayer, 2011; Bird, Martínez-Vázquez, & Torgler, 2008 in Castro & Camarillo, 2014; Martin-Mayoral & Uribe, 2010 in Castro & Camarillo, 2014; Gupta, 2007). Corporate income tax aggregates also the social aspects which belong to qualitative determinants. Into this group can be included e.g. historical and sociological factors (geographical location of the state, the state and legal system of the country), behavioural effects (behaviour of taxpayers) demographic factors, level of education and cultural dimension of individuals and the nation as a whole (Bayer, 2011; Castro & Camarillo, 2014; Hofstede, Hofstede, & Minkov, 2010; Pessino & Fenochietto, 2010).
These mentioned aspects are specific and dynamic phenomena that are constantly evolving and also influence each other (Bayer, 2011). The degree of influence may vary according to the intensity of the relation between the variables. Either the different variables affect the tax revenue with varied impact during a particular period or the same variable may affect with different intensity across different periods (Mihóková, Andrejovská, Glova, & Dráb, 2015).
Formulation of research problem, goal and methods
Tax systems of individual countries should be in the context of economic effectiveness ideally neutral. As European Commission (2001) states, in the field of corporate taxation would that mean, that the choice of investment, its financing or its exact location should not be driven by tax considerations, in international context should similar investments face markedly similar effective levels of taxation. However, tax competition has always existed (Remeur, 2015). Tax competition divided all economic experts into two groups (those who view it as a positive for economic growth as such Salin, 1998; Tiebout, 1956; Wigger & Wartha, 2003 and those who view it as harmful as such Griffith & Klemm, 2004; Stiglitz & Rosengard, 2015; Wilson, 1999) and offers for tax payers space for transferring their tax bases into countries with a lower tax burden and possibility for tax liability optimization or even avoidance, resulting in rising tax competition between states.
Tax competition between individual tax systems in the context of globalization and internationalization concentrates mainly on tax revenues from mobile tax bases, which include income from financial capital, VAT and excise taxes, personal income of individuals and not least profits of companies (Klazar, 2011). Differences in the corporate taxation resulting from tax competition can lead to an increase in social security costs because the economic activity may not take place at the lowest (before tax) cost location by the lowest cost producers (Remeur, 2015). If the impact of differences in tax regimes favours one corporate's location over another corporate's location, or one producer over another, then goods may be produced at a higher price (before tax price) (European Commission, 2001). For this reason, the size of tax differences in corporate taxation deserves attention.
Tax coordination and tax harmonization, as a basic significant processes of corporate tax burden convergence, are the subject of discussion from the beginning of the European integration process. Based on, all studies and research focused on convergence and divergence of corporate taxation within European countries, which on it is this presented research focused, play important empirical role. Due to this formulated problem is the main purpose of the presented paper in the context of practical implication to categorize EU member countries into economically meaningful groups based on the similarity in corporate taxation and to assess the convergence of European countries in corporate taxation.
The goal of this paper is to create and choose an economically transparent and meaningful categorization of the EU countries, taking into consideration selected segmentation criteria and at the same time analyse the level of convergence through the homogeneity of corporate taxation using cluster analysis. The classification of EU member countries is based on the combination of various, specifically presented in the paper variables:
effective corporate income tax rate (EATR), expressed in %,
nominal corporate income tax rate (NTR), expressed in %,
total tax burden, expressed as tax quota II (a ratio of revenues from all taxes and social contributions in the form of taxes to GDP) in %,
economic performance of the country, in the form of indicator GDP per capita at nominal values in €,
public debt, expressed as a ratio to GDP in % and
the state budget balance, deficit/surplus of state budget, expressed as a ratio to GDP in %.
The selection of variables is adequate for assessing the convergence tendencies in corporate taxation within European countries based on the following arguments. The first variable is the effective corporate tax rate. Effective tax rate was chosen for two reasons: it accounts for differences in tax bases of companies with their seats in different countries but competing on the same market, what can affect their competitiveness. The effective taxation influences the choice of location for business activities because multinational companies face only the tax rates in the country where the activity takes place (European Commission, 2001). Differences in tax systems in the field of corporate taxation cannot be evaluated with the one mentioned above variable only. Therefore, the nominal tax rate as second variable was chosen. This step was based on the Baker and McKinzie (1999) research. The European Commission Report (2001) states that the different national nominal tax rates on profits (statutory tax rates, surcharges and local taxes) can explain many of the differences in corporate taxation between countries. Baker and McKinzie (1999) prove that the composition of the tax base does not have a great impact on the tax burden and that the level of the nominal tax rate is the truly important factor for the difference in the tax burden. Corporate taxes are in the tax systems of countries linked to the taxation of personal income and consumption and property taxation and therefore it is necessary to consider the overall tax burden in the country, which is in this research expressed as tax quota. The selection of other three variables (economic performance of the economy, the state budget deficit and public debt) was conditioned by the own nature of corporate income tax, which aggregates economic aspect. The economic performance of a country (measured as GDP per capita), as confirmed by the authors Vasiliauskaite and Stankevicius (2009) in performed cluster analysis, has a positive impact on corporate taxation. The corporate tax burden has a significant impact on fiscal balance of a country and the negative fiscal development can lead the governments to solve imbalances through changes in tax burden. For reasons stated above it is necessary to consider fiscal variables (Devereux & Griffith, 2003; Krogstrup, 2002).
As these indicators take on diametrically opposed values, the data were transformed through the factor analysis.
The categorization was performed through various methodological approaches to the data study, which are based on the concept of Euclidean metric. A term meta is used here as a term for synthesis of various statistical approaches. These methods have been mentioned lately mainly in context with the issue of so called manifold learning (Bronstein, Bronstein, Kimmel, Mahmoudi, & Sapiro, 2010).
The selection of cluster analysis was conditioned by its own elementary purpose. As an important exploratory data-mining tool, cluster analysis assigns objects in a data set into meaningful and/or useful classes, so that objects in the same cluster are more similar to each other than to those in other clusters. In general, the greater the similarity within a cluster and the greater difference between individual clusters, the better or more distinct the clustering is (Norušis, 2011; Tan, Steinbach, & Kumar, 2006). Selection of clustering method represents a critical step in a clustering process and the literature offers a large number of clustering methods (Estivill-Castro & Yang, 2000; Suzuki & Shimodaira, 2006). As Kaufmann and Rousseeuw (2005) state, the choice of a clustering algorithm depends both on the type of data available and on the particular purpose. In accordance to formulated purpose and relative small database within the cluster analysis methodology traditional hierarchical cluster methods and non-hierarchical cluster methods can be used. Within the hierarchical methods were chosen the Ward linkage and the median method (according to Ferreira and Hitchcock, 2009). As a supplement and for comparison purposes was non-hierarchical cluster analysis used, applied through k-means and fuzzy c-means methods, which was compared to other methods to detect so called vaguely defined objects (Hastie, Tibshirani, & Friedman, 2009). The information on cluster structure was added by the multidimensional scaling. The cluster analysis was performed in the statistical programme R for the EU countries for year 2013. The quantitative data were taken from the Eurostat database.
The results of individual analysis within the selected clustering methods were mutually compared and possible output deviations caused by algorithms of clustering processes were taken into consideration within assessment of EU countries similarity in the context of corporate income tax and assessment the of corporate taxation level within the tax system convergence.
Theoretical aspects of selected corporate tax determinants
The purpose of the research in the context of theoretical implication is to provide a synthesis of knowledge and empirical evidence about selected determinants of corporate taxation and to verify the applicability of the hierarchical and non-hierarchical clustering methods in gaining knowledge in the field of taxation. Between selected determinants were included also variables, which were chosen as segmentation criteria and are significant for assessment of corporate taxation similarity and tax convergence.
For categorization of EU member countries in the context of corporate income tax six segmentation criteria were used, selection of which was conditioned by theoretical knowledge about their influence within the tax burden. The object of the presented part of the paper is to describe relations between considered variables and corporate income tax.
The important segmentation criteria in the presented cluster analysis is the economy performance expressed as a GDP or GDP per capita, which is the object of many foreign research such as Castro and Camarillo (2014) and Livermore (2004). Authors studied the relation between the GDP and tax revenues as a part of their econometric analysis. Authors state, that increase in the profit from which is tax calculated has a positive impact on GDP. The impact of GDP on corporate income tax revenue is studied also by Kubátová and Říhová (2009), Bayer (2011), and Bánociová and Pavlíková (2013), who refer to a positive impact of GDP on this tax through the panel regression analysis and the econometric model. Based on these research may identify a two-way positive relation between GDP and corporate income tax. Interdependence of GDP variation and structured tax burden was studied and analysed through the Spearman correlation coefficient and thereafter they applied the method of cluster analysis on the data specimen of EU member states also by Vasiliauskaite and Stankevicius (2009). Their results show that the level of state's GDP per capita causes a positive effect to the decrease of corporate income tax (lower GDP per capita significantly supports the positive impacts of decreased corporate income tax in economy).
The significant determinant of tax burden is tax rate. Tax rates (nominal, effective and average tax rates) are important indicators used not only by investors, but also by politicians and economists. The dependency between the tax rate and the tax income was studied and analysed by Clausing (2007), Devereux (2006) or Devereux and Griffith (1999, 2003). The results of their research show that higher the tax rate, higher the tax income increase. Based on these research may be identified a two-way negative relation between tax rate and corporate income tax.
Negative relation is also between tax rate and investments. The higher the corporate income tax rate is, the more negative impact on investments is shown by the further increase of this rate. On the contrary decrease in the corporate tax and mainly removal of selective benefits and tax rebates, might deform the business and economic environment. The studies of Johansson, Heady, Arnold, Brys, and Vartia (2008) have proven that the selective tax support of investments in small businesses is not efficient in the global view and does not lead to the increase of total investments in the economy. The businesses’ investments create a negative dependence on corporate taxation and that is through the user costs of capital (Rosen, 1992). The effect of negative dependence between corporate tax rate and investments at the company level is confirmed by authors Schwellnuss and Arnold (2008) and Arnold et al. (2011), who show the effect of the negative dependence between the investments and tax rate also at the level of industrial sector, but only with minimal effect.
The ability of government to effectively manage the finances of state budget has a direct impact also on the state's tax policy, as in case of imbalanced budget, the state is forced to arrange for missing finances to cover the higher state expenses and that is often done in form of taxes. An existing fiscal imbalance can be tracked based on two indicators and that is state budget balance and public debt (Dráb & Mihóková, 2013). The impact of tax debt service on taxes, tax systems, and primary expenditures and on tax competitiveness was studied by Krogstrup (2002) within the study of the European Central Bank, where he focused on the causality between a fiscal imbalance and tax burden. A public debt and the state budget deficit were considered as variables which are set up front. The results of his regression analysis confirmed that a one percentage point increase in the debt service to GDP ratio results in an average 0.20 percentage point increase in the tax burden in the following period.
Hierarchical and non-hierarchical cluster analysis of corporate taxation
Categorization of the EU member countries focuses on the identification of economically meaningful classes based on similarities in corporate taxation and assessment of the corporate taxation level in the context of tax systems convergence.
The analysis was performed and is presented in two steps. In the first step of the research, which is processed in chapters 4.1-4.4 of this paper, were clusters of similar countries identified using each of the cluster analysis applied methods (Ward method, median method, k-means cluster analysis and fuzzy). The final groups of these multidimensional objects with characteristics were mutually compared and verified in the economic sense with the goal to identify economically meaningful categorization. In the second step of the research (chapter 5), was the final categorization of countries performed, discussed and assessed within the context of tax systems convergence.
Ward's method of hierarchical clustering
The output of cluster analysis performed through the Ward's method is the dendrogram. This method creates approximately equally numerous clusters, while using the function NbClust allowed us to identify that the optimal number of clusters is five. These clusters were visualized in the form of dendrogram through cut tree command, as shown in Figure 1.

Source: Graphical output from R-programme
Figure 1 Dendrogram created through Ward's method of cluster analysis for year 2013.
It has been confirmed in Table 1 that the Ward's method creates the cluster of approximately same amount. The exception is only the fifth cluster with Greece and Slovenia. However they report such common characteristics by which they differ from other clusters.
Table 1 Cluster classification of the EU member states through Ward's method for year 2013.

Source: Authors´ own elaboration.
The similarity rate of objects within one cluster and also the degree of dissimilarity of objects from different clusters is shown in Figure 2. The results of the cluster analysis report the satisfactory conclusion, as none of the clusters were overlapping and had joint intersections. The graph also outlines the object of the fifth cluster (Greece and Slovenia), which is significantly different than the others.

Median method of hierarchical clustering
The second used method was the median method. As it is a hierarchical method, the output of the analysis is a dendrogram, as shown in Figure 3. Using the NbClust function was determined that the optimal number of clusters is seven, which was visualized in dendrogram.

Source: Graphical output from R-programme
Figure 3 Dendrogram created through the median method of clustering.
By comparing the outputs with the Ward's method may conclude the following findings. According to the median method the recommended number of clusters (seven) is higher than according to the Ward's method (five). The median method reports three clusters containing one country in each and it is Greece, Slovenia and Luxemburg. The analysis using the Ward's method grouped Greece and Slovenia in one cluster and Luxemburg was a part of cluster of the most developed EU countries, such as Netherlands, Austria, Germany, Denmark, Sweden and Finland. The specifics of these three countries (Greece, Slovenia and Luxemburg) were however clearly shown also in the Ward's method. The reason why these countries were separated when using the median method is a fact that this method primary does not track the number of clusters, while the Ward's method creates the clusters of approximately the same size. Comparison of other analysed countries and clusters points out that the classification of the EU countries is exactly the same. Based on the above mentioned can be stated that the clustering of the member states was performed mainly by using their similarities and differences and the selection of the certain method of hierarchical clustering influenced the results only in the small extent. Figure 4 shows the complete comparison of both methods.

k-means method of non-hierarchical clustering
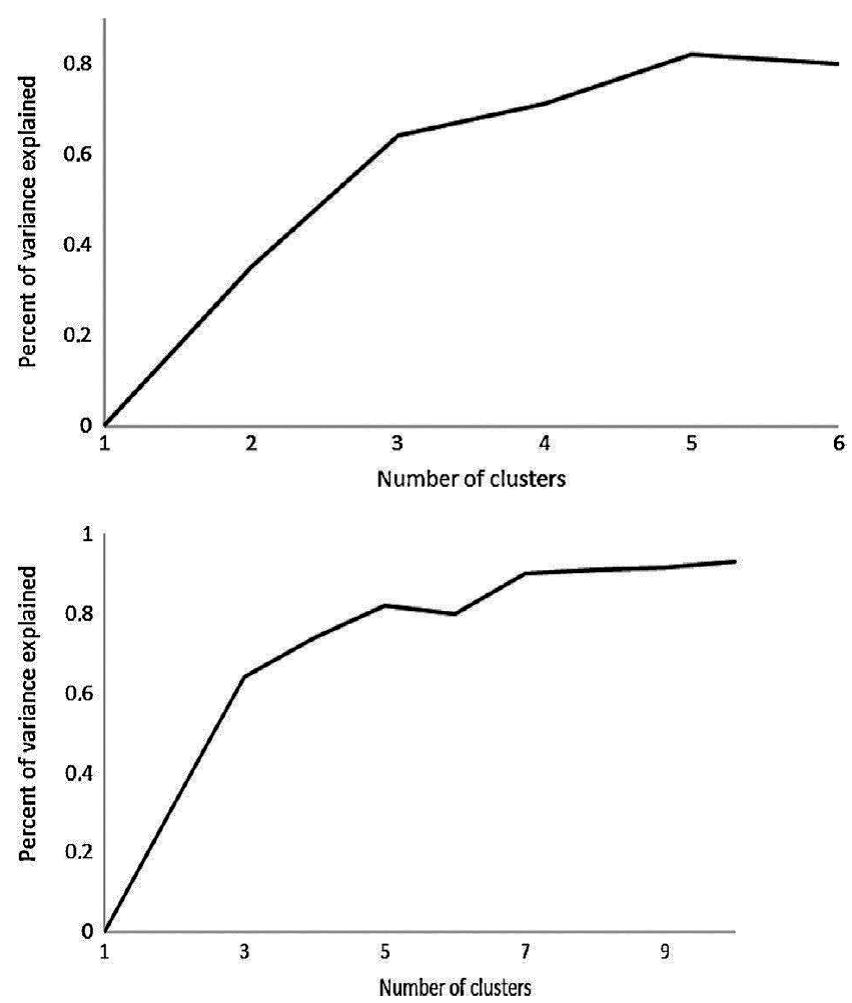
For comparison was used the k-means method and the fuzzy cluster analysis. The optimal number of clusters was determined visually from the graphical presentation in Figure 5, based on which we decided on optimal number of clusters being five. The testing shows the optimal number of clusters between one to 10 clusters.
Source: Graphical output from R-programme.
Figure 5 Determination of optimal number of clusters by k-means method.
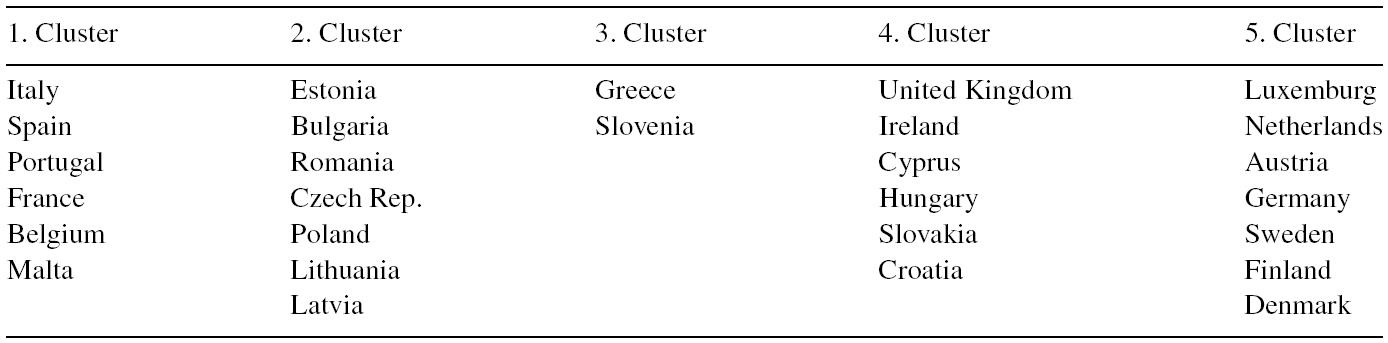
The curve sharply increased to the value of five, which indicated that this value represents the optimum. Although the curve had the steepest increase at the value of two clusters, it would not have sufficient informative nor analytical value to perform the cluster analysis for classification of the EU member states only into two clusters. Therefore we prefer using the result of grouping the objects (28 EU member states) into five clusters also in case of non-hierarchical clustering through k-means method, as it was in the analysis done through the hierarchical clustering. The result of analysis performed through the k-means method is five clusters with six, seven, two, six and seven EU member states, as shown in Table 2.
Table 2 Cluster classification of EU countries according to the k-means method for year 2013.
Source: Authors´own elaboration
Comparing the results obtained using the k-means method and the results from the hierarchical Ward's method (Table 1), was found out that both these methods had the same results, which is very favourable and testifies the appropriate classification of the member states into individual clusters. The first match was reached by clustering the states into five clusters. Although the number of clusters was selected solely based on our decisions, but still using the results of testing in R-programme. Identical outputs of the Ward's hierarchical method and the non-hierarchical k-means method were reported also in specific grouping of EU member states into individual clusters. All of these countries were grouped into clusters by non-hierarchical k-means method the same as it was by the hierarchical Ward's method. The results of clustering method k-means proved what was already stated that the clustering fulfilled the requirements of clear classification, the clusters were not overlapping and the distance between them is sufficient.
Non-hierarchical method of fuzzy cluster analysis
The second testing non-hierarchical method used was the fuzzy cluster analysis. This method was chosen due to the fact that compared to all other methods used so far, this one is very specific in its algorithm of clustering. It used the probability calculations and it allowed the partial grouping of one object in more clusters, always with a certain probability. Therefore may exclude any distortion of the total cluster analysis. Every object was assigned with the probability values which grouped this subject into individual clusters. The analysis was formulated also by the multidimensional scaling (Fig. 6). The overlapping shows the percentage rate of relevance of a given object to a certain cluster.

Source: Graphical output from R-programme
Figure 6 Multidimensional scaling of the EU member states by fuzzy cluster analysis.
The data file showed the relevance rate of some objects very high, some of the countries reported the signs of relevance to more than just one cluster. In case of classification into five clusters, the clearest cluster classification was shown by Romania with the value of 81%. The lowest relevance rate (30%) was reported by Slovakia and Greece. This result is understandable as Greece is within the EU member states a very unique state in regards to its current political and economic situation and therefore its grouping into cluster with other member states is very ambiguous. In the previous analysis Greece created its own cluster or it was grouped with Slovenia. On the other hand, Slovakia was at the interface of possible clusters, which were identified by previous methods. The Ward's and also the median methods, as well as the k-means method grouped Slovakia in the cluster together with Hungary, Croatia, United Kingdom, Ireland and Cyprus. Slovakia was also grouped into cluster of member states such as Czech Republic, Poland, Bulgaria, Romania, Estonia, Lithuania and Latvia (Fig. 6). Also the specific position of Luxemburg within the EU member states was confirmed. The used methods grouped the states such as Italy, Spain, Portugal, France, Belgium and Malta as objects of one cluster. The classified cluster reported certain differences between two groups of countries, where on one hand it was Belgium, France and Malta and on the other hand it was Italy, Spain and Portugal. These two relevant subgroups of the cluster were proven also by the dendrograms created through the Ward's method (Fig. 2) as well as by the median method (Fig. 3).
Discussion and corporate taxation cluster analysis results
The main goal of provided cluster analysis was, based on the selected segmentation criteria, to create and select a transparent categorization of EU countries. Based on the results giving identical classification classes using either Ward hierarchical or k-means non-hierarchical methods, was as the effective and economically meaningful categorization of European countries for corporate taxation a classification into five groups chosen (Table 3). The other two methods (median method and fuzzy analysis) classified the core of EU states identically with only minor variances for those EU member states (Greece, Slovenia and Luxemburg). The final five homogenous groups of multidimensional objects were the subjects of the presented discussion in order to assess similarities and differences of corporate taxation within the European countries and assess the convergence process of tax systems.

The summarization table (Table 3) shows the final created categorization of EU member countries with the average value of individual segmentation variables for each cluster.
The first cluster consists of six EU countries (Italy, Spain, Portugal, France, Belgium and Malta). In the context of corporate taxation convergence assessing can be stated that countries from the first group are characterized by a high degree of similarity. All countries had the nominal tax rate of corporate income tax in the range from 25 to 33.99%, which is the highest among the identified clusters. The overall tax burden is the second highest burden among groups. The level of the effective tax rate in these countries is the highest in comparison with other clusters and reaches an average of 29.8%. For the first cluster can be concluded that countries have a similar corporate taxation system and with their high level of corporate taxation can be considered as at least competitive. Countries in the first cluster are characterized by economic performance, which is at the EU average level. These geographically clustered countries have a potential risk for taxpayers in the context of fiscal discipline, they have critical short-term and long-term fiscal imbalance values. A low fiscal discipline was reflected also in the indicator of the state budget's year over year economic results. In 2013 a state budget's deficit exceeded the limit value set by Maastricht criteria (3% GDP) by over one percentage point. The public debt reached within this cluster an enormous value of over 102% GDP. That was caused mainly due to the Spain, Portugal (128% GDP) and Italy (127.9% GDP) having in this cluster, which were the countries with huge macroeconomic issues, instability of public finances and long-lasting debt crisis. As Barro (1979) stated, the public debt in the beginning produces an increase of tax revenues, because governments try to cover the debt through increasing taxes. From the long-term point of view the rise of the taxes causes a decrease in revenues, because companies have a tendency to evade the tax and to transfer their profit into offshore countries. This could also be applied for this cluster. Companies could tend to move their mobile tax bases to other countries and so benefit from a lower level of tax burden. All of the countries in this cluster reported a statistically higher public debt than was allowed by Maastricht criteria (60% GDP).
The second group consists of seven EU countries (Estonia, Lithuania, Latvia, Bulgaria, Romania, Poland and Czech Republic). This group has a significant level of convergence of corporate taxation, because the nominal tax rate ranges from 15%-21%. The level of effective corporate taxation, which includes tax base is at low level in average 14.3% and it belongs to the lowest level of corporate tax burden among European countries. Together with the lowest European average level of total tax burden the second group of countries represents the most tax competitive countries. As Clausing (2011) stated, low tax burden makes the business and investment environment more attractive. This fact confirms the real case of Latvia, which belongs to the popular off shore countries used by Slovak entrepreneurs (“Bisnode,” n.d.). Decrease in tax rates on corporate income by 10 percentage points could produce an annual growth of GDP per capita by 0.7 to 1.1 points (Lee & Gordon, 2005). This cluster consists mostly of newly acceding EU member countries, in which the convergence of economic policies and convergence of tax systems at the same time does not reach the level comparable to the old EU member countries (countries included into the first and third cluster). Although in terms of country's economic performance (with respect to population size) do belong these countries to the group with the below-average values compared to the EU average. In terms of fiscal discipline they are among the most disciplined countries (especially in the long-term fiscal discipline). The average value of the public debt is only about 35% of GDP and the quantitative requirements for the debt levels are fullfilled by all countries. Within the short-term fiscal management all countries observe fiscal discipline and values of deficits do not exceed stated limits (except for Poland). Country that deserves attention is Estonia (with a deficit of only 0.5% of GDP and with the level of public debt 10.1% of GDP). Because of Estonia's attitude to macroeconomic and fiscal problems and their solutions the country became an extraordinary member of the EU and euro area and could inspire other states in keeping their public finances (Mecele, 2014).
The third cluster was represented by the most developed EU countries, with very good values of financial indicators and with the highly developed financial market. Based on the mutual similarity, this cluster was formed by old member states such as Luxemburg, Netherlands, Denmark, Sweden, Finland, Germany and Austria. The value of indicator GDP per capita proved the level of economic performance, as it reached two to four times higher values than other clusters. The economic performance (GDP per capita) of all the countries in this cluster highly exceeded the EU average (from 33,300 € - Germany up to 83,400 € - Luxemburg). In the fiscal context were assessed criteria of short-term budget management as very positive and countries like Germany (0.1% GDP) and Luxemburg (0.6% GDP) had even a budget surplus. The public debt values were within this group in accordance to long-term sustainability requirement. In accordance to the economic and fiscal development background can be stated, that tax systems of the third group is characterized by high and significant similarity of corporate taxation. The average nominal corporate tax rate is 25.8%, because the range of nominal corporate tax rate within these countries varies from 22% to 29.5%. The effective corporate tax rate is the second highest among all identified groups and it reached 23.2%. Together with the highest total tax burden can be these geographically clustered and connected countries consider as the lowest tax competitive countries. In the corporate tax system convergence process context can be stated that the third cluster countries’ convergence has similar level as those in the first cluster.
The fourth cluster consisted of six states (Slovakia, Hungary, United Kingdom, Ireland, Cyprus and Croatia). This cluster can be consider as homogenous in all three analysed areas. In the fiscal context are these countries characterized by instability of public finances and low fiscal discipline, as the indicators of public debt and state budget deficit exceeded the level set for the member states. The worst position in the fiscal area was clearly in Ireland and Cyprus, where their public debts overran 100% of GDP. Within the economic performance of the cluster, countries belong to the group with under average values in EU. The highest values of the economic performance (GDP per capita) were reached by United Kingdom (29,600 €) and Ireland (35,600 €), which had a similar structure of their tax systems and then the lowest values were in Hungary (9900 €). Economic and fiscal management of countries influences the level of tax burden (Devereux & Griffith, 2003; Vasiliauskaite & Stankevicius, 2009) and can be confirmed within this cluster. Countries in the fourth cluster are characterized by a low level of corporate tax convergence because the nominal corporate tax rate ranges from 12.5% to 23%, which is the widest range in comparison with other clusters. The level of effective corporate taxation at 18.4% and therefore is this value classifies among countries with the second lowest corporate tax burden. With its second lowest level of total tax burden this cluster represents the most tax competitive cluster. This fact is confirmed by Cyprus, which is the second most preferred off shore country for Slovak entrepreneurs and this has even an increasing trend (“Bisnode,” n.d.). After comparison between all clusters can be stated that countries in the fourth cluster are new EU member countries and have a significant similarity with the second cluster. Based on, the convergence in the corporate tax system context these countries are in the “catching up” process with the EU average.
The last cluster can be considered as the special cluster, because the non-hierarchical methods fuzzy clustering confirmed that these two countries had the lowest similarity. The fifth cluster consists of only two countries, Greece and Slovenia. Both countries are characterized by problems in the economic development and fiscal discipline, because the average values of GDP per capita are at the second worst level and so are the short-term and long-term fiscal imbalances. It is important to note that the significant contribution on these “bad” values has Greece, which in the analysed year faced serious macroeconomic and political problems, disruption of public finances and almost existential question in the context of the international legal status (12.2% of GDP deficit and public debt of 175% of GDP). The total tax burden was at 42.75%. Based on the above, assessing the level of convergence in the area of corporate taxation of these countries is difficult. The nominal corporate tax rate in Greece was in 2013 at 26% and in Slovenia was at 17%. The effective corporate tax rate is at the average level of 19.8%. Based on all these criteria can be concluded that in view of the similarity of corporate taxation should Slovenia belong to cluster 2 and Greece to cluster 3.
Based on the performed analysis, the claim of Remeur (2015) about the tax competition existence between countries has been successfully confirmed. The result of cluster analysis shows differences in corporate taxation within European countries. The analysis also confirmed that despite continuous integration within EU and harmonization efforts of tax systems significant differences between individual countries do exist. These differences are visible in the level of the nominal corporate taxation and effective corporate taxation, which aggregate other differences visible in economic performance and fiscal balance of these countries. The analysis shows also important differences between new and old EU member countries. The final clusters number two and four (Table 3), which include new entered member countries (with the date of enter 2004-2013) are within the corporate taxation very divergent compared to countries in cluster number one and three (Table 3), which represent old member countries (with the date of enter 1957-2003). The level of effective corporate taxation between these two groups reaches a difference of a range from 4.8% to 15.5%. At the same time, countries included into cluster number one and cluster number three can be considered as less attractive in the tax context in comparison with countries from cluster number two and four, which are for tax payers more interesting in term of taxation. These countries create a space for an increase in social security costs because the economic activity may not take place at the lowest (before tax) cost location by the lowest cost producers (Remeur, 2015).
The assessment of cluster analysis results, in accordance to formulated main purpose of this research confirms that the certain level of convergence of corporate tax system exists, but in principle only in two separate blocks (the old and the new EU member countries). Therefore the convergence efforts in these EU countries’ systems should continue.
The analysis confirms that the process of harmonization of policies is a long-term, dynamic and unique process. Disparities could negatively impact mainly the countries of the European Monetary Union, which have introduced a common currency and single monetary policy without forming the fiscal union first. The problematic area in the tax sector of the EU represents the national reforms which are often inconsistent and the difficulties persist also in the ambivalent attitudes to harmonization of the corporate income tax. The professional discussions (Arnold et al., 2011; Bayer, 2011; Clausing, 2007; Johansson, Heady, Arnold, Brys, & Vartia 2008; Kubátová & Říhová, 2009) on development trends in the future and on possible modifications of the corporate income tax structure are still present and unceasing, while the experience clearly shows that the conformity and general consensus are not always reached.
Conclusion
The purpose of the research was formulated in the theoretical and practical implication. The theoretical implication of the realized research can be considered as satisfied as this research provided a synthesis of knowledge and empirical evidence about aggregated aspects into corporate tax in the form of economic, political and fiscal determinants. The empirical results of performed analysis also confirmed that the cluster analysis as a data-mining tool is a suitable method in obtaining required information in tax area and an applicable method for assessing the similarity of corporate tax system based on the classification of objects into meaningful and useful groups.
The role of performed research in terms of its practical implications was to create economically efficient and transparent categorization of EU countries and to assess the convergence process in the field of corporate taxation. Practical implications can be considered as realized and satisfied, as the creation of five cluster categorization corresponds to selected segmentation criteria and allows to evaluate the level of similarities and differences in corporate taxation at a sufficient level. The analysis confirmed that between countries there are still significant differences in the level of nominal and effective corporate tax burden, especially among a group of old and new EU Member States. Implemented cluster analysis shows to be justified and beneficial, because through its application it was able to verify, that the level of convergence in the tax system is not sufficient and there is still space for implementation of harmonization measures. A current and important issue remains within European tax systems still open is the requirement of neutrality of corporate taxation. Corporations do not face markedly different effective corporate taxation, which should lead to growth of harmful tax competition.

