


Serviços Personalizados
Journal
Artigo
 texto em
  Inglês (pdf)
 Artigo em XML
 Referências do artigo
 Enviar este artigo por email
Indicadores
-
 Citado por SciELO
 -
 Acessos
Links relacionados
-
 Similares em
SciELO
Similares em
SciELO
Compartilhar

 Permalink
Contaduría y administración
versão impressa ISSN 0186-1042
Contad. Adm vol.62 no.3 Ciudad de México Jul./Set. 2017
https://doi.org/10.1016/j.cya.2016.01.004
Articles
Transmission of future prices of corn of the Chicago Board of Trade to the Mexican spot market
aUniversidad Panamericana, México
bInstituto Politécnico Nacional, México
In Mexico, the use of the coverage program of the Bureau of Market Services and Agricultural Market Development (ASERCA for its acronym in Spanish) is a tool that has been used by corn producers (mainly for white corn) for the acquisition of derived products in the CBOT (Chicago Board of Trade), the underlying element of which is US#2 grade yellow corn. In a high volatility environment regarding the prices of corn, the prices of CBOT should be adjusted with the spot domestic prices to incentivize Mexican producers to participate in the program. However, through a multivariate stochastic volatility analysis during the period of 2007-2012, it was shown that the future price of corn is not strongly related to the prices registered in some states of the country, therefore, it can be inferred that the coverage through the ASERCA program does not properly comply with its objective of protecting the national farmers that grow white corn, despite the fact that its use has increased.
Keywords Corn prices; Multivariate stochastic volatility; Chicago Board of Trade
JEL Classification C32; D52; G13; Q14
En México, el uso del programa de coberturas de la Agencia de Servicios a la Comercialización y Desarrollo de Mercados Agropecuarios (ASERCA) es un instrumento que ha sido utilizado por los productores de maíz (principalmente blanco) para la adquisición de productos derivados en el Chicago Board of Trade (CBOT), cuyo subyacente es el maíz amarillo calidad US#2. En un entorno de alta volatilidad en los precios del maíz, los precios del CBOT deberían ajustarse con los precios spot domésticos para incentivar a los productores mexicanos a participar en el programa, sin embargo, mediante un análisis de volatilidad estocástica multivariante durante el periodo de 2007 a 2012, se mostró que el precio de mercado de futuros de maíz no se encuentra fuertemente relacionado con los precios registrados en algunos estados del país, por lo que se puede inferir que la cobertura mediante el programa ASERCA no cumple adecuadamente con su propósito de proteger a los agricultores nacionales que siembran maíz blanco, a pesar de que su uso se ha incrementado.
Palabras clave Precios de maíz; Chicago Board of Trade; Volatilidad estocástica multivariante
Clasificación JEL C32; D52; G13; Q14
Introduction
A way to identify the interrelations between markets is through the study of volatility transmission. In this work, the existing integration in the spot price of Mexican domestic white corn and the futures market of yellow corn #2 negotiated in the CBOT was studied. This was done under the context of the “Aid and Service to Agricultural Marketing” (ASERCA for its acronym in Spanish) offered by the Secretariat of Agriculture, Livestock, Rural Development, Fisheries and Food (SAGARPA for its acronym in Spanish).
It is through the ASERCA program that Mexican corn producers have access to the price coverage offered in the CBOT; the price coverage scheme emerged in 1993 due to the sudden fall in the prices of cotton and consequently, the need to guarantee a just price to the producer. It has been since 1997 that coverage in the price of corn was done through put and call option positions.
It is interesting to know the relation between corn prices in the Mexican spot market and the futures market of Chicago, considering that the domestic prices are not competitive, according to the SIAP (2012).1 This because the white corn produced in the country is approximately 35% more expensive than yellow corn; additionally, agricultural policy is characterized for maintaining high subsidies for their producers and low export prices.
As mentioned before, one way of knowing the interrelations between different markets is to study the transmission of volatilities between them, for which the multivariate GARCH models (MGARCH) can be used. The authors that propose this type of modeling are:Bollerslev (1990), Longin and Solnik (1995), Karoyi and Stulz (1996), Engle (2002), among others. Bawens, Hafner, and Pierret (2013) used a GJR-GARCH model to model the dynamic volatility and correlation in the structure of the futures markets of the European Energy Exchange index. A very complete review of the literature regarding this type of models is offered from the econometric point of view by Bawens, Laurent, and Rombouts, (2006); and a similar study is developed by Asai, McAleer, and Yu (2006) for stochastic models. Bawens, Hafner, and Laurent (2012) present an analysis and detailed applications of multivariate GARCH models and stochastic volatility models.
Regarding the integration between the spot and futures markets, some of the studies that offer evidence through MGARCH models can be found in Ledebur and Schmitz (2009), Shawky, Marathe, and Barrett (2003), Hernández and Ibarra (2011), and Bekiros and Diks (2008).
The study of the spot and futures prices of white and yellow corn, respectively, has been scarcely researched. One first step through the estimation of Autoregressive Vectors is offered by Godínez (2006) and, subsequently, Rapsomanikis (2011) does it with a MGARCH model. This research presents significant advances, using a Multivariate Stochastic Volatility Model, through which it is possible to measure the dynamics of the ASERCA program. This work is developed in the following manner: the section “Coverage policy for the price of corn in Mexico” addresses the coverage policy for the price of corn in Mexico; it also describes the operation bases of the ASERCA program as a means of coverage for corn prices. The section “Stochastic volatility models” briefly establishes the reference framework on the stochastic volatility models, placing greater emphasis on the multivariate models. The section “Information” presents the data used for the study. The section “Analysis of the results” formulates the development of the econometric analysis, using the multivariate stochastic volatility models described in section two. Finally, the conclusions of this work are presented.
Coverage policy for the price of corn in Mexico
The cyclical nature of agriculture, its financial dependence, and the weather, cause the production of grains in Mexico to develop in an uncertain environment, which is reflected in the tendency of grain prices and in the income of the producers.
As Mexico stands within a context of trade openness since the 1990s, the Mexican producers of corn saw their income affected by market saturation during harvest season, as they came from a protected economy, a price regime established by the State, and significant subsidies for production distanced them from the international context (Ochoa, 2011a).
To reduce these negative effects, the Federal Government created the ASERCA program in 1991, making the protection of producers’ incomes against adverse movements one of its main objectives. This is done through coverage with tools from futures markets. However, it was not until 1996 that the National Company of Popular Subsistence (CONASUPO for its acronym in Spanish) stopped regulating the prices of corn and the program started being used by producers (of white corn for the most part) for the acquisition of trading securities in the CBOT, which have US#2 grade yellow corn as an underlying element.
The coverage of ASERCA involves a position in the futures market, opposed to the one that the participant has in the domestic spot market; therefore, any loss in the spot market is compensated with the coverage in the futures market (Ochoa, 2011b).
During the period of 1997-2011, 705,672 corn contracts were covered, which indicates that this type of tool has had a significant governmental boost and response by the producers (Ochoa, 2011b). The way in which the use of coverage contracts for the price of different agricultural products through the ASERCA program has increased throughout time can be clearly observed in Fig. 1.
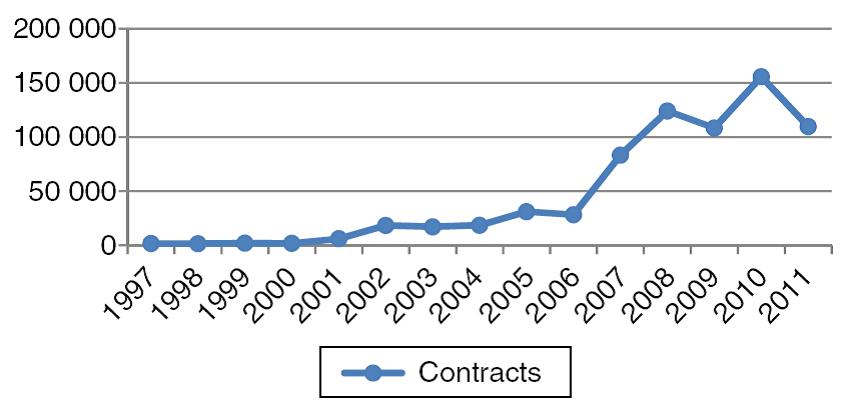
The products that were subject to coverage during the period of 1997-2007 have been: corn, wheat, sorghum, coffee, cotton, pig farming, beef cattle, soy, safflower, and orange juice. Corn, with 50.15% of the total contracts, is the product with the greatest number of contracted coverage. Sinaloa is the biggest producer of corn in the country, it is the state with the greatest number of placements with 26.9% (Ochoa, 2011b).
On the other hand, on October 24th, 2012, SAGARPA presented the first futures contract for yellow corn in Mexico through MexDer (Mexican Derivative Market), naming the producers, marketers, industrialists and financial investors of the agricultural sector as beneficiaries (SAGARPA, 2012).
ASERCA (2012) indicated that Mexico is far from having an agricultural exchange, as there are no known prices, regulation mechanisms, arbitration, conflict resolution and physical quality certificates. In this manner, the first step was to list the corn futures contracts of the CME group,2 with FIRA (Trust Funds for Rural Development) as a financial agent of the government to perform the duties of ASERCA. With the participation of banking and non-banking intermediaries that operate with FIRA, the purchase of coverage would be subsidized with resources from SAGARPA.
The international experience, according to CEDDRSSA(2007) is that before having a futures market, it is necessary to have an exchange for physicals. However, in Mexico, it was started by listing futures contracts of yellow corn, a product that is cheaper than white corn, and considering that according to the SIAP (2012) the national production of corn was of 94% white corn, the price to the producer suffers when it participates in coverage.
Given the difficulty of having an agricultural futures exchange market in Mexico, it is of great interest to know the relation between the future price of US#2 grade yellow corn commercialized in the CME Group and the spot prices of Mexican white corn, as this product has had a greater subsidy from ASERCA and the yellow corn used for the coverage is of lower quality and price.
Stochastic volatility models
Volatility can be modeled through the calculation of the variance or the standard deviation of the yields of a financial series within a specific period of time, which makes it possible to carry out the volatility prediction for future periods. However, there is evidence that suggests that predicting volatility in a more sophisticated manner leads to more exact assessments regarding the financial series (Brooks, 2008).
Due to the fact that volatility cannot be directly observed, it is necessary to resort to some characteristics that can be observed in a time series (Tsay, 2005):
It can be grouped, that is, it can be high at certain periods of time and lower at others (volatility cluster).
It involves time in a continuous manner, meaning that spikes in volatility are rare.
Volatility does not tend toward infinity, it varies within a fixed range. Statistically, it means that volatility is sometimes stationary.
Volatility reacts differently to a big increase in the price than to a big drop in the same, this is known as leverage.
Two additional characteristics are that the series present leptokurtosis and have thicker tails than the normal distribution, as well as symmetrical distributions (Nieto, Oribe, & Zarraga, 2011). Ruiz and Veiga (2008) state that, from the econometrics point of view, the efficiency of the estimators and the construction of prediction intervals are linked to heteroscedasticity (temporary evolution of volatility) being adequately modeled.
On the other hand, Broto and Ruiz (2004) declare that the increase in interest for the stochastic volatility models is due to the fact that they are frequently used in the financial theory to model the behavior of financial prices. Compared to the most popular known models, such as GARCH (Generalized Autoregressive Conditionally Heteroscedastic), the former more efficiently capture the main properties of the yields observed in the financial series.
According to Soriano and Climent (2006), the most used methodologies for the analysis of volatility transmission can be grouped into three categories: GARCH models, regime change models and stochastic volatility models. This section presents a brief description of the GARCH and stochastic volatility models. Highlighting multivariate models, we shall begin with the GARCH models, which make it possible to model the variance based on the dependency of its own lags (Tsay, 2010); in the MGARCH multivariate case, it is possible to estimate the interactions between volatilities (variance-covariance) of different series in all directions (Asai et al., 2006; Philipov & Glickman, 2006; Ruiz & Veiga, 2008; Soriano, 2004), the general model is described in Bawens et al. (2006, 2012).
Given that there are different representations of the MGARCH models that are estimated through the maximum likelihood method, it was considered adequate to briefly present the more used representations, which are shown in Table 1.
Table 1 Classification of the main MGARCH models.
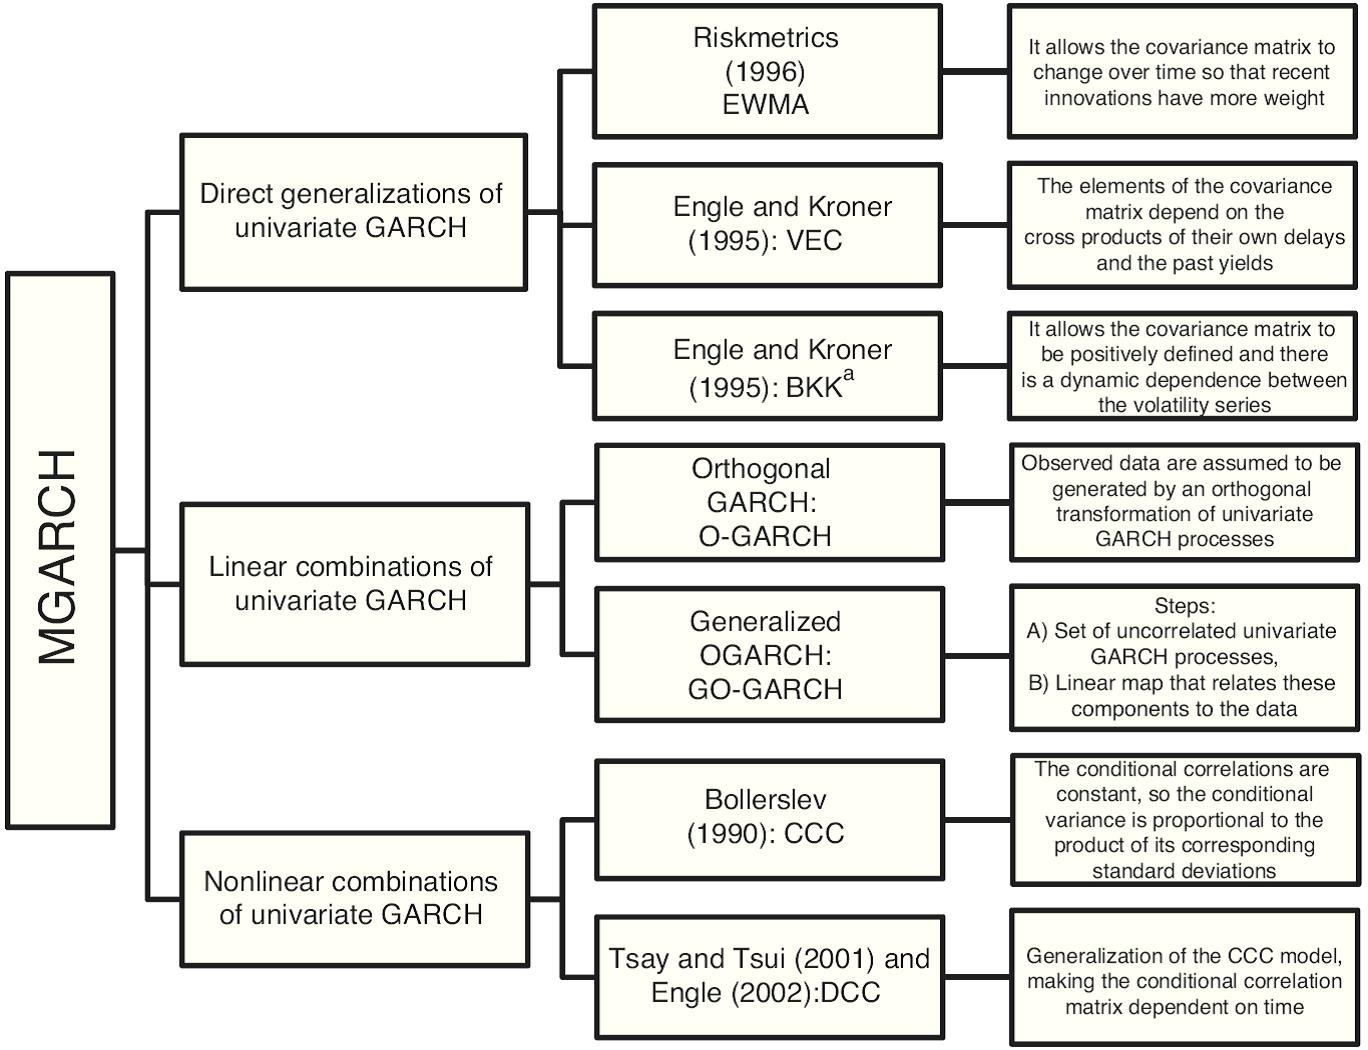
a Engle and Kroner (1995).
Source: Own elaboration based on Bawens et al. (2006) and Tsay (2010).
In the case of the econometric models, as is the case of the Constant Correlation Model and Dynamic Correlation Model, they have become popular due to the fact that the imposed restrictions are easy to model. A similar model is the Varying Conditional Correlation, which are the models used to comply with the objective of this work.
The specifications of the MGARCH models are mentioned below and are described in detail in Bawens et al. (2006):
Constant Correlation Model (CCC)
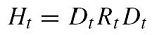
In this specification of the MGARCH models, the conditional correlations are constant and, consequently, the covariances are proportional to the product of the corresponding conditional standard deviations. This restriction reduces the number of unknown parameters and simplifies the estimation. The CCC model is defined as follows:
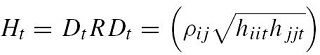
where
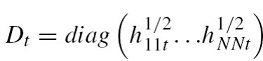
R is the matrix that contains the constant conditional correlations ρij. The original model had a GARCH (1,1) as specification for each conditional variance in Dt:

The Ht matrix is positive-definite if, and only if, the conditional variances are positive and R is also positive-definite.
The premise that conditional correlations are constant can seem unrealistic, though even so this model helps to know the degree of interdependence between markets.
Dynamic Correlation Model (DCC)
This model is a generalization of the previous model, it makes it possible for the correlation matrix to vary in time, which could be positive-definite throughout time. The original specifications of the model are:
Dt is once again:
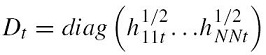
And hiit can be defined as any univariate GARCH model.

θ1 and θ2 are non-negative parameters that fulfill the condition of: θ1+θ2<1,R is a positive-definite parameter symmetric matrix with ρii=1 and ψt−1 is anN×N of ετ order correlation matrix, for τ=t−M,t−M+1,…,t−1. Its i th andj th elements are given by:
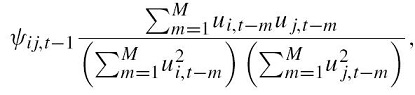
where
And matrix ψt−1, can be defined as:
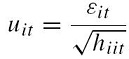
And Bt−1 is a diagonal matrix of N×Norder as i th diagonal elements given by:
And Lt−1=(ut−1,…,ut−M) is anN×M matrix that includes ut = (u1tu2t…uNt)′.
A necessary condition to guarantee that ψt−1 and Rt are positive is that M≥N.
Varying Conditional Correlation Model (VCC)
Finally, Tsay and Tsui (2001) pick up the previous model and assuming normal yields, the logarithmic likelihood function (lt) of observation (yt) is:
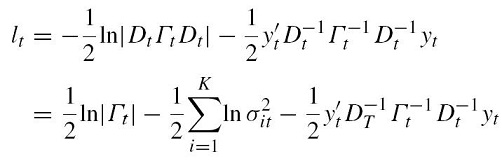
where the total number of parameters to be estimated is 3K+K(K+1)/2+2.
Information
Since the second semester of 2006, the global prices of the main foodstuff began to increase. For the first semester of 2008, the highest levels of the last 30 years were registered, despite the fact that they decreased the following year; prices are currently higher than the levels observed before 2006 (FAO, 2009).
In order to keep the increases of 2006 from affecting the results of the estimations, the analysis period comprises the period between the first week of 2007 up to the last week of 2012, as such there are 313 observations.
The prices of the futures contracts of US#2 grade yellow corn of the CBOT were obtained from the National Market Information System (SNIIM for its acronym in Spanish) of the Secretariat of Economy (SE); the future with expiration in March is used, basing the aforementioned in the “Theoretical foundations of corn” of the MexDer and the measurement unit is dollar per kilogram.
The main states for the production of corn in irrigation and temporary modality are shown below. The data were obtained during the harvest season of 2012 (Table 2).
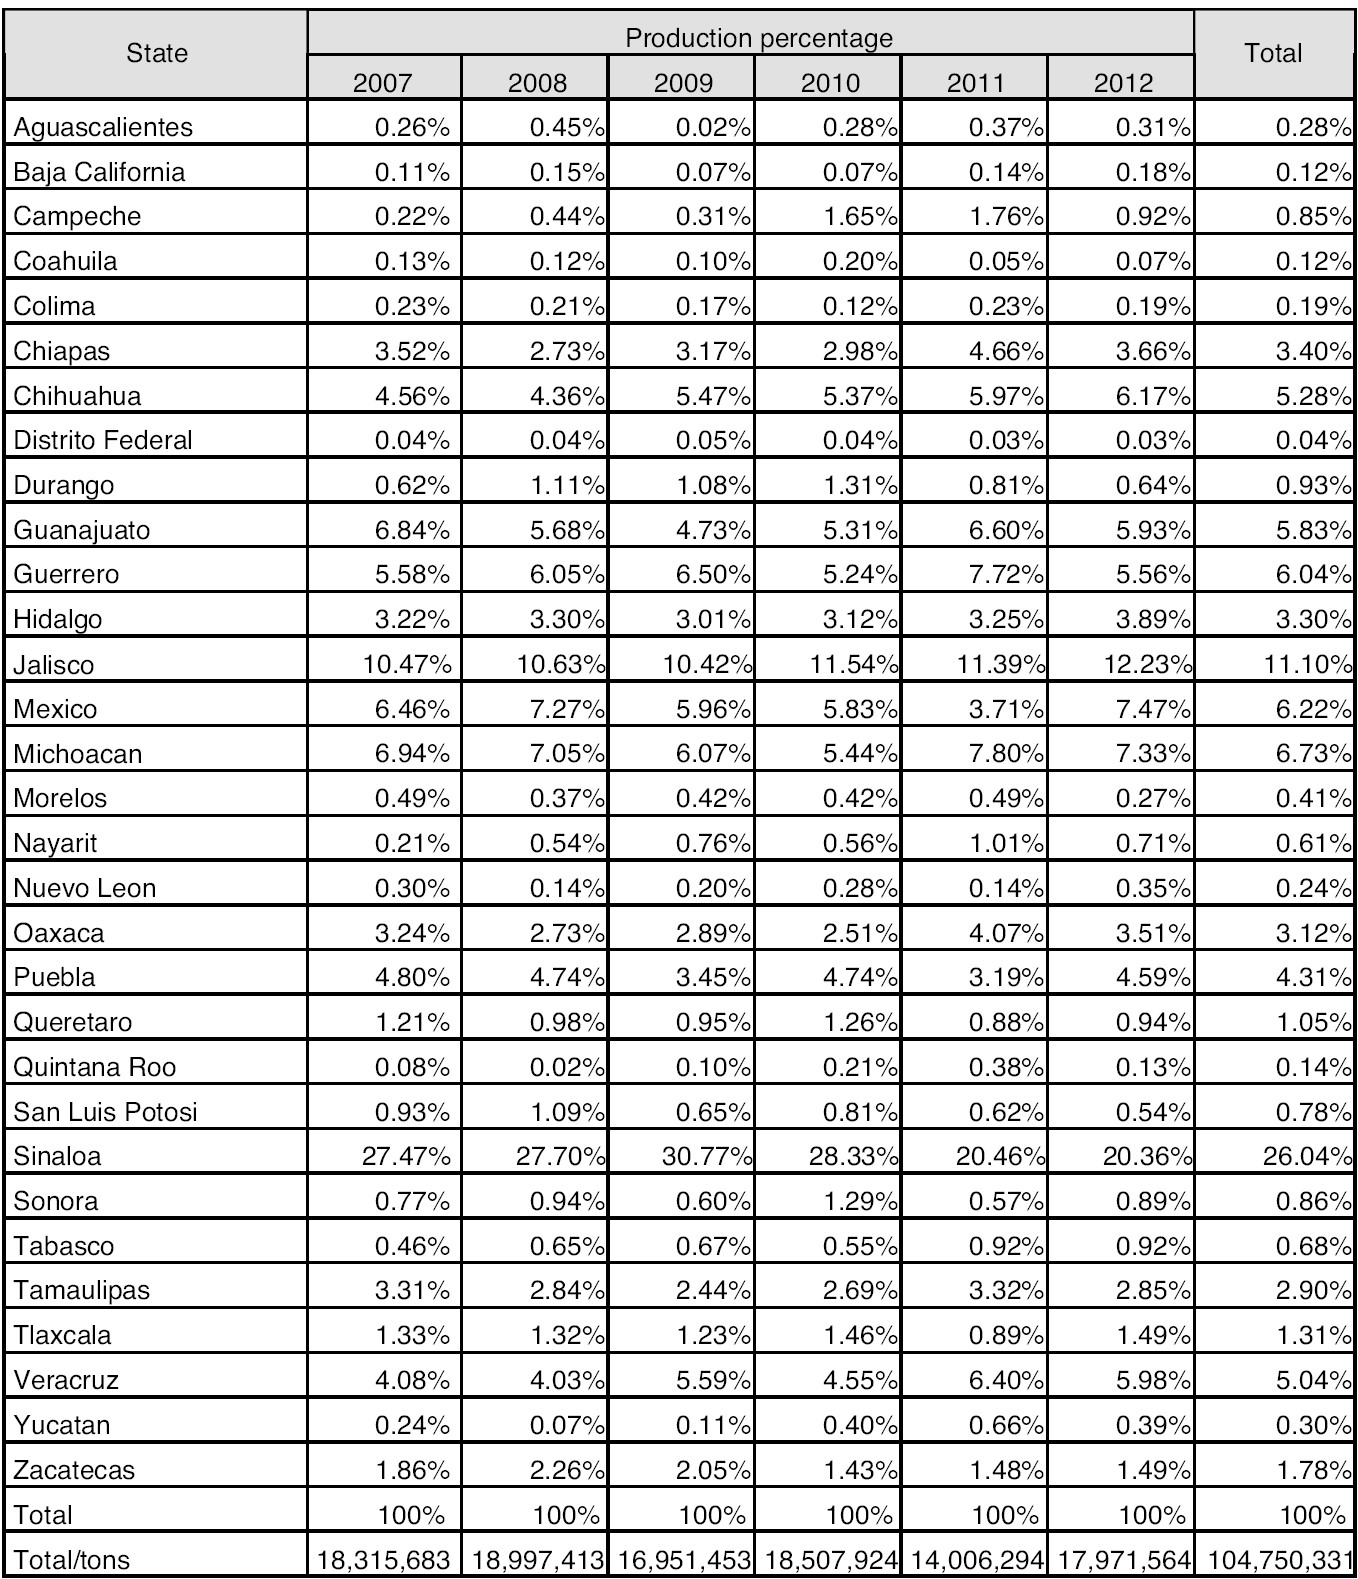
In the same way, to obtain the spot prices of Mexico, four states with high levels of corn production3 were selected in the SNIIM. It was verified that during the analysis period, ASERCA granted direct supports to price coverage for corn in the states of Jalisco, Mexico, Michoacán and Chihuahua. The prices of the SNIIM were obtained from the main Central Markets of each state, thus they are calculated in bulk per kilogram commercialized in bulks of 50 kg, and are the most frequent; statistically, the mode was used. To convert the spot prices to dollars, the fix exchange rate of the Bank of Mexico was used.4
To carry out the estimations of the econometric model, the Stata (MR) statistical program version 12 was used.
Analysis of the results
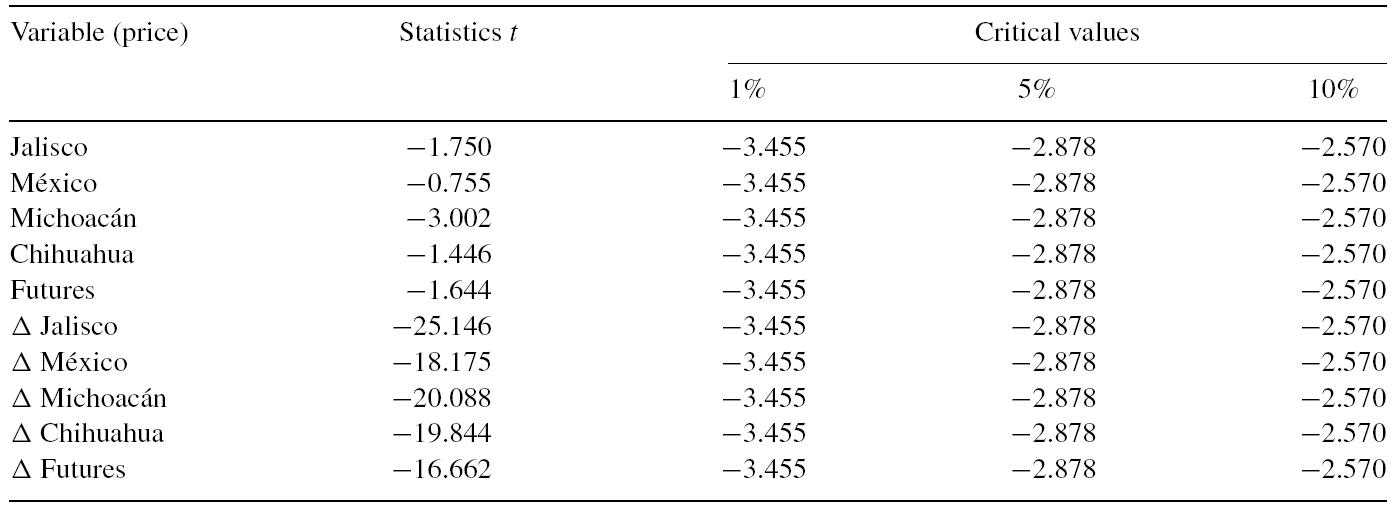
In order to be able to adequately study the addressed price series, it is necessary for these to be stationary. To verify the presence of stationarity the Dickey-Fuller augmented unit root test was utilized. It supports the following hypotheses:
H0. root
H1. There is no unit root
When conducting the unit root test at the level of all series, it was found that there is no sufficient statistical evidence to not reject the unit root null hypothesis; this means that the series is not stationary. As the time series theory cannot be applied to series that are not stationary it was necessary to apply the first-difference estimator, from which it was known that all the series were stationary. The results are shown in Table 3.
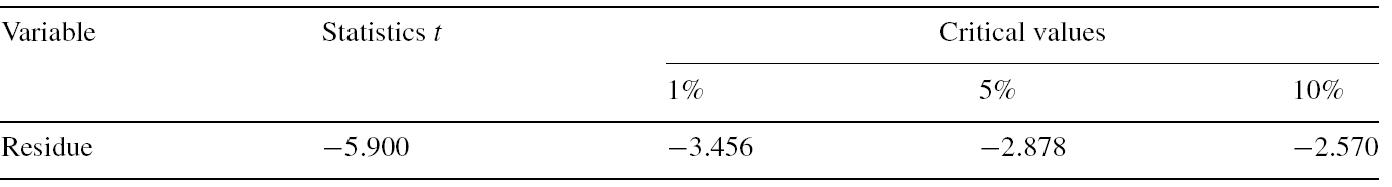
On the other hand, using the Engle-Granger test, which consists in carrying out an augmented Dickey-Fuller hypothesis test on the residues estimated through the regression of the already stationary variables, it is confirmed that the study variables are cointegrated (Table 4).
The AR and MA processes were identified by analyzing the correlograms of each series. None of the series presented stationarity. The statisticst for the five series show, with a 95% confidence level, that the autoregressive components with mobile and stationary measures are significantly different from zero and that the characteristic roots are invertible. For their part, the correlograms and the Durbin-Watson statistic indicate that the estimated coefficients are not correlated among themselves and are therefore stable.
If there is real simultaneity between a set of variables that represent the prices of corn, all of them should be treated equally and there should be no a priori distinction, as in the simultaneous equation models. The autoregressive term refers to the appearance of the lagged value of the right side dependent variable.
In the bivariate case, assuming causality between two variables and that each equation has lagged k values, each equation can be estimated by ordinary least squares in the following manner:
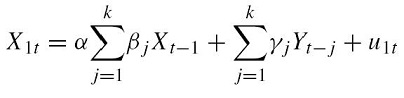
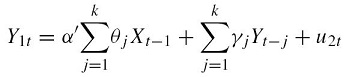
where the uit are the error terms, known as impulses, innovations or shocks.
The criteria to select the optimal order of lags were:
Akaike information criterion
Schwarz's Bayesian information criterion
Hannan-Quinn information criterion
Based on this, bivariate models were estimated according to the following considerations:
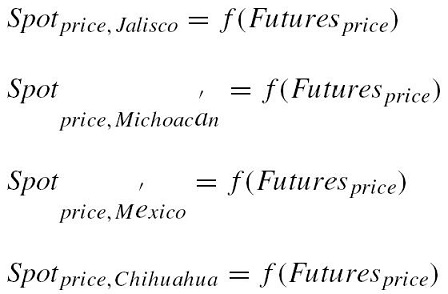
In this case, using the lags suggested by the information criteria, it can be observed (at a 95% significance level) that in the event of a shock, the prices of the futures market have very little influence on the spot prices of each state. Furthermore, it was confirmed that the intrinsic values fall within the unit circle and thus it is possible to state that the models are stationary.
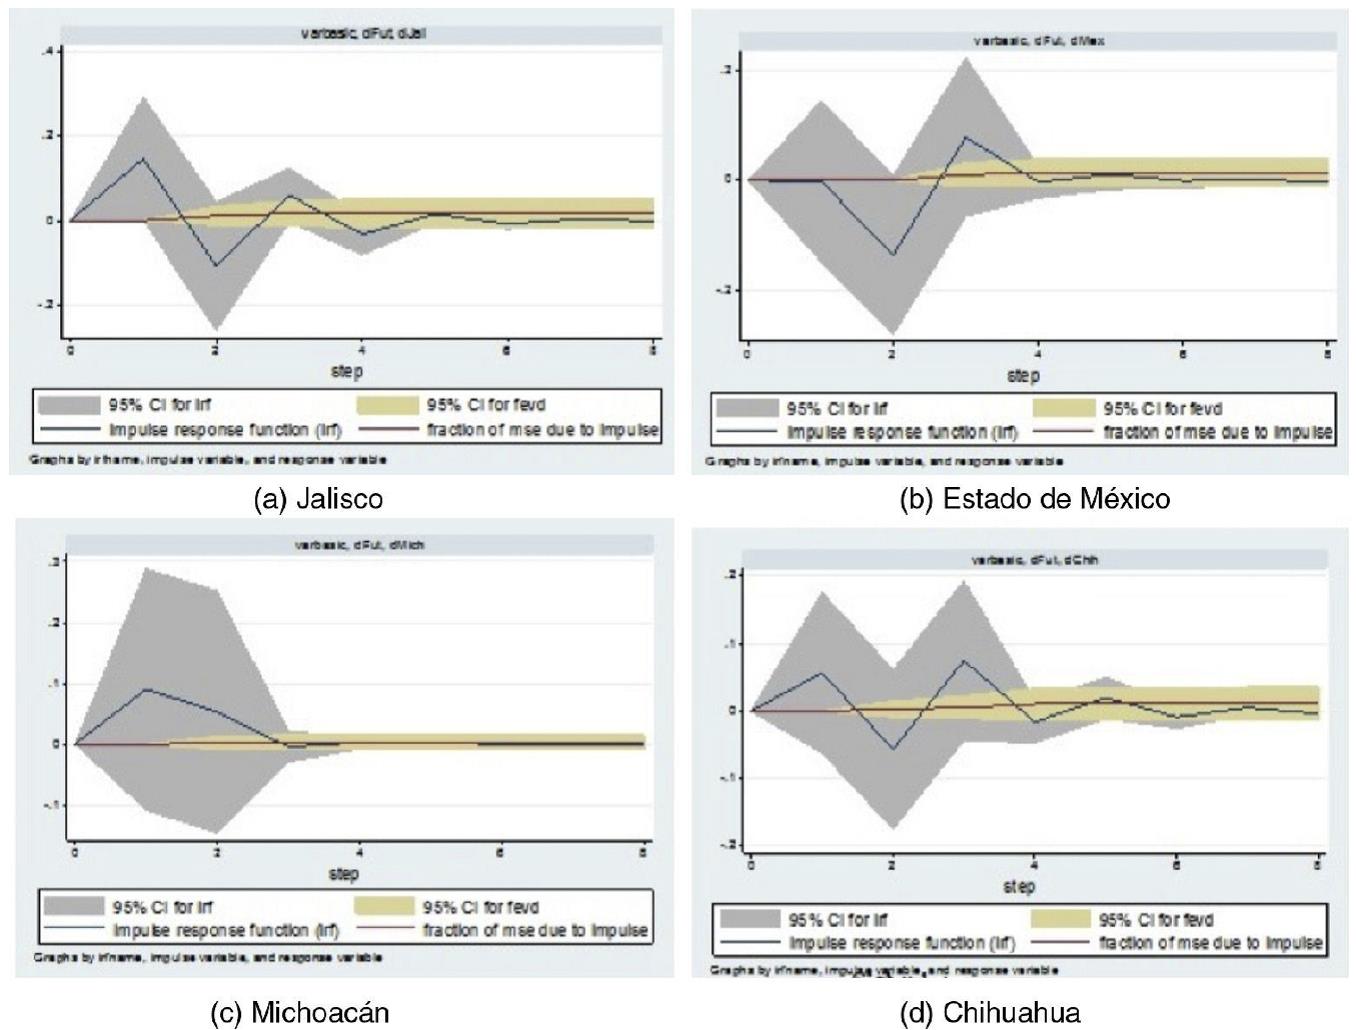
Table 5 shows the graphs of the impulse-response functions of the structural breakdown of the residues of the VAR. Graphs (a) and (d) represent the temporary effect of a disruption with a magnitude that is equivalent to a standard deviation at the middle level of each variable. Based on this, it is possible to interpret the nature of the impulses or shocks according to their signs. For the four analyzed cases: graphs (a), (b), (c) and (d) which correspond, respectively, to the effect of the shock due to the futures prices of the yellow corn of the CBOT on the domestic spot prices of white corn in the states of Jalisco, México, Michoacán and Chihuahua. The results obtained show that is possible to conclude that a shock that originates in the CBOT does not significantly affect the domestic spot prices of corn, so there is no interrelation between the futures variable of yellow corn and the national prices of white corn in the long term. The innovations from the CBOT do not show persistence either, the adjustment process is very fast. Particularly, for the relation of futures and spot prices, the variance breakdown indicates that the variations in futures prices from the CBOT do not affect the variations in the spot prices of the national variables.
Subsequently, it was necessary to confirm the presence of ARCH effects on the series. For this, the LM-ARCH heteroskedasticity contrast was applied to the residues of the ARMA estimations, which has the following hypotheses:
H0. There are no ARCH effects
H1.There are ARCH disruptions
The results obtained are shown in Table 6.
Table 6 LM-test for autoregressive conditional heteroskedasticity.
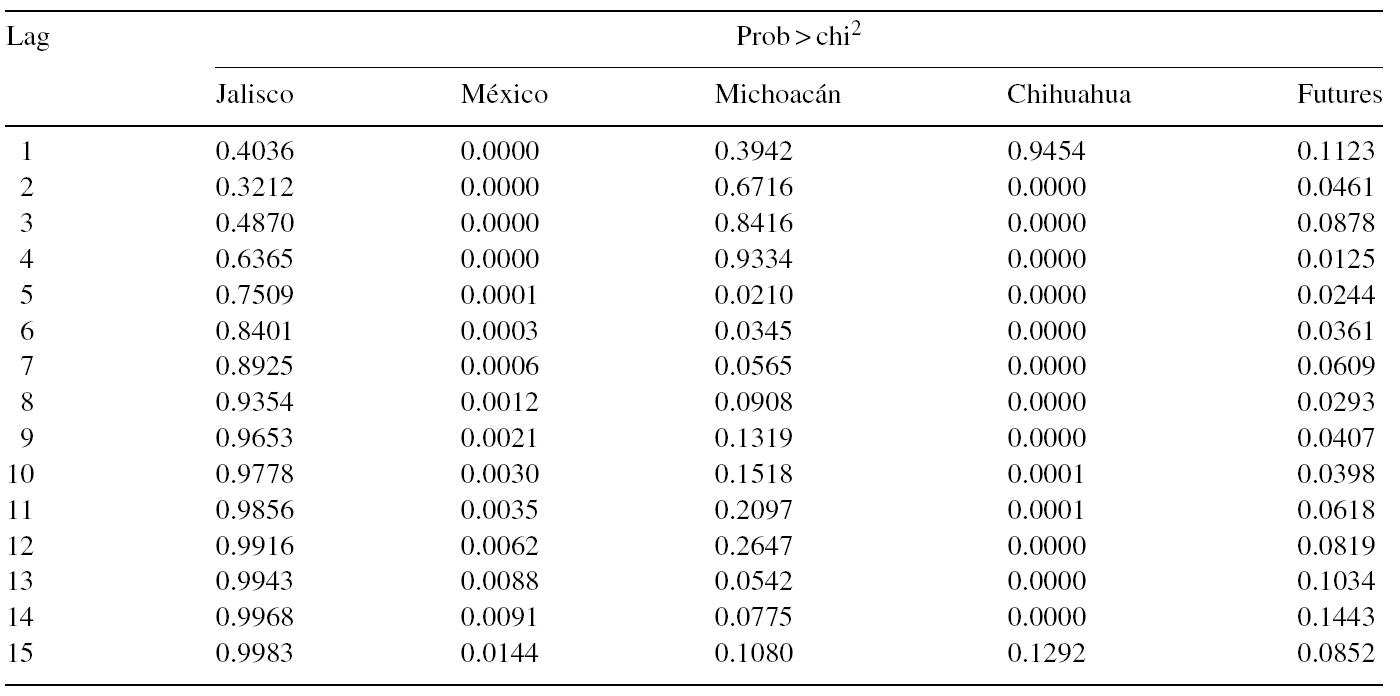
Source: Own elaboration with data from the SNIIM
From the coefficients obtained in the estimations, it is worth highlighting that in Michoacán there is volatility persistence in the event of a volatility shock.
From the estimations of the ARCH and GARCH models for the series of the State of Mexico, Michoacán, Chihuahua, and Futures the following results were obtained (Table 7).
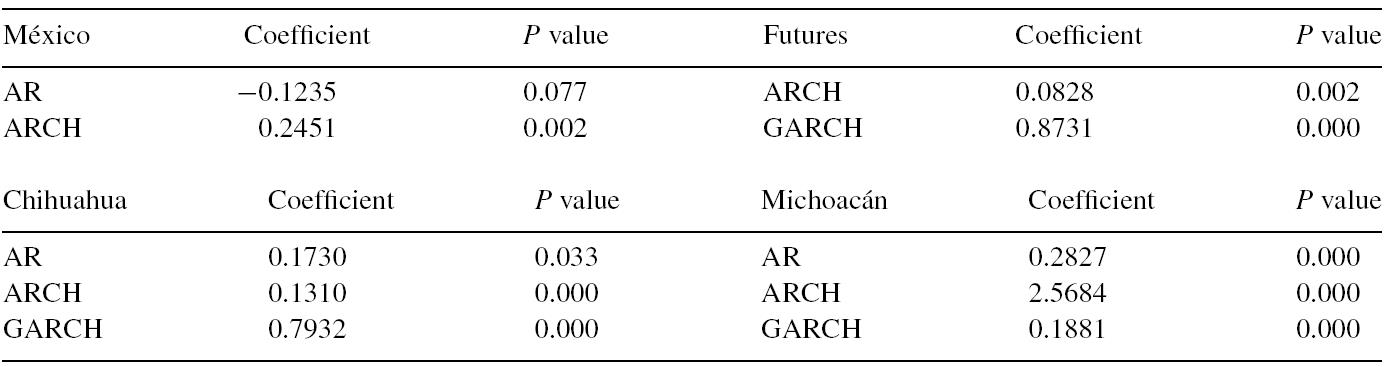
As shown in the results above, there is evidence of the presence of conditional heteroskedasticity in the residues of each price variable. Therefore, the GARCH models are convenient candidates for the modeling of the study variables, given their heteroskedasticity. Due to the fact that volatility in different markets moves jointly in time, it makes sense to carry out a multivariate analysis. This made it possible for us to more efficiently estimate the volatility leakage and the impact of the news in the determination of domestic spot prices.
The degree of interdependence between prices is captured through the Constant Conditional Correlation model, which shows that for the states of Michoacán and Chihuahua there are no correlations between the future price of yellow corn and the prices of white corn. This relation is only valid for the State of Mexico, however, though the correlation is statistically significant, it is very small; for each positive variation in the future price of yellow corn, the spot price of Michoacán registers a positive variation of 0.1360 (Table 8).
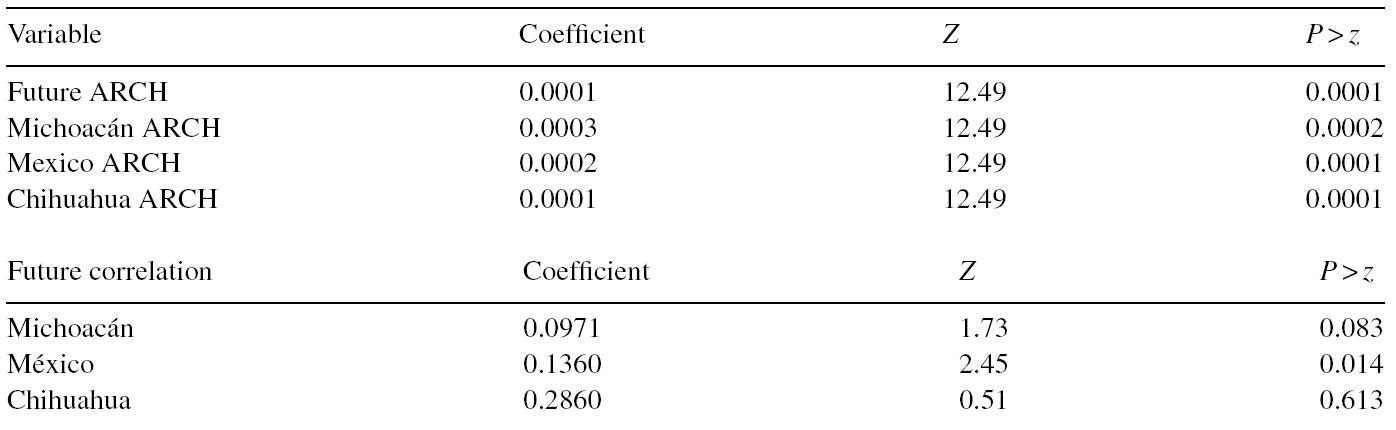
Volatility of this kind is understood as the conditional variance of the series, that is, short-term oscillations. Analyzing the variables of futures and spot prices as a system in which the variations of the prices of the others influence the variation of prices of each one, it is possible to appreciate, through the estimated ARCH parameters, that there is indeed a transmission of volatility from the rest of the variables to each of them; however, the volatility leakage is very small.
As mentioned in the previous section, the Dynamic Conditional Correlation model is a generalization of the Constant Conditional Correlation, and allows conditional correlations to vary in time. The θ1 and θ2 parameters are news and decline parameters, thus they show the effects of innovations in the conditional correlations as the time and its persistence in the market vary. Given that the news parameter has a value of 0.0271, whereas the decline parameter shows that there is persistence in the transmission of volatility with a value of 0.9265, both parameters become statistically significant, which can be appreciated in Table 9.
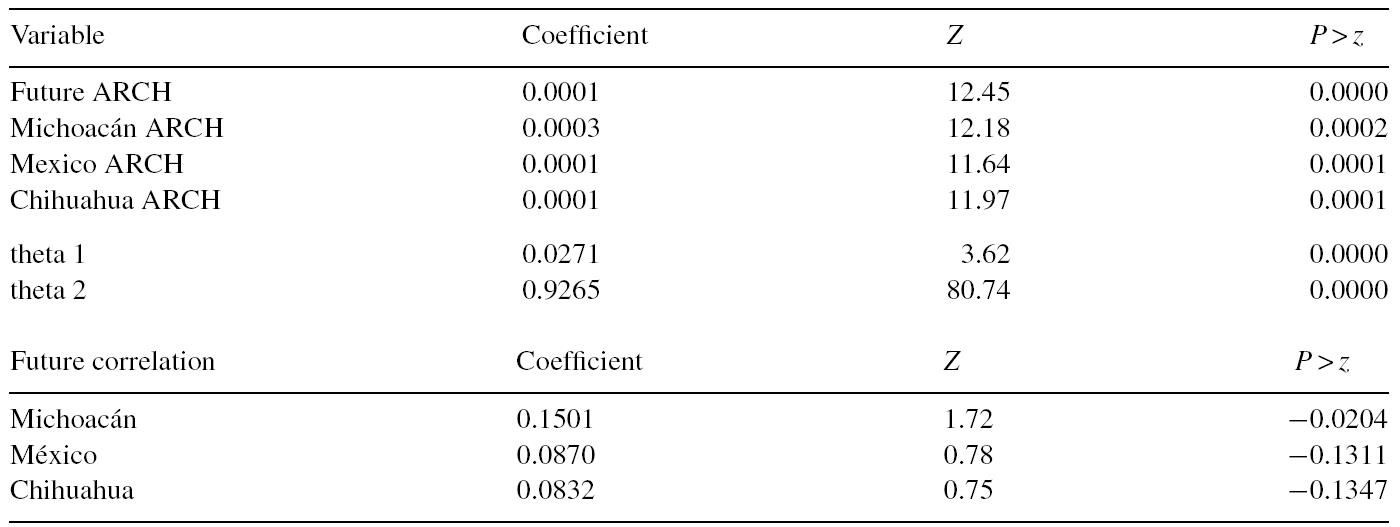
In the results of this model, the State of Mexico and Chihuahua variables do not show any correlation with the futures prices of the CBOT. The correlation coefficient of Michoacán shows that in the event of a positive variation in the future price of yellow corn, the spot price registers a positive variation of 0.1501.
In the case of the ARCH statistics, a volatility leakage of all prices can be observed, which when being analyzed as a system, the following results are obtained.
Given that the Varying Conditional Correlation Model is similar to the Dynamic Conditional Correlation model, the former was also used to compare results, which are shown in Table 10.
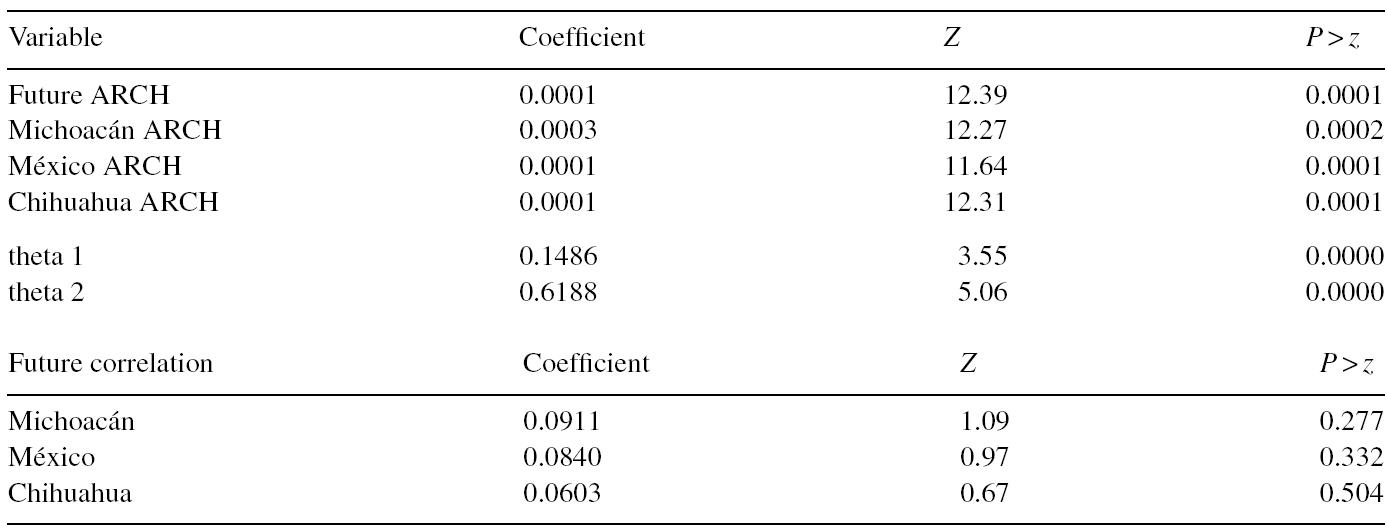
In this case, it is possible to appreciate the consistency with the results of the DCC model; the θ1 and θ2 parameters also show the effect of the innovations in the conditional correlations as time varies and due to its persistence in the market. Both parameters are statistically significant, and once again indicate that there is persistence in the transmission of volatility and in the decline with values of 0.1486 and 0.6188, respectively.
Regarding the correlations between the futures prices of yellow corn and domestic spot, the results are not statistically significant. This suggests that there is no relation of prices between the variables of national prices and the futures prices of the CBOT.
Finally, and in agreement with the CCC and DCC models, analyzing all the variables together, it can be seen that there are indeed effects in the transmission of volatility of all the variables to each of them, however, the volatility leakage is almost null.
Conclusions
In this investigation, the dynamic of the volatility between the price used as coverage by the Mexican producers of white corn and the one registered in the country is examined. Thus, four spot prices of white corn from the states of Jalisco, México, Michoacán, and Chihuahua and one from the CBOT (US#2 grade yellow corn) are analyzed.
Faced with the impossibility of having a futures market in Mexico and based on the matters addressed in the first section, the coverage of the price of corn should be competitive and provide security to the producer regarding their income.
According to the cross-correlation analysis, it is possible that there was a relation between the domestic spot prices and the futures price. However, in a first stage, it was observed that through the estimation of autoregressive vectors, a shock originating in the CBOT does not significantly affect the domestic spot prices. So, there is no interrelation between the future variable of yellow corn with the national white corn prices. The innovations from CBOT do not show persistence either, the adjustment process is very fast.
Although the spot prices of the Mexican market are incorporated to the futures prices of the CBOT (according to the Engle-Grange cointegration test), analyzing all the variables together, the results of the CCC, DCC and VCC indicate that there is indeed transmission of volatility in the prices, but the volatility leakage is too small.
When the degree of interdependence between the price volatilities of the markets was studied through the multivariate stochastic volatility analysis using the CCC, DCC and VCC models, the results of the estimations showed that the volatility of the agricultural futures market's price is not related to the volatility of the prices recorded in the states of Mexico and Michoacán, with the only state showing a small negative correlation being Chihuahua.
The individual coefficients of the ARCH equations of the three estimated models are statistically significant and indicate that the variance of the study variables does not only depend on its past information, but also on the shocks of the other prices considered in this investigation.
Derived from the results of the investigation, it is possible to accept the hypothesis that was presented, that is, that through the calculation of the degree of interdependence between the volatilities of the studied prices, it was inferred that the coverage of white corn prices offered by the ASERCA program is not efficient against the volatility of the futures prices of yellow corn.
In an international context, the price of corn may be negotiated in financial markets, where the prices of the product constantly vary. However, going by the results, it can be appreciated that the national price does not immediately incorporate such variations.
To make the price coverage proposed by ASERCA a real benefit for Mexican producers, it is necessary for the spot price to quickly take into consideration the movements of the prices that come from the CBOT.
If the prices of the futures market do not guide the national prices, then the coverage given through the ASERCA scheme is not the correct one. Considering this, a future investigation could analyze, on a first instance, the reason why the program has considerably increased the number of covered contracts, as the price coverage operates in parallel to other programs offered by ASERCA. On the other hand, if the price coverage presents a disadvantage by not correctly providing the services, then the investigation could aim to explain why Mexican producers of white corn request it.
Referencias
Asai, M., McAleer, M. y Yu, J. (2006). Multivariate stochastic volatility: A review . Econometric Reviews, 25(2.3), 145-175. http://dx.doi.org/10.1080/07474930600713564 [ Links ]
Apoyos y Servicios a la Comercialización Agropecuaria (ASERCA) (2012), Objetivo del programa, [En Red], Disponible en: Disponible en: http://www.aserca.gob.mx . [2014,30 de abril]. [ Links ]
Bawens, L., Laurent, S. y Rombouts, J. (2006). Multivariate GARCH models: A survey. Journal of Applied Econometrics, 21(1), 79-109. http://dx.doi.org/10.1002/jae.842 [ Links ]
Bawens, L. , Hafner, C. y Laurent, S. (2012). Handbook of volatility models and their applications”. New Jersey, EE. UU: John Wiley and Sons. [ Links ]
Bawens, L. , Hafner, C. y Pierret, D. (2013). Multivariate volatility modeling of electricity futures. Journal of Applied Econometrics, 28(5), 743-761. http://dx.doi.org/10.1002/jae.2280 [ Links ]
Bekiros, S. y Diks, C. (2008). The relationship between crude oil spot and futures prices: Cointegration, linear and nonlinear causality. Energy Economics, 30(5), 2673-2685. [ Links ]
Bollerslev, T. (1990). Modelling the coherence in short-run nominal exchange rates: A multivariate generalized ARCH model”. Review of Economics & Statistics, 72(3), 498-505. http://dx.doi.org/10.2307/2109358 [ Links ]
Brooks, C. (2008). Introductory econometrics for finance (2.a edición). Reino Unido: Cambridge University Press. [ Links ]
Broto, C. y Ruiz, E. (2004). Estimation methods for stochastic volatility models: A survey. Journal of Economic Surveys, 18(5), 613-649. http://dx.doi.org/10.1111/j.1467-6419.2004.00232.x. [ Links ]
CEDDRSSA. (2007). Centro de Estudios para el Desarrollo Rural Sustentable y la Soberanía Alimentaria. Ventajas viabilidad y requerimientos para la instalación de una bolsa de físicos agropecuarios en México. México: Distrito Federal, Cámara de Diputados. [ Links ]
Engle, R. (2002). Dynamic conditional correlation: A simple class of multivariate generalizedautoregressive conditional heteroskedasticity models”. Journal of Business & Economics Statistics, 20(3), 339-350. [ Links ]
FAO. Dirección de Comercio y Mercado de la Organización de las Naciones Unidas para Agricultura y la Alimentación. (2009). El estado de los mercados de productos básicos agrícolas 2009. Roma, Italia: Organización de las Naciones Unidas para Agricultura y la Alimentación. [ Links ]
Godínez, J. (2006). Causalidad del precio futuro de la bolsa de Chicago sobre los precios físicos del maíz blanco en México. Departamento de Estudios Económicos. [ Links ]
Hernández, M. y Ibarra, R. (2011). ¿Hasta dónde se transfieren los choques a través de las fronteras? Examinando la transmisión de volatilidad en los principales mercados de futuros agrícolas. México: Banco de México (documentos de investigación). [ Links ]
Karoyi, G. y Stulz, R. (1996). Why do markets move together? An investigation of US-Japan stock return comovements. The Journal of Finance, 51(3), 951-986. http://dx.doi.org/10.2139/ssrn.40556 [ Links ]
Ledebur, O. y Schmitz, J. (2009), Corn Price behavior: Volatility transmission during the boom on future markets 113 Seminario de EAAE. [ Links ]
Longin, F. y Solnik, B. (1995). Is the correlation in international equity returns constant: 1960-1990? Journal of International Money and Finance, 14(1), 3-26. http://dx.doi.org/10.1016/0261-5606(94)00001-h [ Links ]
Nieto, B., Oribe, S. y Zarraga, A. (2011).Time-varing beta estimators in the Mexican emerging market. Working paper. [consultado 10 Ene 2015]. Disponible en: Disponible en: http://hdl.handle.net/10810/5283 [ Links ]
Ochoa, R. (2011a). El futuro de los alimentos: de tendencias y cuestiones claves, en un contexto de crisis económica y volatilidad de los precios. Claridades Agropecuarias, (219), 6-17. [ Links ]
Ochoa, R. (2011b). Cobertura de precios de productos agropecuarios.Claridades Agropecuarias, (220). [ Links ]
Philipov, A. y Glickman, M. E. (2006). Multivariate stochastic volatility via Wishart. Journal of Business & Economics Statistics, 24(3), 313-328. [ Links ]
Rapsomanikis, G. (2011). Price transmission and volatility spillovers in food markets. En A. Prakash (Ed.), Safeguarding food security in volatile global markets. Rome: FAO. [ Links ]
Ruíz, E. y Veiga, H. (2008). Modelos de volatilidad estocástica: una alternativa atractiva y factible para modelizar la evolución de la volatilidad. Anales de Estudios Económicos y Empresariales, 18(2008), 9-68. [ Links ]
Secretaría de Agricultura, Ganadería, Desarrollo Rural, Pesca y Alimentación (SAGARPA). (2012). Lanzan primer contrato de futuros de maíz en México. México: Comunicado de prensa. [ Links ]
Shawky, H., Marathe, A. y Barrett, C. (2003). A first look at the empirical relation between spot and futures electricity prices in the United States. The Journal of Futures Markets, 23(10), 931-955. http://dx.doi.org/10.1002/fut.10093 [ Links ]
Servicio de Información Agroalimentaria y Pesquera (SIAP). (2012). Situación actual y perspectivas del maíz en México. pp. 1996-2012. [ Links ]
Soriano, P. (2004). Transmisión de volatilidad entre mercados financieros. Madrid: Universidad Complutense de Madrid (Trabajo de investigación del programa de doctorado interuniversitario en finanzas cuantitativas). [ Links ]
Soriano, P. y Climent, F. (2006). Volatility transmission models: A survey.Revista de Economía Financiera, 2006(10), 32-81. http://dx.doi.org/10.2139/ssrn.676469. [ Links ]
Tsay, R. (2005). Analysis of financial time series (2.a ed.). Estados Unidos: Editorial Wiley-Interscience. [ Links ]
Tsay, R. (2010). Analysis of financial time series (3rd. ed.). New Jersey, EE. UU.: John Wiley and Sons. [ Links ]
Tsay, Y. y Tsui, A. (2001).A multivariate GARCH model with time-varying correlations”. Departmentof Economics, National University of Singapore. [ Links ]
Received: June 29, 2015; Accepted: January 07, 2016
 Este es un artículo publicado en acceso abierto bajo una licencia Creative Commons
