


 nueva página del texto (beta)
 Inglés (pdf)
 Artículo en XML
 Referencias del artículo
 Enviar artículo por email
 Citado por SciELO
  Similares en
SciELO
Similares en
SciELO 
 Permalink
Introduction
Most firms come across financial needs that can be satisfied using equity or using debt. Decisions about which source of funding to be used or their ratio is one of the issues of great importance and has generated great controversy in recent decades. At the core of the problem are two streams, the traditionalist defense of an optimal capital structure that leads to maximizing the firm's value and the theory of irrelevance of capital structure, defended by Modigliani and Miller (1958) , which considers that the value of the firm is not affected by the way it is financed.
Underlying this discussion researches were developed focusing on looking for aspects that explaining the ways of financing of firms, leading to the emergence of new theories and new determinants of debt factors. The definition and choice of the determinants noteworthy because it lets you know what is the impact of certain decision-making on the capital structure and the value of the firm. Although there is continuity in theoretical development, the results obtained in empirical studies on the determinants of debt factors have shown little homogeneity, suggesting that this issue lacks theoretical and empirical research.
Contextual framework
The capital structure reflects the composition of the source of funds whether using the equity whether debt capital ( Esperança & Matias, 2010 ), i.e., firms can finance their assets with equity, with debt or with both. Brandão (2003, p. 218) attaches great importance to capital structure in that: “the composition of funding sources, including equity and debt, can influence the value of the firm”. The optimization of the relative importance of the debt in relation to equity, in order to maximize the firm's value, is the main structural decision in financial management of a firm ( Mota, Barroso, Nunes, & Ferreira, 2012 ). However, Brealey, Myers, and Allen (2007) warn that sometimes the purpose of financing decisions may not be to maximize the overall value of the firm, but to minimize the weighted average cost of capital. If the operating results are not constant, the capital structure that maximizes the value of the firm cannot reduce the weighted average cost of capital.
Managers, when making funding decisions, should worry to gather funding sources that achieve the optimal capital structure. As argued by Smith (cited by Teixeira, 2012 , p. 4), “the choice of the sources and types of capital should be evaluated in relation to the level of flexibility in terms of access, deadlines, amounts and costs for the firm, in order to select the most advantageous solution in terms of profitability and particular risk for the firm”. All these problems associated with the divergence of views on the existence of an optimal capital structure led to the emergence of various theories on the subject, as well as several empirical studies.
The traditional approach represented in part by Durand (1952) , defends the existence of an optimal capital structure for each firm, based on the debt level changes the value of the firm and establishing a relation between the degree of the firm's indebtedness and equity, i.e. the cost of capital can be influenced by financial structure.
In the late 1950, Modigliani and Miller contributed to a different view on the problem of capital structure contrasting the traditional theory. The model developed by Modigliani and Miller (1958) is based on a perfect capital market and concludes that the cost of capital is independent of the firm's debt level, denying the existence of an optimal capital structure and advocating the firm's value is independent from the capital structure. Later, Modigliani and Miller (1963) corrected the model, including the effect of tax on business income. It was recognized that the use of debt provide a tax benefit due to the resulting savings in interest payments and, consequently, can increase the value of the firm.
Miller (1977) had in consideration not only the tax on business income, but the tax on personal income. While investigating this situation found that, on the one hand, the resulting debt interest are deductible from taxable income and, on the other hand, are considered income by creditors, which are subject to tax on personal income and can thus result in the annulment of the tax effect. Thus, the tax benefit from the financial leverage may not be relevant in maximizing the firm's value. The debt is only advantageous if sufficient results to benefit from the deductibility of interest, otherwise reduces the value of the firm.
The level of indebtedness of the firms can also be influenced by agency costs caused by conflicts of interest between the key actors involved in the firm. Jensen and Meckling (1976) identified two types of conflict, between capital owners and managers, and between managers and creditors. Jensen (1986) and Stulz (1990) argued that the conflict of interest between capital owners and managers, generated by the excess cash flow can be minimized with recourse to debt. The excessive use of debt can cause financial difficulties, increasing the risk of insolvency and in costly conflicts among agents interested in the firm ( Pinho & Tavares, 2012).
The insolvency situation can arise with increasing financial difficulties preventing the firm to meet its financial commitments to creditors. The probability of a firm's insolvency is greater the higher the degree of indebtedness ( Scott, 1976). Warner (1977) identified the insolvency costs as direct and indirect. This evidence suggests an inverse relation between the market value of firms and the value of the direct costs of insolvency, i.e., smaller firms have higher direct costs of insolvency. For Altman (1984) indirect insolvency costs can have a significant impact on the capital structure.
Another widely debated area is the asymmetric information. Arose due the fact that managers may have information about firm's policies, including investment opportunities that other agents interested in the firm do not possess. According to Ross (1977) , managers, in defining the capital structure of your firm, are transmitting a signal to investors about the financial standing of the firm.
Based on the study of Myers and Majluf in 1984 on information asymmetry, Myers (1984) proposed the pecking order theory. According Brealey et al. (2007) , this theory explains why the most profitable firms use less recourse to debt, it should be such that not to obtain lower debt ratios, but to have sufficient internal funds available to finance their projects. Firms with high levels of profitability and limited investment opportunities, tend to have low debt ratios, using more debt when investment opportunities outweigh the funds generated internally ( Myers, 1984).
Determinants of debt
Among the many financial decisions that managers faced are those related with capital structure. These decisions may be conditioned by various determinants that have been the subject of several studies over the past decades supported by various financial theories. Also several empirical studies have provided further support to the results obtained by theoretical models, as well as the emergence of new determinants of debt.
Under the insolvency costs, was defended by Scott (1976) that the level of debt is related to the size of the firm. The larger firms that have assets and higher results are subject to minor financial difficulties and, therefore, lower costs of insolvency, better access to debt and the more favorable conditions in the long-term. Warner (1977) revealed that smaller firms support higher insolvency costs. Several empirical studies have found a positive relation between size and debt ( Cardoso, 2011; Ferri & Jones, 1979; Oliveira, 2012; Rajan & Zingales, 1995; Vieira & Novo, 2010 ), however Titman and Wessels (1988) found a negative relation.
Growth is considered a determinant of capital structure, according to the theory of agency costs and the pecking order theory. Jensen (1986) and Stulz (1990) argued that recourse to indebtedness of firms, with low growth and high cash flows, can serve as a mediator of the conflict between capital owners and managers. Firms prefer internal financing, however this may not be enough to finance the respective growth, particularly in firms with high growth rates. Myers (1984) argued that the funds generated internally by the firms are not sufficient to finance the respective growth. The positive results obtained by Toy, Stonehill, Remmers, Wright, and Beekhuisen (1974) , Jorge and Armada (2001) and Brito, Corrar, and Batistella (2007) indicate that the higher the growth greater recourse to indebtedness.
In the field of theory of asymmetric information, Leland and Pyle (1977) argued that firms with more volatile earnings could present smaller debt ratios, once the risk of failing to fulfill their obligations may be higher, resulting in elevated asymmetries of information. The increased business risk may also result in increased insolvency costs and agency cost, leading the firms to resort less debt. Toy et al. (1974), Brito et al. (2007), Couto and Ferreira (2010) and Oliveira (2012), unlike Bradley, Jarrel, and Kim (1984) showed a positive relation between business risk and debt.
Another factor that can influence the firm capital structure is the profitability. Relating to the theory of tax effect, DeAngelo and Masulis (1980) argued that the most profitable firms, because of their ability to benefit from higher tax deductions related to debt, debt should be more. Ross (1977) admitted that greater use of debt can transmit a positive signal about the profitability of the firm. Myers (1984) and Myers and Majluf (1984) reported that, firms prefer self-financing and, only after, issuance of debt, i.e. the greater the higher profitability will be internally generated funds and lower the use of debt, as described in the pecking order theory. This negative relation was found in empirical studies as Toy et al. (1974), Rajan and Zingales (1995), Vieira and Novo (2010), Cardoso (2011) and Oliveira (2012).
The tangibility or, as considered by some authors, the composition of the assets, according to the theory of tax effect, limits the ability to use the tax benefit resulting debt. The higher the value of the tangible assets the higher the value of depreciation and its benefit in fiscal terms and, consequently, lower the use of tax deductibility of interest on the indebtedness. In the theoretical line of agency costs, Scott (1976) and DeAngelo and Masulis (1980) argued that firms may resort to higher debt levels the greater the guarantees on assets, primarily long-term in proportion to their tangible assets. Studies of Rajan and Zingales (1995), Couto and Ferreira (2010), Vieira and Novo (2010) and Oliveira (2012) presented empirical evidence of a positive relation between tangibility and debt.
The non-debt tax shields, including depreciation of assets and investment tax credits are considered by DeAngelo and Masulis (1980) as substitutes for tax benefits relating to debt. The increase in these benefits can have a negative impact on debt ( Couto & Ferreira, 2010; Oliveira, 2012 ) and, consequently, a decrease in interest and its tax benefit as proposed by the theory of tax effect.
Sample
Small and medium enterprises play a highly important role in the Portuguese economy. Most studies on the capital structure have been dedicated to large firms and greater focus on publicly traded firms. However, the Portuguese business community and in particular the business community of the Santarém's district, consists mainly of small and medium enterprises.
The Santarém's district reveals great importance to economic and enterprise level within the Portuguese national economy. This district is characterized by a vast forest surface and high agricultural productivity due to its floodplains and is even considered as the agricultural capital of Portugal. Its strategic location provides the development of agro-food industry, to highlight the Sugalidal group which in 2012 was considered the second largest producer of tomato concentrate worldwide ranking of “TomatoLand”, wood and furniture industry and tanning industry.
The report published by the Sociedade Portuguesa de Inovação (2010) attaches particular importance to the agricultural sector, the agroindustry sector, the automobile sector, the tanneries and textiles sector, noted that 80% of national tanneries firms are in the district of Santarém, the sector of forestry, which holds 27% of cork production and 10% of the production of wood and resin, the wood industry, furniture and paper, the construction sector, the sector of mineral non-metals, the services sector with greater relevance to the trade activities related to tourism, transport and distribution and the environmental sector/waste treatment.
The sample selected for this empirical study was constituted by non-financial firms in the Santarém's district. Secondary data was obtained from the database of Iberian Balance Sheet Analysis System (SABI). The sample contains data for a time horizon of five years (2008-2012) include 6184 non-financial firms, distributed on average as shown in Table 1 , the following categories, according to the Commission Recommendation 2003/361/EC: 14 large firms, 139 medium firms, 1034 small firms and 4997 micro firms.

The sample distribution by economic activity sectors, represented in Table 2 , indicates that about 33% of the firms belong to the trade sector wholesale and retail trade, repair of motor vehicles and motorcycles. The manufacturing industries, construction and agriculture, animal husbandry, forestry and fisheries represent about 31%, the remaining sectors are less significant.
Table 2: Sample distribution by economic activity.
| Sector of economic activity | Firms | % | |
|---|---|---|---|
| Wholesale and retail trade; repair of motor vehicles and motorcycles | 2033 | 32.90 | |
| Manufacturing | 820 | 13.30 | |
| Construction | 665 | 10.80 | |
| Agriculture, livestock, hunting, forestry and fishing | 452 | 7.30 | |
| Transport and storage | 429 | 6.90 | |
| Consulting activities, scientific, technical and similar | 415 | 6.70 | |
| Accommodation, catering and similar | 411 | 6.60 | |
| Human health activities and social support | 282 | 4.60 | |
| Administrative activities and support services | 138 | 2.20 | |
| Real estate activities | 132 | 2.10 | |
| Other service activities | 100 | 1.60 | |
| Education | 61 | 1.00 | |
| Activities of information and communication | 60 | 1.00 | |
| Artistic activities, shows, sports and recreation | 59 | 1.00 | |
| Financial and insurance activities | 57 | 0.90 | |
| Extractive Industries | 43 | 0.70 | |
| Collection, purification and distribution of water; sewerage, waste management and remediation activities | 21 | 0.30 | |
| Electricity, gas, steam, hot and cold water and cold air | 6 | 0.10 | |
| Total | 6184 | 100.00 | |
Source: Own elaboration.
Methodology
The research strategy adopted is based on a longitudinal study, using secondary data and the type of correlational research/explanatory. The model follows a panel data approach, containing financial information for examining the relation between dependent variables and independent variables. It consists of a set of three multiple linear regressions analyzed separately, as they are used three debt indicators. This model follows a similar approach to other authors.
Statistical analysis is performed using the method of generalized least squares, panel data treatment and to refuse the package SATA v.12.
The autoregressive model considered is the following:
where
Y i,t = firm debt as i in year t;
β 0 = constant;
β k = parameter estimated by the model;
X = vector of the explanatory variables;
ε i,t = random error.
The vector of explanatory variables includes K factors, (K = 1, …, 6), which follow:
(1) size;
(2) growth;
(3) business risk;
(4) profitability;
(5) tangibility;
(6) non-debt tax shields.
The dependent variables related to the capital structure of the firms are financial indicators of indebtedness calculated from accounting data. Use three indicators ( Table 3 ) representative of short-term debt, medium and long term debt and total debt. These indicators were also used separately by some authors as: Jorge and Armada (2001), Brito et al. (2007) and Couto and Ferreira (2010).
Table 3: Dependent variables.
| Dependent variable | Indicator |
|---|---|
| Total Debt | Y1 - Total Debt/Total net Assets |
| Medium and Long-term Debt | Y2 - Long-term Debt/Total net Assets |
| Short-term Debt | Y3 - Short-term Debt/Total net Assets |
Source: Own elaboration.
The independent variables may be determinants of debt, reflected in the respective capital structure of firms. The choice of indicators to measure the independent variables was based on the chosen in Portuguese studies previously conducted and then in foreign works. As indicators of independent variables considered were those shown in Table 4 and described below.
Table 4: Independent variables.
| Independent variable | Indicator | ||
|---|---|---|---|
| Size | X1 - Number of Workers | X2 - Ln (Total net Assets) | X3 - Ln (Turnover) |
| Growth | X4 - Growth rate of Total net Assets | ||
| Business Risk | X5 - Coefficient of variation of EBIT | X6 - Standard deviation of Turnover | X7 - Standard deviation of EBIT |
| Profitability | X8 - EBIT/Total net Assets | ||
| Tangibility | X9 - Tangiblel Assets/Total net Assets | X10 - Intangiblel Assets/Total net Assets | |
| Non-debt Tax Shileds | X11 - Depreciation and Amortization of Exercise/EBITDA |
Source: Own elaboration.
Three indicators were used to analyze the variable size. The number of workers referenced in the work of Titman and Wessels (1988), Jorge and Armada (2001) and Couto and Ferreira (2010) , the logarithm of total net assets and logarithm of turnover, as shown in the studies of Titman and Wessels (1988), Rajan and Zingales (1995), Brito et al. (2007), Vieira and Novo (2010), Cardoso (2011), Junior (2012) and Oliveira (2012).
The variable growth was measured using the growth rate of total net assets, as Titman and Wessels (1988), Jorge and Armada (2001), Couto and Ferreira (2010), Vieira and Novo (2010) and Junior (2012) annually calculated as follows1:
Like authors such as Ferri and Jones (1979), Jorge and Armada (2001), Couto and Ferreira (2010) and Junior (2012) , to analyze the variable business risk, indicators were used: coefficient of variation of EBIT,2 standard deviation of turnover and standard deviation of EBIT, calculated as follows:
 (3)
(3)
where
t = year;
n = number of observations (5 years);
rt=EBIT in year tTNA in year t ;
Where
x t and x t−1 - turover in years (t) and (t − 1) respectively;y t and y t−1 - EBIT in years (t) and (t − 1) respectively;
σ - standard deviation.
Profitability, to analyze this variable, although some authors have used as an indicator operating income or profit, Portuguese studies as Jorge and Armada (2001), Cardoso (2011) and Junior (2012) present the following indicators:
For the tangibility variable, studies such as Titman and Wessels (1988), Jorge and Armada (2001), Couto and Ferreira (2010) and Cardoso (2011) have chosen to use two indicators to measure the extent to which the tangible and intangible assets can serve as a guarantee to creditors, so the indicators are:
The choice of indicator that serves to measure the variable non-debt tax shields followed an approach similar to Jorge and Armada (2001), Couto and Ferreira (2010) and Junior (2012), with the indicator:
Research hypotheses
Based on the theories and empirical studies on capital structure, previously reported, and in order to verify the relation between the determinants of debt and the level of indebtedness of the firms the following hypotheses were formulated:
H1: There is a positive relation between firm size and total debt.
H2: There is a positive relation between firm size and the long-term debt.
H3: There is a negative relation between firm size and the short-term debt.
H4: There is a positive relation between growth and debt.
H5: There is a negative relation between business risk and debt.
H6: There is a negative relation between profitability and debt.
H7: There is a positive relation between tangibility and total debt.
H8: There is a positive relation between tangibility and long-term debt.
H9: There is a negative relation between tangibility and short-term debt.H10: There is a negative relation between the non-debt tax shields and the debt.
Table 5 , shown below, summarizes the expected relations, according to the hypotheses, among the selected debt ratios and the potential determinants of debt.

Teste statistics
As stated Couto and Ferreira (2010) , the generalized least squares method, it is assumed that the errors are randomly distributed with a Gaussian density function, and homoscedastic non-autocorrelated, which allows to obtain not skewed and consistent estimators.
Statistical analysis can be performed by ordinary least squares model (OLS), the fixed effects model (FE) or random-effects model (RE). In the fixed effects model to estimate it is made assuming that the heterogeneity of individuals is captured in the constant part, maintaining the assumption of homogeneity of observations. The random effects model considers the constant term not as a fixed parameter, but as an unobservable random parameter ( Couto & Ferreira, 2010).
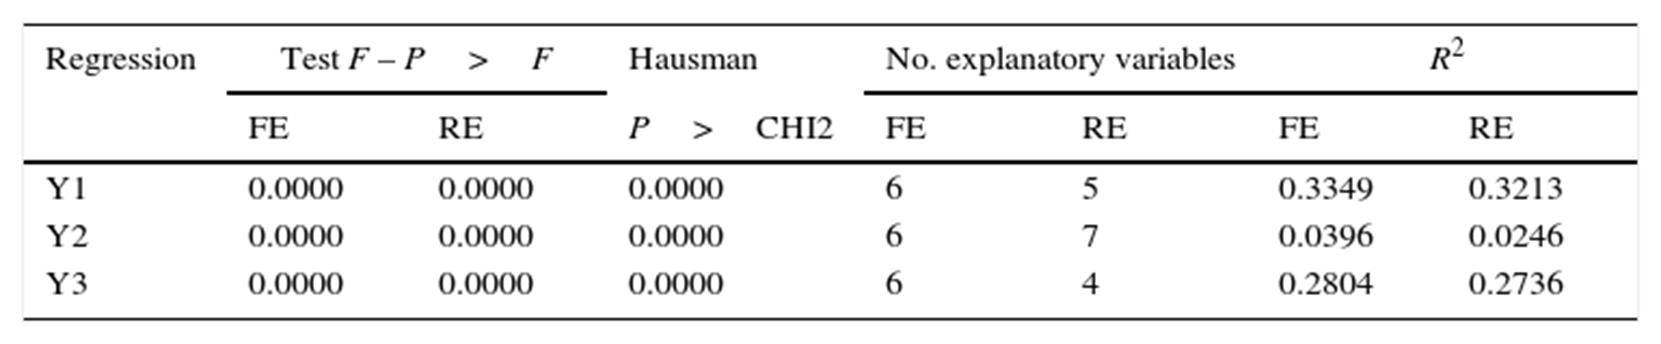
The choose of the right model was made using the F -Statistic and Hausman statistics. The F -statistic is a test of global adherence and indicates the reliability of model used. The Hausman statistic is a test that allows you to decide which model is more appropriate. Both tests show statistically significant results in all regressions ( Table 6 ), so the most appropriate model is the fixed effects model.
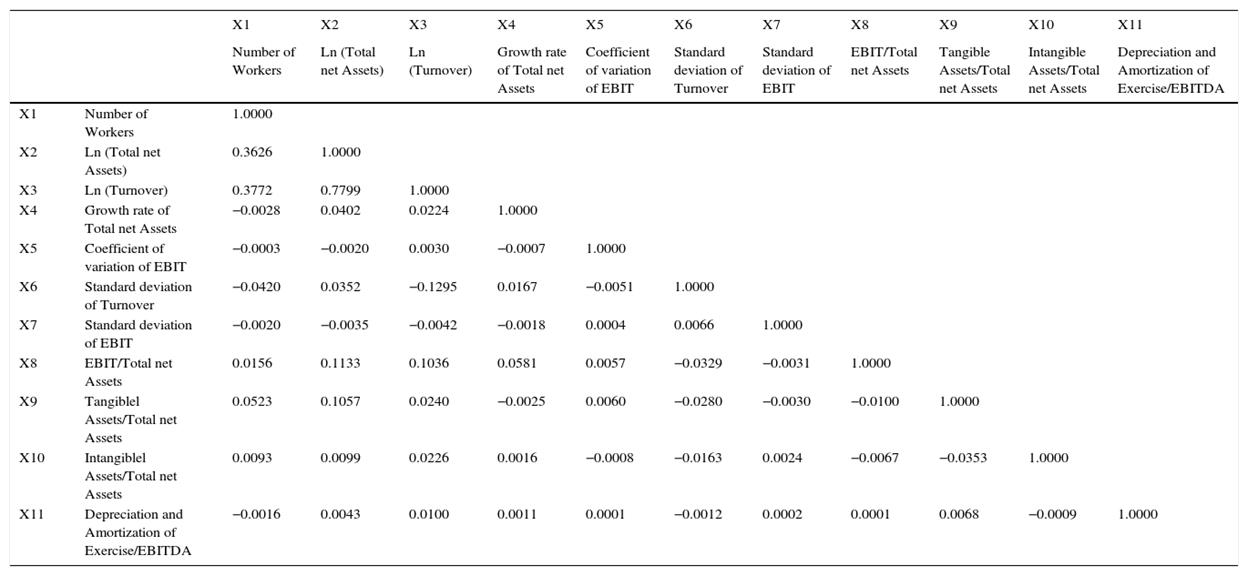
The presence of multicollinearity was evaluated by means of the correlation matrix of independent variables ( Table 7 ). The correlation matrix shows that in general the independent variables are not highly correlated, except for: X3 Ln (turnover) with X2 Ln (total net assets).
Results
Based on descriptive statistics (Table 8 ), it turns out that the average debt stands at 74%. The firms of Santarém's district, in general, have more debt in the short-term (52%) than the medium and long term, confirming the evidenced in the work of Jorge and Armada (2001), Brito et al. (2007) and Vieira and Novo (2010).
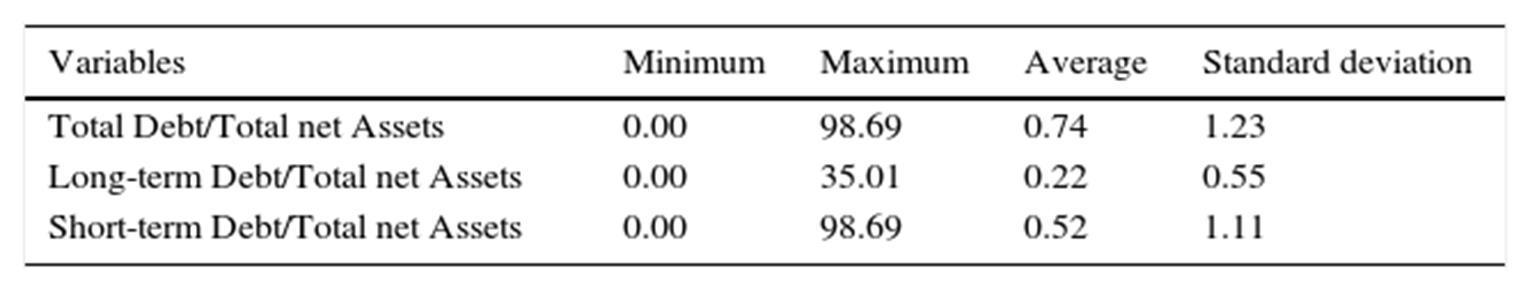
The short-term debt is essentially banking, which may be a reflection of low guarantees offered and lack of access to capital markets ( Vieira & Novo, 2010). It is referred by Jorge and Armada (2001) , that the fact that short-term debt average is more than twice the average indebtedness of medium and long term can be associated with a greater confidence on the part of firms in the banking system, to the detriment of the capital market.
The results obtained from the regression models for each dependent variable, total debt (Y1) ( Table 9 ), medium and long term debt (Y2) ( Table 10 ) and short-term debt (Y3) ( Table 11 ) allow to observe the level of determining factors of the debt resulting from regressions performed.


The Y1 regression (Total Debt/TNA), for the total debt, explains about 33% of the model. It is noted that the size, growth and profitability influence the level of total debt, although the size when measured by the indicator number of workers is less significant. Business risk is also statistically significant when measured through the standard deviation of turnover. The variable size has a positive relation with debt, except when measured by the Ln (total net assets). Business risk and profitability shows a negative relation with debt, is not the case with growth, which shows a positive relation. Business risk measured by the coefficient of variation of EBIT and standard deviation of EBIT, as well as tangibility and non-debt tax shields not shows determinants of total debt.
The Y2 regression (Long term Debt/TNA), referring to the debt in the medium and long term, has different results of the previous regression and a substantially lower explanatory power about 3%. The size, growth, profitability and tangibility when measured by tangible assets, show statistically significant results concluding be determinants of medium and long-term debt. Like the previous regression, the number of workers is an indicator with little meaning in the relation with the variable size with the indebtedness. Please note that tangibility, profitability and size, except when measured by the number of workers, have a negative relation with debt and the only one to show a positive relation is growth. Variables business risk, leverage measured by the indicator Intangible Assets/TNA and non-debt tax shields, do not show statistically significant results.
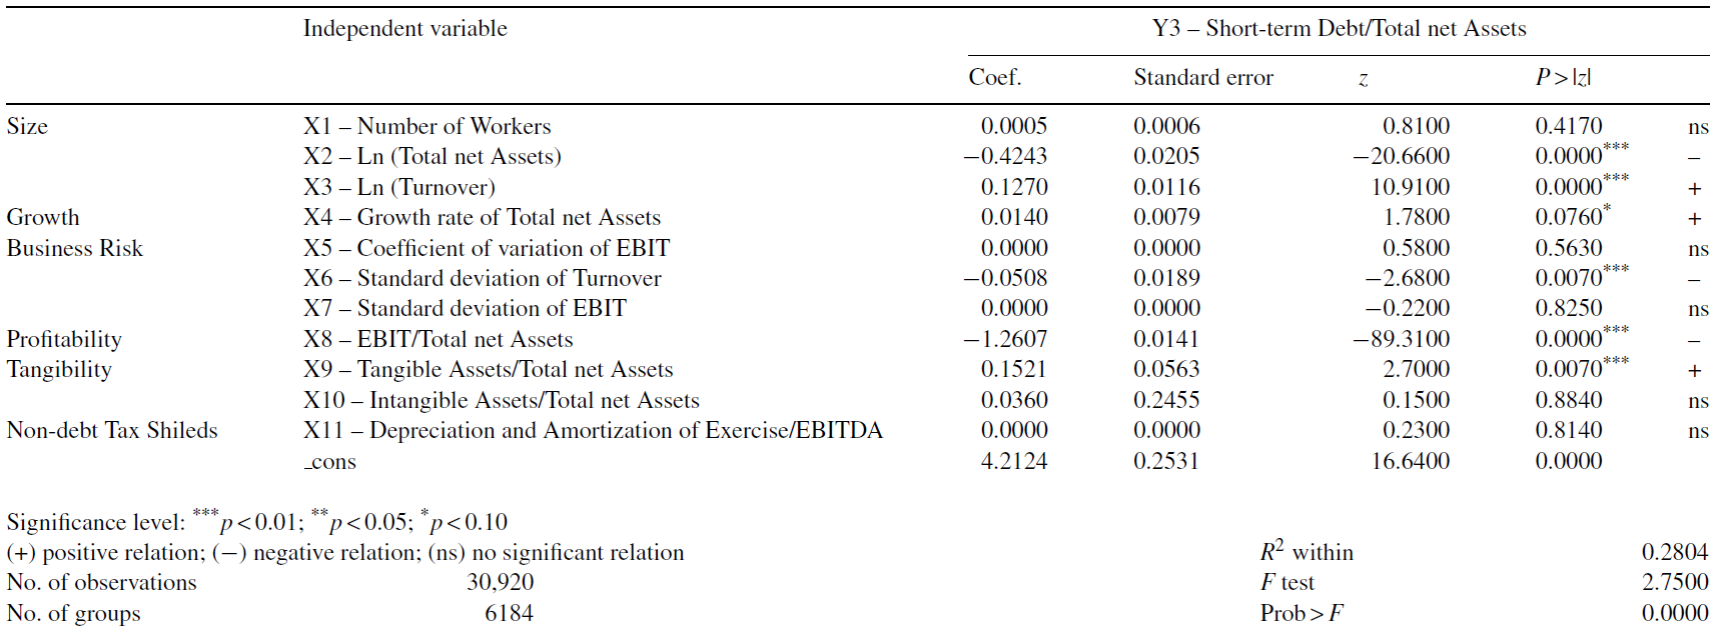
The explanatory power of regression Y3 (Short-term Debt/TNA), related to short-term debt, is about 28%. Based on statistical evidence, show up as determinants of debt the variables size, except when measured by the number of workers, growth, business risk as measured by the indicator of turnover standard deviation, profitability and tangibility when measured by tangible assets/TNA. The size, similar to the total debt, presents a negative sign when using the Ln (total net assets) and a positive signal when using the Ln (turnover). Growth and tangibility have a positive relation with debt, unlike business risk where the signal is negative. Without any statistical evidence on the relation with debt they are the size, measured by the number of workers, business risk measured by the coefficient of variation of EBIT and standard deviation of EBIT, tangibility when using the indicator Intangible Assets/TNA and non-debt tax shields.
Discussion of results
Bearing in mind the theories of capital structure, empirical studies previously presented and hypotheses formulated we can make some considerations about the results. The determinants of capital structure of firms in the Santarém's district with the greatest influence on indebtedness are: size, growth and profitability. The influence of tangibility and business risk depends on the measure used. The non-debt tax shields just are not able to influence the level of indebtedness of firms. The observed and expected relations are summarized in Table 12.
Table 12: Expected and observed relations.
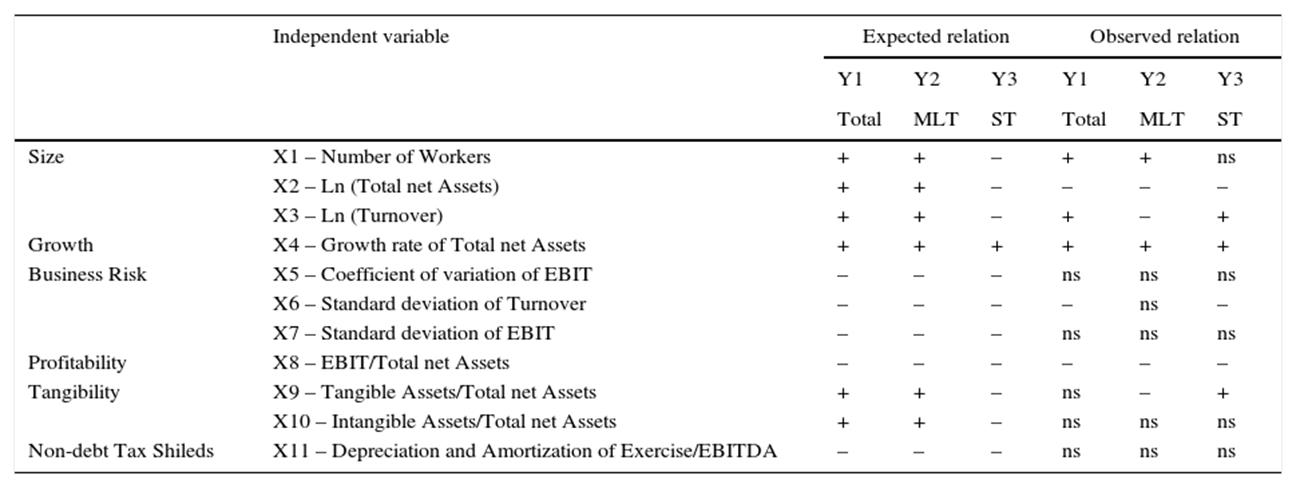
(+) positive relation; (−) negative relation: (ns) no significant relation.
Source: Own elaboration.
The indicators used to measure the variable size, are able to influence the level of indebtedness in all periods except the number of workers, most likely due to the reduced number of workers at most firms. The signs observed in all other indicators are not consistent with the hypotheses formulated by varying the signal sometimes by the indicator, other by the deadline, not being able to confirm the suggested by Scott (1976) , in which, in the context of the insolvency costs, the larger firms support smaller costs of insolvency and therefore tend to be more in debt. Negative signals obtained may indicate, since over 80% of the sample is micro-enterprises and smaller firms support higher insolvency costs, as Warner (1977) states, creating therefore greater difficulty in accessing credit. Titman and Wessels (1988) suggest that smaller firms are more prone to short-term debt.
The growth variable, measured by the growth rate indicator of total net assets, is significant across all maturities, confirming the hypothesis formulated and in accordance with the pecking order theory. The positive sign suggests that internally generated funds are not sufficient to finance the respective growth, as advocated by Myers (1984). The results will meet de Brito et al. (2007) and Jorge and Armada (2001) , suggesting that the higher the growth, the greater is recourse to debt.
Under the theory of insolvency costs, suggested by Warner (1977) , or the theory of asymmetric information, referenced by Leland and Pyle (1977) , it was expected that if it obtained a negative signal at all maturities regardless of the indicator used to measure the variable business risk. However, is only determining factor of the debt in the short term and total when measured by turnover standard deviation. Like Bradley et al. (1984) , the results suggest that firms with more volatile turnover have lower debt levels, reflecting greater difficulties in accessing finance.
The negative signal obtained in all regressions for variable profitability resembles other empirical studies, such as Titman and Wessels (1988), Rajan and Zingales (1995), Vieira and Novo (2010) and Cardoso (2011) , confirming the formulated hypothesis. The higher the profitability, lower recourse to debt evidencing that firms prefer financing through retained earnings, confirming the theory of the pecking order theory, as proposed by Myers (1984) and contrary to the theory of tax effect defended by DeAngelo and Masulis (1980).
It turns out, in relation to the variable tangibility; intangible assets did not serve as a guarantee to creditors. Tangible assets have a negative relation with the medium and long term debt and a positive relation with the short-term debt, contrary to assumptions made. Scott (1976) and DeAngelo and Masulis (1980) , based on the theory of agency costs and the theory of insolvency costs have argued that the greater the assurance given by the assets, the higher the level of debt. In this case, the result suggests that those serve as guarantee for short-term debt, possibly due to the fact that the short-term debt level of the sample firms is 52%.
It was expected a negative relation between the non-debt tax shields and debt, to the extent that the increase of these benefits can lead to unused tax benefits resulting from debt. However, like Titman and Wessels (1988), Jorge and Armada (2001) and Junior (2012) , the results assume no statistical significance, not validating, therefore, the theoretical basis of the influence of other tax benefits in deductibility of interest as allowed by the theory of tax effect.
Conclusions
The current economic and financial environment requires that firms are in constant transformation and upgrading, not only in productive terms but also in economic and financial terms, otherwise their survival proves to be very difficult. It becomes necessary for firms to grow and modernize. For this to happen, they need to resort to financing that can be internal or external source. The choice of the most appropriate source to finance the assets causes great concerns, especially when it comes to new business opportunities or to ensure the survival of the firm. Inherent to these concerns and seeking to maximize the firm's value or minimizing the weighted average cost of capital are several theories.
The model of Modigliani and Miller (1958) , assuming a perfect capital market, believes that the firm's value is not influenced by the financing structure, contrasting the traditional approach, generating some criticism due to market imperfections. These imperfections allied to the problem of capital structure led to the emergence of new theories. One of the imperfections is related to the tax effect derived from the deductibility of interest on the debt. The interaction between the income tax and the combination of tax benefits may allow the definition of an optimal level of debt. Another is related to agency costs, i.e. costs related to the conflict of interest between capital owners, managers and creditors, which can be minimized with the use of debt converging thus the optimal capital structure. The increase of debt may cause financial difficulties increasing the risk of insolvency. The nullity of the insolvency costs and the present value of savings are considered the optimum capital structure ( Esperança & Matias, 2010 ). Managers have information about firm policies, including investment opportunities, which other stakeholders do not have, can lead to asymmetries in information. The information transmitted must be credible and effective in order to minimize the costs of these signals. Following the study of informational asymmetry, Myers (1984) proposed the pecking order theory. Based on this theory, firms prefer internal financing sources and only after having exhausted resort to external financing. Following these theories also come up studies on the determinants of debt. These determinants are explanatory of how firms are financed. In the theoretical and empirical literature the most common determinants were identified: size, growth, business risk, profitability, tangibility and non-debt tax shields.
From analysis to descriptive statistics it was concluded that 99.77% of the firms are small and medium enterprises, with about 80% micro enterprises. The average of total debt stands at 74%, the medium and long term at 22% and the short-term at 52%, indicating that most firms resort to short-term bank credit.
In summary, the results from the three multiple linear regressions, using the fixed effects model, allow the following conclusions:
Variables growth and profitability are the ones that have strong statistical evidence of being related to debt, confirming the assumptions made and the theoretical concepts;
The increase in the number of workers causes an increase in total debt and medium and long term;
Contrary to expectations, the negative sign obtained for the size measured by Ln (total net assets) may indicate that the smaller the firm, the lower the is use of debt;
When the turnover increases, the total debt increases. Contrary to expected, increased turnover causes a decrease in medium and long term debt and an increase in short-term debt;
It turns out that the growth rate of assets positively influences the relation with the debt;
Business risk has a negative influence for total debt and short-term debt, measured by the standard deviation of turnover. For the remaining deadlines and indicators provides no evidence capable of influencing the level of indebtedness;
Increased profitability causes a decrease in the use of debt, supporting the proposed hypothesis and the pecking order theory;
Contrary to expectation, the tangible assets is an inverse relation, i.e., the greater the increase in tangible assets, the lower the debt in the medium and long term. In the short term there is a reverse situation;
There was no statistical evidence as to the non-debt tax shields.
Given the results achieved, not all variables corroborate the theoretical studies and the hypotheses formulated. However, they are in consonance with other empirical studies, in other words, the problem of capital structure and of their determinant is far away from being solved.
The few existing empirical studies on small and medium enterprises, mainly Portuguese, is one of the limitations of this study. Most studies are about large firms or about firms listed on the stock market, making it difficult to compare results with the Portuguese reality and especially with the Santarém's district, composed mainly by micro enterprises. Another limitation relates to the use of secondary data. The information obtained cannot be properly validated or may not be a more harmonized at the level of several firms.
For future research, it would be more relevant to make other studies to analyze the influence of other explanatory variables in the capital structure, some were used in other studies, such as the uniqueness, the business sector, regulation, quality firm reputation, the level of exports, the location, in order to create a more expressive model in terms of explanatory and most consistent determinants of debt.

