


 nueva página del texto (beta)
 Inglés (pdf)
 Artículo en XML
 Referencias del artículo
 Enviar artículo por email
 Citado por SciELO
  Similares en
SciELO
Similares en
SciELO 
 Permalink
Introduction
Performing the asset allocation step in the investment process with a proper screening or asset selection method is perhaps the most important task to do in order to have a proper diversification and performance in our investment. This is a well-known statement that comes from the related literature and financial practice. Among the most well-known and used screening processes is to determine if a portfolio is going to be concentrated or diversified in small-cap, mid-cap or large-cap stocks or to determine if the investment strategy is focused or mixed in the investment of growth or value companies' securities. This is not a new subject of interest but one of the fields of emerging interest is to screen securities given the ethical or social responsibility values of their issuing company. This subject has been studied since the pioneering work of Moskowitz (1972) and Statman (2000). This is due to the activist investment style that several pension funds followed since 1960, strongly supported with previous practices followed in previous centuries by Jewish people, Muslims, Quakers, Puritans, Catholics or social and environmental activists (just to mention some of these groups). As we will note in the literature review, the term socially responsible investment (SRI), or sustainable investment are two related but also ambiguous terms whit no consensus in their interpretation by the investment professionals and academics.1 Therefore, the so-called SRI is a kind of multidimensional investment style that tries to measure the performance of a company in terms of its economical (financial) performance, social impact (Ethics codes, employee relationship, relation with stakeholders or community service), corporate governance and/or positive environmental impact. The key idea of this sort of investment style is to determine if it is proper to invest in the so called socially responsible companies at all or in a mix of these sort of companies, common ones (neither socially responsible or irresponsible) or also to invest part of the portfolio's proceedings in "sinful" (non-socially responsible) ones. This issue is of resent interest of several studies, as we will see in the literature review.
In the Mexican case, SRI is a new issue that started in 2011 with the Mexican stock exchange, EIRIS and the Anahuac University. These institutions launched (in a joint effort and with data from November, 2008) the IPC sustainability index that is an index with 35 stocks (at most) that form a subset of the broader IPCcomp index (with 60 the best small, mid and large-cap stocks). This new index started as the reference for SRI in Mexico and its performance and benefits of its members to investors is mainly studied by Valencia (2015), De la Torre and Martínez (2015) and De la Torre, Galeana, and Aguilasocho (2015). Given these aforementioned papers, we want to extend these studies by applying again the mean-variance test with non-parametric statistical tests and with a market-cap factor analysis. We follow the study line of Valencia (2015) but instead of using a theoretical equally weighted SRI portfolio as he did, we will use the public market cap IPS index, along with the small, mid and large-cap indexes of the IPCcomp members.
The idea of the present paper is to test (with a non-parametric and multi-factor perspective) the next hypothesis: "The socially responsible investment is as good as the common broad market one by the fact that it presents a similar mean-variance efficiency and a proper diversification given a market-cap factor". In order to extend our results, we will understand as "common" or "broad market" investment style as an investment strategy (either passive or active) that follows either the IPC (large cap) or the IPCcomp indexes as benchmark or market portfolio (as the aforementioned papers do).
Once that the aim and potential results in the paper have been mentioned, the structure of the present paper is as follows: a literature review will be presented next, followed by the empirical test and the observed results in order to end the document with the concluding remarks and the recommendations for further research.
Literature review
SRI is an investment style studied with different focuses. As we mentioned at the introduction, almost all the published studies focuses in the mean-variance efficiency of SRI. This is done departing from the study of Moskowitz (1972) and having, as a formal departure, the first study of Statman (2000) who used the Modigliani and Modigliani (1997) performance measure and conclude that there is no over-performance from the SRI funds in comparison to the conventional ones. Another more actual study that is the basis of the present one, is the work of Schröder (2004) who analyzed 56 US, German, and Swiss SRI mutual funds and 10 SRI benchmarks. To do this, he measured the observed alpha in their performance. His hypothesis was to test the potential underperformance of SRI against common stock mutual funds. His result leads him to reject his hypothesis. Following him, we would like to mention the study of Bauer, Koedijk, and Otten (2005). This is the first review of SRI that uses the Carhart's (1997) multifactor model in SRI funds from Germany, the U.S. and the U.K. With this factor model in mind, they tested for alpha or over-performance against the market index (with SRI and non-SRI stocks). They found no evidence in favor of this for SRI and they also found that the US mutual funds tend to be more concentrated in large-cap stocks while the British and German ones prefer small-cap ones. This result is one of the first findings that inspire the present one, along with the one of Scholtens (2005) who found no over-performance in Dutch SRI mutual funds.
Why do these two studies are a starting point for the present paper? In order to answer this, we would like to observe that the concentration in small, mid or large-cap stocks leads to different diversification levels and this result could lead to a potential better mean-variance efficiency and performance in the long-term.2 This also could be in line with the comments of Duran and Bajo (2012) who suggest that SRI performance is strongly related with the country of the Company (i.e. if they are from liberal economies or more restricted developing ones), along with their core business.3
Another paper that is a starting point for the present one is the study of Schröder (2007). He tested 29 SRI worldwide indexes with the next hypothesis in mind4: H0: α = 0, β = 1. In his paper, he applied a similar test than the one of Bauer et al. (2005) and concluded that there is no over-performance in the SRI and that the conventional broad market indexes do not replicate the performance of the SRI ones. This lead to conclude that both type of indices lead to different performance and different investment styles. This paper is a starting point of the present one by the fact that we start with the hypothesis that the Mexican SRI does not lead, as De la Torre et al. (2015) suggest, to over or under-performance against the common or broad market one. We extend this result, as previously told, by studying the performance with a diversification i.e. market-cap factor model, along with a test of the performance by using a non-parametric statistical test.
Finally, Areal, Cortez, and Silva (2013) applied the Carhart multi-factor model to test the performance of a SRI portfolio against a "vice" or "sinful" portfolio. Their results show, with a two regime analysis, that the SRI portfolio underperforms the S&P500 index in "normal" periods but in "crisis" ones the worst performer is the "vice" or sinful one, suggesting that, in times of crisis is preferable to invest in SRI stocks, a result that is also in line with De la Torre and Martínez (2015).
Up to this point we have discussed SRI by assuming that is a clearly defined and conventionally accepted concept. Nowadays there is a debate about what is understood as "sustainability" or "social responsibility" or even if they are the same issue or not. This debate is proper from the "corporate social responsibility" (CSR) philosophy and even if it is related to socially responsible investment, the definition and also the "pillars" or factors that define these concepts are outside the rationale of the present paper.5 We mainly focus in what is conventionally understood as "socially responsible investment" but still, as Eccles and Viviers (2011) note, there is still "conceptual fuzziness" about the term. In fact, as they point out, the term "socially responsible" is an evolutionary concept that started with different names such as "ethical investing", "religious investing", "responsible investment", "community investing" and so forth. Therefore, to tell that the Mexican IPC sustainability index is "sustainable" and not "socially responsible" depends only of semantics (from the stock exchange point of view) by the fact that it uses some screening criteria to select a group of stocks that fulfill some social, environmental and corporate government issues. Therefore, as noted by Berry and Junkus (2013), there is a broad and heterogeneous array of criteria to score a company as "socially responsible". Therefore, we also would not discuss if the criteria used by the Mexican Stock Exchange is proper or not and we will left this issue to further research. This is so because also the validity of the factors and criteria to screen and grade the level of social responsibility is an issue still in research and evolution. A good example and improvement of the measures of social responsibility (for human resources) is shown in Barrena-Martínez, López-Fernández, and Romero-Fernández (2016) for the Spanish case.
Following these comments, we will only address, before to finish our review of literature, that even though the name "sustainability index" is closely related to the Millenium document (United Nations, 2005), its screening methodology is closely related to what is known as the ESG (Environmental, Social and Government) screening process that has its foundations in the United Nations Principles for Responsible Investment (United Nations, 2006). Why do we note this? Because, departing from this issue, we want to address that these principles (ESG) are recently incorporated in the financial industry and sometimes sustainable or socially responsible investment are terms used as synonyms in the literature,6 by noting the diversity in the screening criteria and investment objectives of "ethical" or "socially responsible" investment funds. This issue of the conception and implementation of ESG (as such) in the investment process is studied in detail by Duuren, Plantinga, and Scholtens (2015) who found, by applying an online questionnaire, that even if some funds are not ESG funds, they have it as part of their analysis. They also found that ESG investment is similar to the fundamental one and also confirm the results of Auer and Schuhmacher (2015) by noting that the US investors are skeptical to ESG investment by the fact that is related with "religious" investment and because there is no confidence on the financial benefits translated to the investor (a thesis that we want to confront). Duren, Platinga and Scholtens also found that the European investors favor ESG investment more than the US ones, something that, as Auer and Schumacher suggest with their discussion, has an impact in the stock price and investment performance.
Almost every study that we review7 here concluded that there is no significant difference in the performance of SRI investment against the broad market one.8 Also, as noted in the introduction, few studies have been made to the Mexican stock market starting with the ones of Valencia (2015), De la Torre et al. (2015) and De la Torre and Martínez (2015), being the present one an extension of these. To give a more complementary perspective Valencia (2015) test some factors, such as market, momentum and capitalization in an equally weighted sustainable portfolio by using the Fama-French and Carhart factor models. He tested this equally weighted portfolio against the original IPCS, a non-sustainable portfolio formed with the stocks of the IPCcomp index that are not sustainable and the IPC sustainability (IPCS) index. He found, in line with our results, that the sustainable portfolio is less risky than the large-cap IPC index but reports a lower monthly return. He also reported that the sustainable portfolio had no difference in the monthly returns paid than the non-sustainable one but its risk is lower than the latter. As a complementary result, he observed lower market factor betas in the socially responsible portfolio than the non-sustainable one. His study is also another influence for the present one by the fact that we will extend the review of De la Torre et al. (2015) by adding the IPC index to the IPCcomp as two different market factors and, complementary to his study, we will use the original market cap IPCS index. We also will perform a market-cap factor analysis that is in line with part of his study.
Now that we have presented the theoretical background and some of the previous studies that motivate the present one, in the next section we will describe the test that will prove the general hypothesis given in the introduction.
Empirical analysis
Data and methodology description
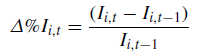
In order to prove our hypothesis "The socially responsible investment is as good as the common broad market one by the fact that it presents a similar mean-variance efficiency and a proper diversification given a market-cap factor", we performed six tests9 with daily data of the three indexes (IPCS, IPC and IPCcomp) from November 28, 200810 to August 28, 2013. In a first test, we made a base-100 performance review with values from November 28, 2008, given the daily return Δ % I i of each index (I i ):
 (1)
(1)
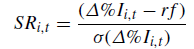
Following this, we compared the standard deviation σ (Δ % I i ) of Δ % I i in the last t - 30 labor days at t. We did this because we wanted to have a first answer to the statement "The investment in the sustainable subset leads to a higher degree of risk than the broad market strategy". Following this, we calculated the Sharpe (1966) ratio given by:
 (2)
(2)
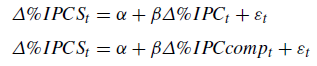
The risk free rate (rf) is percentage change of the VALMER_MEX_28D CETES benchmark and SR i,t , as mentioned, is presented in daily values. The calculated values of SR i,t were tested jointly with a one-way ANOVA test, using the next null hypothesis H0: "The Sharpe ratios of the IPCS, the IPC and the IPCcomp are statistically equal". If H0 holds, the test would give a first proof of the aforementioned paper's general hypothesis. As a complementary result of this test, we performed a goodness of fit test for each of the time series by using the Kolmogorov-Smirnov and Anderson-Darling non-parametric tests. Once we found that the returns calculated with (1) are not normally distributed, we applied the non-parametric Kruskal-Wallis test to prove our hypothesis from a mean-variance (Sharpe ratio) perspective. In a third test and following the Schröder (2004) and Blanchett (2010) studies, we used the Jensen's alpha performance measure in two standard CAPM models of the IPCS against the IPC and the IPCcomp11:
 (3)
(3)
We used this performance measure because we wanted to test if the mean-variance efficiency of the IPCS leads to a significant over-performance against the IPCcomp and IPC indexes. If we find a statistically significant alpha, we will find further proofs in favor to the SRI practice in Mexico (over-performance against broad market investment).12 If not, we will show that the performance between SRI and the broad market one is the same.
By following Schröder (2007), we also ran a fourth test with the Huberman and Kandel (1987) spanning test of the same two standard CAPM models in (3). We did this by testing the next null H0: α = 0, β = 1. With this test we wanted to confirm the result of the previous standard Jensen's alpha test and to check if the broad market index (IPCcomp) can replicate the performance of the IPCS. If the spanning test holds, we will find a proof that the IPCcomp (or the IPC) and the IPCS can be used indistinctly, giving also a stronger support to the sustainable investment in Mexico by arguing that an investment strategy either in the IPCS or the IPCcomp leads to similar results and, therefore, it is preferable to use the IPCS without the loss of performance from the common or broad market investment style.
If Jensen's alpha and the spanning tests suggest a similar or better performance than the IPC or the IPCcomp, a review of the factors that cause this result will be a necessary task. This is what motivates our fifth test. To design a proper model such as the Carhat of Fama-French one, we reviewed several multifactor approaches such as the ones used in Bauer et al. (2005), Scholtens (2005), or Lee and Faff (2009). Following this review, we saw the Carhart (1997) multifactor model as an appropriate option to measure the performance of the sustainable investment in order to test if the results are due to the market capitalization of the stock members in the IPCS or by they rate of growth of their dividends i.e. by the fact that the IPCS is concentrated in growth or value stocks.
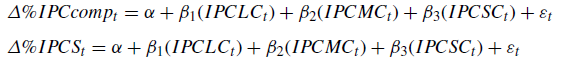
By the fact that there are no growth or value indexes in México and because of this limitation, we cannot run the entire Carhart (1997) multifactor model. To solve this issue we ran, as an alternative and fifth test, a three-factor model by using the IPC large cap (IPCLC t ), IPC mid cap (IPCLC t ) and IPC small cap (IPCLC t ) indexes in a regression with the IPCS and the IPCcomp indexes13 as dependent variables:
 (4)
(4)
This model will give hints about the market capitalization style that has more influence in the behavior of each index and some explanation to the observed results in the previous tests.
These five aforementioned tests are appropriate to measure the performance of a portfolio or benchmark in an ex-post fashion. In order to complement the results in an ex ante way, we ran a sixth and final test with a Monte Carlo simulation with 100,000 scenarios in a 5 years-forward window. From the 100,000 scenarios in each index, the median, the fifth and 95th percentiles of each simulated date were calculated for the IPCcomp index, and only the median for the IPCS and the IPC indexes. With these percentiles in the IPCcomp, a non-parametric 90% confidence interval was calculated in order to determine, in the long run, if the IPCS is statistically equal to the broad market index (IPCcomp). We applied this test because we want to prove that the ex post results will hold in the long-term. To prove this, the IPCS must lie between the non-parametric 90% confidence interval and, if possible, above the simulated median value of the IPCcomp.
The simulations and tests14 were performed with data from Economatica (2012) and presented in a MXN base.
Data analysis results summary
In Fig. 1 (first test) we present the ex-post performance results of the three reviewed indexes. As you can note, socially responsible investment (IPCS) shows a better performance than the common or broad market one. It is also of interest to note that the most popular or "conventional" benchmark in Mexico (The large-cap IPC) has a more volatile and poor performance than the most diversified IPCcomp (with 65 small, mid and large-cap stocks instead of 35) and the IPCS (a subset of the former). This behavior is noted despite the well-known Financial and Economic events in 2008-2009 and 2010-2011.
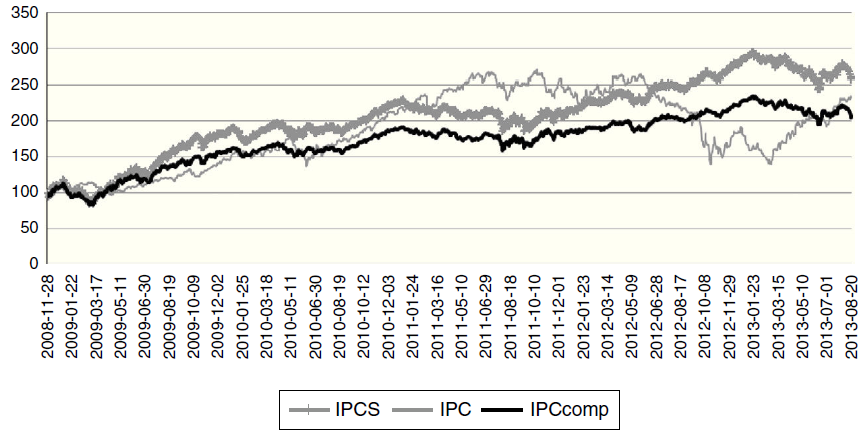
Source: Data from Economatica and the Mexican Stock Exchange.
Fig. 1 IPCS, IPC and IPCcomp ex post performance.
Fig. 2 presents the daily returns determined with (1) and Fig. 3 shows the historical 30-day standard deviation calculated with (2). As noted in both figures, the IPC index has a more unstable behavior (more volatile) than the other two indexes. Among the possible explanations of this issue are (1) the IPC index is the most influential and most used benchmark in the Mexican Stock Market and (2) is a large cap (blue chip) index, suggesting a potential lack of diversification against the IPCcomp that invests in small, mid and large cap stocks. This leads to note that this index could not be as efficient as expected, strengthening the conclusions of Martínez, De la Torre, and Bilbao (2010) and De la Torre and Martínez (2013a, 2013b), who proved the mean-variance inefficiency of the IPC index, the Dow Jones and the IBEX35 indexes as proxies of their respective market portfolios.
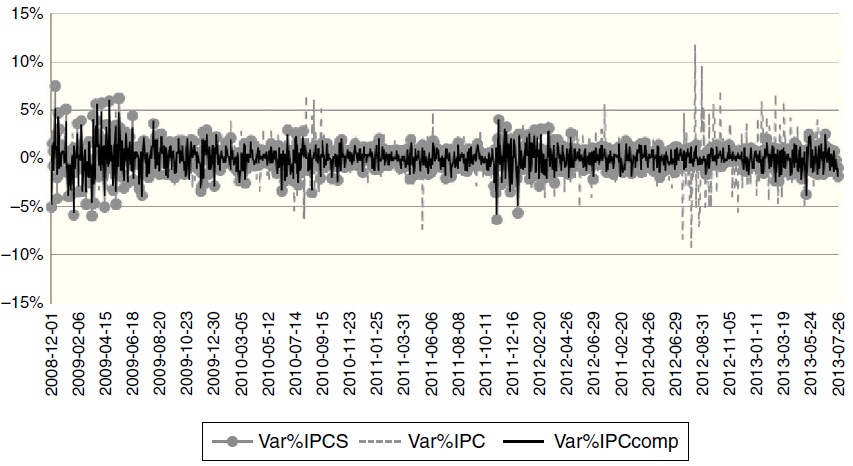
Source: Data from simulations with index data form Economatica.
Fig. 2 IPCS, IPC and IPCcomp’s daily percentage change.
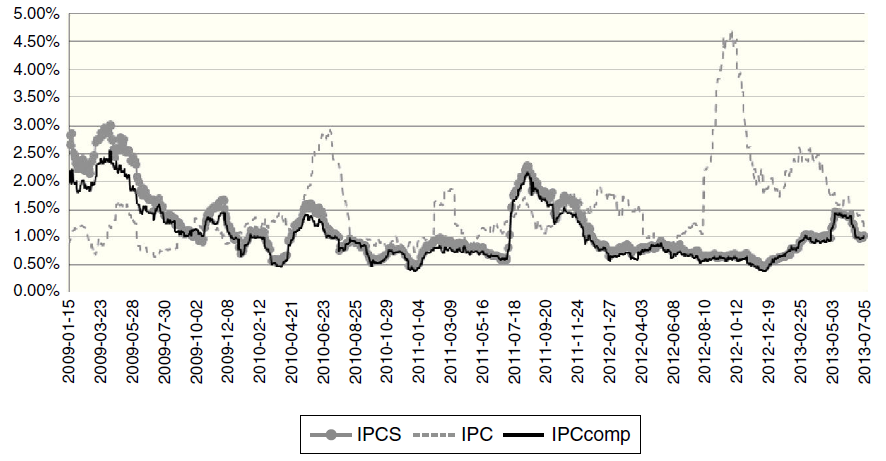
Source: Data from simulations with index data form Economatica.
Fig. 3 IPCS, IPC and IPCcomp’s historical volatility (standard deviation at t).
As mentioned previously, the IPCS and IPCcomp share a similar behavior and also similar volatility levels, a result that, as presented in Fig. 3, suggests similar mean-variance efficiency (Sharpe ratio) levels as shown in Fig. 4. In that figure, the historical Sharpe ratios share a similar level in these two indexes and, as expected, the IPC index has more volatile values. Despite this issue and in order to confirm that there is a statistical equality in the performance (mean-variance efficiency measured with the Sharpe ratio) in the three indexes we ran a parametric15 one-way ANOVA test and a Kruskal-Wallis non-parametric one. In the panel A of Table 1 we show the results of the one-way ANOVA test and we note that the Sharpe ratio levels are statistically equal. In order to check the validity of this results, we ran the conventional Jarque-Bera test for normality in the historical data of the three simulated indexes, along with the Kolmogorov-Smirnov and Anderson-Darling fitting test for a Gaussian, t-Student, Generalized Extreme Value (GEV) and two Pareto pdfs with Shape parameter of 0 and 2. As we can note in panels C and D of the same table, only the IPC index has a high probability of being normally distributed. Therefore, it is more appropriate to run a non-parametric equality test, that we show in panel E where we show the same conclusion of the ANOVA test i.e. a high probability that the historical Sharpe ratios of the three indexes are equal asymptotically. With this in mind, we arrive, for the Mexican case, to a result that is consistent with the findings of Statman (2000) and Schroder (2004, 2007).

Source: Data from simulations with index data form Economatica.
Fig. 4 Observed Sharpe ratios in the IPCS, IPCcomp and IPC indexes.
Table 1 Probability goodness of fit tests and parametric and non-parametric test of the mean-variance efficiency (Sharpe ratios).
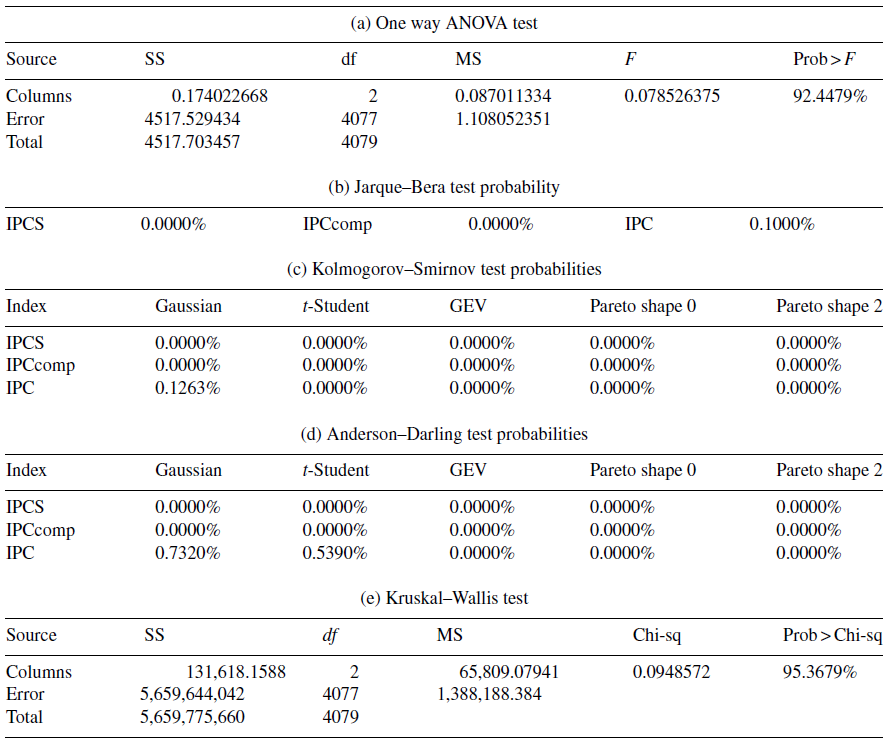
SS, Suqares sum; df, Degrees of freedom; MS, Mean squares; F, F-Statistic.
Source: Data from simulations with index data form Economatica.
In spite the fact that these authors used another performance measure, this first result gives a first hint about the mean-variance efficiency of the Mexican sustainability index.
In order to strengthen this and in line with the tests in Schröder (2004, 2007) we also ran, as a third test, a one-factor model for the IPCS daily returns against the IPC and IPCcomp indexes and used the Jensen's Alpha as performance measure. To do so, we ran the one market factor regression model presented in (3) and present the analysis in Table 2.16
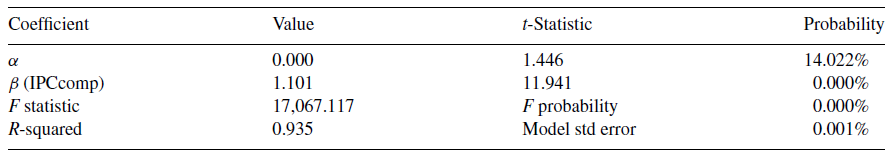
Table 2 Huberman and Kandel (1989) Spanning test (H0: α = 0, β = 1) with the IPCcomp and IPC index as market benchmark.
Source: Data from simulations with index data form Economatica.
The results in Table 2 reveal that the standard CAPM R-squared statistic has an important value (more than 0.90) and the beta value close to 1 is significant, suggesting an influence of this index in the IPCS and a practically equal behavior. Following this, it is noted that the IPCS has no significant Jensen's alpha (a probability of 14.02%) and therefore, there's no extra return (over-performance) in this investment style against the broad market one.
With the beta value of almost 1 in Table 2, an interesting question comes across: we are assuming that the socially responsible investment (SRI) or the IPCS is preferable than the broad market one. But can we use either the broad market or the SRI investment indistinctly as investment style? i.e. Can we use SRI without a loss of performance against the IPCS? In order to answer this question, we used the Huberman and Kandel (1987) spanning test as in Schröder (2007). Table 3 shows the results for this test where we show that we accept the null hypothesis H0: α = 0, β = 1 i.e. the IPCS and the IPCcomp have similar mean-variance efficiency and there are no extra returns in the IPCS against the IPCcomp. By accepting the spanning test,17 the IPCcomp and the IPCS can be used indistinctly in Mexico i.e. we can use a SRI strategy without the loss of performance against the IPCcomp by the fact that the latter is a good proxy of the former.
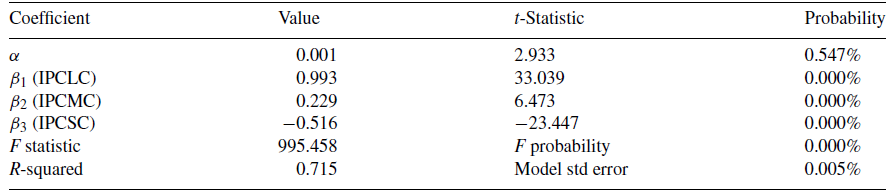
Table 3 Large, mid and small cap multifactor model for the IPCS.
Source: Data from simulations with index data form Economatica.
Given the observed results, a natural question comes up: What are the drivers or factors that cause the statistical equality in the mean-variance efficiency in both indexes?
In order to give a first answer, we could have used the Carhart (1997) model as in Bauer et al. (2005), or Scholtens (2005) but, unfortunately, there are no value or growth investment style indexes in Mexico, this being one of the most important drawbacks of the present paper. In order to solve this situation, we constructed a large, mid and small-cap multi-factor model for each of the IPCS and IPCcomp indexes.18 We excluded the IPC from the analysis because it is, by methodology of calculation, a large-cap (blue chip) stock index and the regression values were not significant only for the large cap factor. For this last purpose we used the least squares regression model in (4).
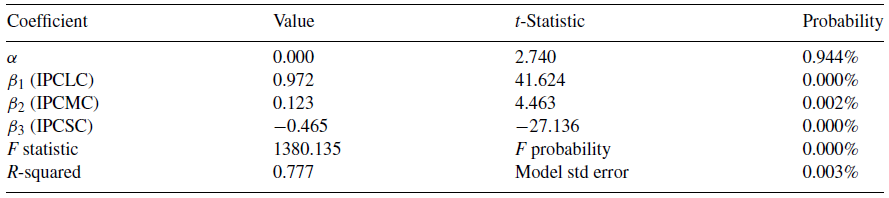
Tables 3 and 4 presents the regression values for the IPCS and IPCcomp, respectively and show that the three factors and the alpha are statistically significant, suggesting that, by the fact that the IPCcomp is a broad market index with large, mid and small stocks, this three investment styles have a strong influence in the performance of both indexes. These results prove that the IPCS and the IPCcomp do not present market cap (small, mid or large) investment concentration.
Table 4 Large, mid and small cap multifactor model for the IPCcomp.
Source: Data from simulations with index data form Economatica.
From these two tables it is important to note that the IPCS has more favorable influence from this factors by the slightly higher negative influence of the small cap factor (-0.516 vs. -0.465 of the IPCcomp). This last statement implies that when the broad market falls by the influence of negative external shocks, the IPCS is more stable than the IPCcomp because the small cap stocks (usually less liquid) have a higher offset effect.
Following this result and in order to answer the question "Will we see a higher performance of the SI investment in Mexico against the broad market one?" we run, as a fifth and final test, a daily five-year Monte Carlo simulation and we calculated a 90% non-parametric confidence interval of the IPCcomp performance.19 This is done in order to estimate the future performance of the three indices.
The Monte Carlo simulation procedure is as follows: first we used the historical mean μ and standard deviation σ values and then we assumed the conventional assumption that the prices at t (S t ) in the simulated indexes follow a Stochastic Geometric Brownian motion, departing from the starting price (s0 = Las observed price in the historic data) in the simulation:
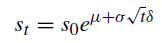 (5)
(5)
In the last expression δ is the Gaussian inverse of a U(0, 1) random number (a proxy of the probability of occurrence).
In order to run this simulation we followed these steps suggested in Dowd (2005):
1. We simulated a random return or percentage price variation at t + k periods with the next expression20:
 (6)
(6)
2. We added 1 to each value: 1 + Δ % s t .
3. We calculated the cumulative product of the simulated index starting price (S 0 ) i.e. the price observed at December 31st, 2015.
4. We ran steps 1-310,000 times and then we calculated the median and the 5% and 95% percentiles of the 10,000 simulated values of s t+k .
The results of our simulation are displayed in Fig. 5 an show that the IPCS (the boldest gray line) has statistically equal but slightly (non-statistically significant) superior performance in an ex-post and ex-ante context, suggesting that even if its value lies within the upper and lower non-parametric limits (proving statistical equality), its simulated behavior is more preferable than the blue chip IPC or the IPCcomp indexes.

Source: Data from simulations with index data form Economatica.
Fig. 5 Historical values and Monte Carlo simulation of the three studied indexes.
Up to this point we have performed six tests that lead to observe that the sustainable investment in Mexico is as mean-variance efficient as the broad market one. We resume our results next21:
The performance of the IPCS is, ex post, marginally (but not statistically) higher than the IPC and the IPCcomp and the risk levels in the sustainable investment (IPCS) are practically the same than the broad market strategy if we use the IPCcomp as a proxy.
The results also suggest that there's no over-performance if we use the Sharpe ratio and the Jensen's alpha measures.
Despite the previous result, the spanning tests suggest that the IPCS and the IPCcomp share practically the same performance but it is possible to use the SRI as substitute investment strategy without the loss of performance against the broad market one.
A multifactor model with large, mid and small cap indexes as regressors suggest that the IPCS and IPCcomp do not present any concentration in any of these market-cap stocks and show that the SRI has an offsetting (positive) behavior with the small cap factor in moment of equity distress.
The Monte Carlo simulation confirms the observed ex post results: there is statistical equality between the SRI and the broad market strategy and there's no loss of performance in the long term.

Concluding remarks
The results from our tests lead to a similar conclusion in almost all the studies presented in the literature review: Socially Responsible Investment (SRI) in Mexico is as mean-variance efficient as the common broad market one. In this paper we present one of the first studies about the efficiency of the sustainable investment in Mexico and we observe that despite the fact that our general hypothesis is proved, we support the use of SRI due to its social, economic and environmental scope an because we did not find evidence of a loss of performance (mean-variance efficiency) against the broad market strategy in the long-term.
To support our conclusions, we tested the IPC sustainability (IPCS), the IPC (blue chip and large cap) and the IPCcomp (broad market) indexes by using the Sharpe ratio and the Jensen's alpha in a standard CAPM model. We also used a spanning test of the same CAPM model, a multi-factor model for the market cap investment style, and a Monte Carlo simulation. The results allow us to conclude that even if the IPCS had higher volatility levels than the broader IPCcomp (but not against the IPC), the three indexes studied had a similar mean-variance efficiency and performance.
To support these results, we applied the Huberman and Kandel (1987) Spanning test (H0: α = 0, β= 1) and a Monte Carlo Simulation in order to prove that the SRI in Mexico (proxied with the IPCS or the IPC) has an equal performance than the broad market one (either IPCcomp or IPC).
With or hypothesis supported (the performance of the broad market investment and the socially responsible one is statistically equal), we focused our attention to find the causes of this result to check if it holds in the long-term. Among the first tests that we wanted to apply is a multi-factor model such as the Carhart (1997). Unfortunately, there are no growth or value indexes in the Mexican stock exchange, so we used only a market-cap factor. Our results show that both the IPCcomp and the IPCS have similar mid-cap and small-cap concentration and, contrary to the most popular and widely used IPC index, both the IPCcomp and the IPCs are more diversified than the former. This situation leads to two interesting findings. First, the IPC index could not be as mean-variance efficient as the IPCcomp (supporting the results of De la Torre & Martínez, 2013a, 2013b). Therefore the latter (IPCcomp) should be used as "market portfolio". Following this, we found that the mean-variance efficiency in the IPC and the IPCcomp is practically the same and this last diversification level that we show suggest us that the performance of the IPCS vs. the IPCcomp could last in the long-run and out of sample.
Also we noted, with the market-cap factor model, that the diversification to small-cap stocks is an advantage of the IPCS and the IPCcomp against the IPC. This is so by the fact that small-cap stocks have an inverse or negative beta, a situation that suggests a "compensation" or sort of "hedging" effect in distressed market periods.
This last statement leads us to our final conclusion about the practice of socially responsible investment: "SRI is appropriate in the long-term for the asset allocation step of Mexican institutional investors (like pension funds or similar) by the fact that the mean-variance efficiency of this strategy is statistically equal than the broad market one, leading to a better social, economic and environmental (socially responsible) development in Mexico".
As guidelines for further research, a more complete analysis with proper growth and value indexes is suggested, along with a more detailed review of the factors that cause the mean-variance efficiency equality. Also the study of the performance of socially responsible investment with different risk measures such as CVaR or regime switching models could be a work of potential interest. Finally to review the informational efficiency in the Mexican sustainable investment and the non-sustainable one could be of interest i.e. to check if SRI is priced by investors in the Mexican case.

