


Services on Demand
Journal
Article
 text in
  English (pdf)
 Article in xml format
 Article references
 Send this article by e-mail
Indicators
-
 Cited by SciELO
 -
 Access statistics
Related links
-
 Similars in
SciELO
Similars in
SciELO
Share

 Permalink
Contaduría y administración
Print version ISSN 0186-1042
Contad. Adm vol.62 n.1 Ciudad de México Jan./Mar. 2017
https://doi.org/10.1016/j.cya.2016.07.001
Articles
Dynamic of foreign direct investment in the states of Mexico: An analysis of Markov's spatial chains*
a Universidad de Colima, México
The aim of this investigation is to analyze the evolution of the spatio-temporal distribution of foreign direct investment (FDI) across Mexican states. The literature that analyzes foreign direct investment in Mexico is numerous and diverse; however, it is argued that the analysis of the spatio-temporal distribution of FDI conditioned to spatial interaction effects in Mexico is still absent. In this sense, by applying the spatial Markov chain approach as proposed by Rey (2001), we found a divergence process in the FDI inflows among Mexican states that seem to get stronger over time. In particular, during the period from 2006 to 2013, the process of divergence toward higher-FDI inflows quantiles occurs among states spatially associated with neighbors in lower-FDI quantiles.
Keywords: Foreign direct investment; Spatial Markov chains; Mexico
JEL classification: F21; R12; C46
El objetivo de esta investigación consiste en analizar la evolución de la distribución espacial y temporal de la inversión extranjera directa (IED) en las entidades federativas de México. La literatura que aborda el análisis de la IED en México es abundante y diversa; sin embargo, se argumenta que el análisis de la distribución espacio-temporal de la IED condicionada a la interacción espacial en México, aún está ausente. En este sentido, mediante la aplicación del enfoque de cadenas de Markov espaciales propuesto por Rey (2001), se encuentra que la divergencia regional en la captación de IED es un proceso que parece afianzarse cuando se analizan diferentes cortes en el tiempo. En particular, durante el periodo entre 2006 y 2013 el proceso de divergencia hacia estratos de mayor captación estaría impulsado por las entidades federativas que interactúan con entidades contiguas ubicadas en estratos de captación de IED menores.
Palabras clave: Inversión extranjera directa regional; Cadenas de Markov espaciales; México
Códigos JEL: F21; R12; C46
Introduction
In the case of Mexico, diverse economic reforms and their legislative changes have been implemented in order to promote foreign direct investment (FDI) in the country. Even though the policies implemented during the last few decades of the 19th century allowed the participation in economic sectors such as mining, textiles, transport and even electricity and banking, these led to a significant increase of the available infrastructure in the territory; the main change that boosted an important flow of foreign direct investment occurred with the implementation of the NAFTA and the modifications to the foreign investment law that came along with it (Dussel, 2000). Since the NAFTA, the Mexican government has followed different strategies to promote the liberalization of commerce and favor the attraction of foreign investment; these include the new agreements and treaties for free trade such as the one signed with the European Union in the year 2000 (FTA EU-MX), the subscription of the Acuerdos para la Promoción y Protección Recíproca de las Inversiones (APPRI) (Agreements for the Promotion and Reciprocal Protection of Investments), as well as the improvements in matters of procedures and transparency.
At a regional level, a legislative modification with relevant implications for the economic process of the federative entities consisted in allowing foreign direct investment to go to any region of the country. This modification, which eradicated all geographical-type barriers for foreign investment, also proved to be a fair access to this type of investment for the different states of the country, and is a situation which has led to an increase in the regional competition in order to attract FDI and strengthen the efforts of the state governments in the implementation of regional policies for their attraction. However, some states have been more successful than others with regard to their ability to attract foreign investment; for example, only Mexico City and Nuevo León achieved 60% of the FDI accumulated between 2009 and 2013.
In this context of governmental efforts to increase the flow of FDI in the country, different investigations have focused on analyzing the effect of foreign direct investment in the Mexican economy. In this regard, the empirical evidence suggests that the FDI exerts limited positive effects, and that there is room for improvement for the conditions needed to benefit from the potential of the FDI and reverse the negative effects (Dussel, Galindo, Loria, & Mortimore, 2007). For example, the work of Oladipo and Vázquez (2009) studies the effect of foreign direct investment on the aggregated economic growth of Mexico. Its results suggest that the effect is favorable and of significance, though it is less when compared to that of exports, attributing a relevant role to the NAFTA. On his part, Waldkirch (2010) analyzes the effect of foreign direct investment on industrial productivity and the salaries in the 10 years after the implementation of the NAFTA. The author finds a positive effect on the total factorial productivity but a negative effect on the salaries, which indicates a divergence between them. In another study, Mendoza (2011) evaluates the impact of foreign direct investment on the growth of the manufacturing sector in Mexico, finding evidence of a positive and significant effect of the FDI solely when simultaneously considering the effect of the qualified personnel.
Even though these studies confirm the importance of the foreign direct investment for the economic progress of Mexico, in a regional concentration context regarding foreign direct investment, it is important to analyze its spatial and temporal behavior. The analysis of its evolution will allow us to determine the presence of a tendency to converge or disperse in the procurement of FDI, the expectations that the states have to transition toward higher (or lower) levels of FDI procurement, and even if the spatial interaction with the neighboring states is linked with this transition.
The objective of this research is to perform an exploratory analysis with regard to the evolution of the spatial and temporal distribution of foreign direct investment in the federative entities of Mexico. The methodology proposed for this objective is based on the Markov chain approach; in particular, it is based on the approach proposed by Rey (2001), which allows the incorporation of spatial interaction between regions.1 Unlike the methodologies that study the regional dynamic based on the beta convergence approaches, which offer a limited scope with regard to the global behavior of the temporal distribution of economic variables (Quah, 1993) and of the movement of the spatial units within the distribution (Rey, 2001), the Markov chain approach facilitates the study of the dynamic of the distribution of the economic variables throughout the years (Quah, 1996) and enables the inclusion of the spatial dimension in the analysis (Rey, 2001).
The document is organized in the following manner: after having established the purpose of the investigation, in the first section a revision of the bibliography is presented; subsequently, in the second section, the regional scope of the foreign direct investment in Mexico is discussed; after which, in the third section methodological aspects are described; in fourth section, the dynamic of the spatial-temporal distribution of the foreign direct investment in Mexico is analyzed; and finally, conclusions are presented.
Review of the bibliography
The permanent adaptation of the national legislative framework, with the objective of promoting foreign direct investment in Mexico, provides answers to the importance given to it as a factor that promotes economic growth, the creation of jobs, the diffusion of technological knowledge toward the national productive sector, new forms of business organization, the commercial integration with the local industry, and as a macroeconomic stabilizer by favoring the entrance of foreign currencies into the country (Dussel, 2000; UNCTAD Secretariat, 2003). However, some studies establish that the set of benefits obtained as a result of the procurement of FDI do not appear automatically, even in those countries where development requirements are established for foreign investors (Kumar, 2003).
In this sense, even though there are several investigations regarding FDI, it is possible to identify two sides that predominate in the analysis. On the one hand, we have the studies that discuss the impact of FDI on the development of the Mexican economy, and on the other, there are those investigations that aim to understand the factors that determine that capability for attraction and localization of the FDI in the country. The results of the investigations are far from reaching a consensus that points to the undisputable presence of favorable effects on the economic progress of the country; in fact, in some cases, the results are inconclusive, and in others, the positive effects are limited and even negative.
For example, in a study carried out by Oladipo (2007), the author investigates the effect of FDI on the economic growth of Mexico before and after the NAFTA; his results find evidence of a positive effect even though he also maintains that the effect of exports is greater in comparison. These results are subsequently confirmed in the work done by Oladipo and Vázquez (2009). In another study, De la Cruz, Canfield, and González (2009) also found evidence of a positive effect on behalf of FDI with regard to the economic growth of Mexico; however, the authors state that this effect is mainly present on the growth of industrial production and incidentally on the production growth of the service sector. Similarly, they also found that the FDI also has a favorable effect as an asset to international commerce, observing a significant effect on exports. In a more recent work, Romero (2012), (2014) finds that the effect of foreign capital on the economic growth of Mexico between 1984 and 2011 is reduced and smaller than the private national capital, perhaps due to the weak presence of relations of the FDI with the national economy, which suggests that the foreign capital should be considered as being complementary to the private national investment.
Furthermore, several studies have contributed to the clarification of the importance of the FDI in a regional and sectorial regard. A pioneer study in this sense is the one elaborated by Mejía (2005) who stresses the positive association between a measure of the market's potential and the flow of FDI's toward the states of the country. Subsequently, Díaz-Bautista (2006) finds that some variables such as the transport and migration costs to the United Sates are important to explain the regional economic growth of Mexico, even though he also finds that FDI and human capital seem to have almost no significant influence on the economic progress of the regions. In another study, Mendoza (2011) estimates the effect of the FDI on the growth of new manufacturing sub-sectors in Mexico and, through the implementation of a panel model, finds that the effect of FDI is somewhat inconclusive until the influence of qualified personnel is taken into account.
Among the investigations that discuss the effect of FDI on the Mexican job market is the investigation done by Ernst, Berg, and Auer (2007) who point out that FDI has had favorable effects on the creation of jobs in the country, even though it has focused on the export maquiladora industry. The authors indicate that the salaries in this sector have seen a rise even though it is lower than the average of the manufacturing sector. In turn, Waldkirch (2010) discusses the effect of FDI on the total productivity factors and on the job market. The author emphasizes that the first 10 years after the implementation of the NAFTA, the FDI has had a favorable effect on the dynamic of the total national productivity factors, although he has also found evidence of a negative effect on the salaries, particularly of the FDI that comes from the United States to the non-maquiladora industry. In another study, Airola (2008), who uses the information of the Encuesta Nacional de Ingreso y Gasto de los Hogares (ENIGH) (National Survey of Household Incomes and Expenditures) for various years, indicates that FDI favors the increase of relative wages even for the most educated workers, and thus, the salary dispersion in Mexico. Recently, Vergara, de Jesús, and Carbajal (2015) analyze the effect of FDI due to the great division of the states of the northern border; among their main findings, presence of a non-significant effect on the creation of employment, with the exception of the power sector, stands out.
On the other hand, some researches have focused on the evaluation of the FDI's ability to facilitate the diffusion of technological knowledge and the organization of national companies. In this regard, Romo (2003) finds that the established FDI in Mexico has contributed to the development of technological capacities through the effects of demonstration and training of human capital, but in a non-significant manner through the collaboration with national companies. In another study, Domínguez and Brown (2004) have found that for a number of establishments with heterogeneous technological capacities, the diffusion of technological knowledge of the FDI toward national companies is non-significant. However, when the authors segment the sample of establishments by level of technological capacities, they find that this effect is positive and significant in the segment with a high degree of technological capacities.
Among the investigations that analyze the factors that determine the capability for attraction and localization of the FDI in the country, is the study carried out by Cuevas, Messmacher, and Werner (2005) who evaluated the impact of the free trade agreements on the FDI for a group of countries, they found that the NAFTA favored the presence of FDI in Mexico sixty percent more than if there had not been such trade agreement. Dussel et al. (2007) discuss the macroeconomic determinants of the FDI on a sectorial and regional scale. The authors indicate that the elasticity of the raw materials imported with regard to the FDI is positive and negative for the national raw materials, which suggests a limited ability of the national industry to provide to the transnational companies. This aspect also implies that there is a limited diffusion process with regard to technological knowledge for the benefit of the national industry. In a study with panel data, Juárez and Ángeles (2013) state that FDI is mainly established in states that have a comparatively higher development than others, and that the size of the state market continues to be relevant as an attraction factor. For his part, Escobar (2013) who analyzes the determinants of the FDI, on a stately scale in Mexico, finds that higher education levels and lower crime rates favor the attraction of FDI. He also finds a presence of interregional effect diffusion, an aspect that seems to indicate a complementary situation between the FDI that establishes in a specific state and the neighboring states.
In the study of the FDI that arrives to Mexico, the role of the export maquiladora industry (IME) is addressed. Even though it has been documented that the IME was born in the seventies with a consumables, equipment and machinery import program, among other production factors, for the elaboration of products that would be exported to the United States, with the aim to generate jobs (Vera-Cruz, Dutrénit, & Gil, 2005), it has also been pointed out that it is more of a tariff system (García, 2001); the evolution of the IME toward more complex stages and technological development has also been documented, a process that the FDI has had a dominant role in Carrillo (2000). In this sense, some studies focused on the analysis of particular cases coincide in highlighting that even if the FDI immersed in the IME has managed to promote the diffusion of technological capacities and business development through the formation of entrepreneurial human capital and supply chains, it has also had a slow integration into the local productive system (Carrillo, 2001; Vera-Cruz et al., 2005).
In this context, the investigation efforts carried out have made for advancement with regard to the knowledge on the effect and the determinants of the FDI in Mexico, the results of which indicate the importance of establishing functional attraction policies that prioritize the quality and the integration of the FDI with the national economy, with the objective of endogenizing their potential benefits and minimizing the negative effects (Dussel et al., 2007). Despite this advancement, it is still necessary to look deeper into the analysis of the regional dynamic of the FDI in Mexico, in particular the evolution of its spatial and temporal distribution in the Mexican federative entities. In this sense, to our knowledge, the study of the spatial and temporal dynamic of the FDI through Markov's chain has been carried out by Wren and Jones (2010) for the British regions, even though it was carried out through the classic Markovian approach, without considering the possible effects of spatial continuity.2
Overview of the FDI in the states of Mexico
The recent evolution of the foreign direct investment flows at a global scale has shown important fluctuations related to the international fragile macroeconomic environment and the uncertainty in the investment policies of the receiving countries. In particular, this happened after experiencing a reduction of 18% in the global flows of FDI during 2012, a behavior that was accompanied by an increase in the participation (52%) of the developing countries (UNCTAD, 2013). However, in 2013, there was a 9% recovery in the global investment flow.
In the case of Mexico, the recent evolution of the foreign direct investment has basically two stages. The first corresponds to the notorious boost that the modifications to the Foreign Investment Law of 1993, with regard to the signing of the free trade agreement, gave to the acquisition of FDI. In this stage and after going through the disturbances caused by the national economic-financial crisis that started in 1994, the flow of FDI grew at a rate of 16% on average each year between 1994 and 2001, the year during which one of the highest levels was reached3 (Fig. 1).

Even though the modifications to the Foreign Investment Law that focused on the elimination of barriers for the entrance of FDI to the country have continued to be in force to this day (Lichtensztejn, 2012), it should be noted that after the notorious increase observed up to 2001, the flow of FDI has gone through a second stage characterized by an elevated volatility in the short-term and also through a long-term stable tendency. In this sense, the short-term fluctuations are within the framework of the recent international financial crisis, which caused the decrease in the flow of FDI in Mexico between 2008 and 2009; and in accordance with the international environment of the FDI, a new fall in 2012. However, even though the flow of FDI in Mexico seems to take a new recovery path since 2013,4 its dynamic has been stable with a modest mean annual growth of 1.3 percent between 2001 and 2013 (Fig. 1).
The governmental effort to attract more FDI flows to the country has had different results, particularly when its evolution is observed in the federative entities. A first inspection of the regional FDI allows us to appreciate two general features of its dynamic: (1) the regional heterogeneity in the capture of flows of FDI and (2) a tendency to the global divergence in the capture of regional FDI.
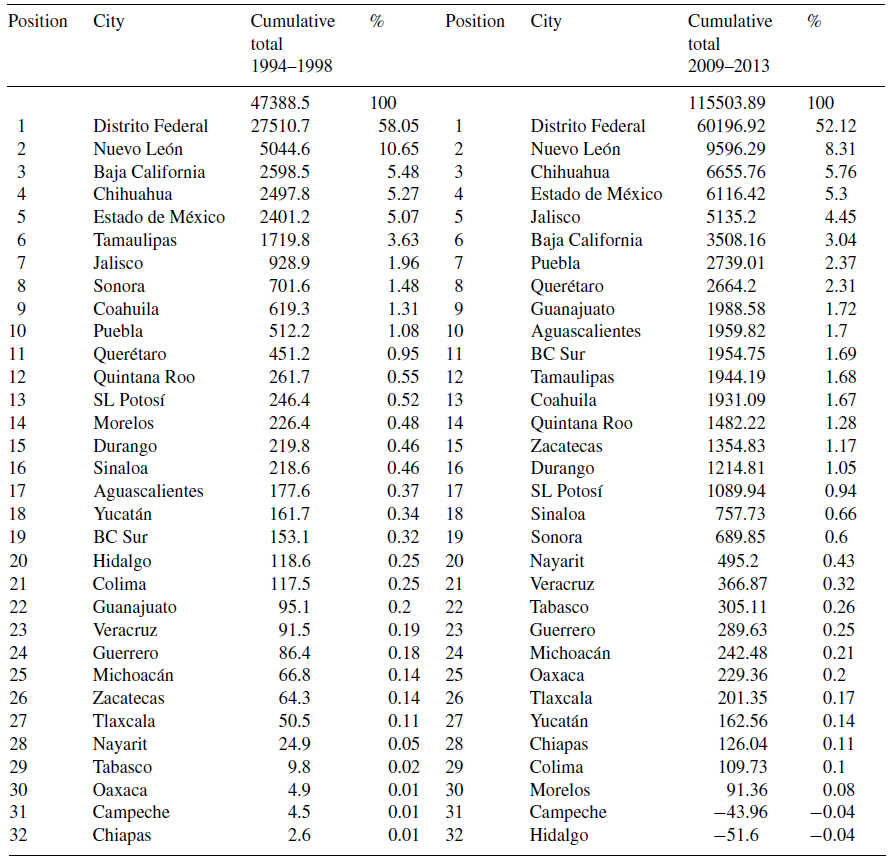
In this regard, in Table A1 (see Annexes), the foreign direct investment accumulated in the periods 1994-1998 and 2009-2013 is presented for comparative purposes. There, it can be appreciated that one single entity, Mexico City, consistently captured more than fifty percent of the FDI accumulated in both periods; followed, with a considerable gap, by Nuevo León, an entity that managed to capture 10.6 percent in the first period and with a small decrease in its participation, and 8.31 percent in the second period. Some entities have seen their attraction capability notoriously reduced; for example, Baja California reduced its participation from 5.48 to 3 percent, going down three positions in both periods. For its part, even though Tamaulipas has a small increase in the accumulated capture, its participation was reduced from 3.6 to 1.7 percent also in both periods. Notably, the state of Hidalgo has gone through a process of loss of FDI, which has caused an important decrease in its position as a receptor of the same.
It is important to mention that some states that are traditionally characterized by their low capability to attract FDI have slowly developed to a greater capture of FDI. This is the case of the states located at the south of the country, such as Chiapas and Oaxaca, whose accumulated capture of FDI increased 48 and 46 times, respectively, between both periods. Even in the state of Guerrero, which is better positioned than Chiapas and Oaxaca, the accumulated FDI triplicated in the same period of time (Table A1).
On the other hand, even though some entities have move forward and others have shrunk back in their capability to acquire FDI, the regional dynamic seems to be accompanied by a process of global divergence in the flows of FDI that enter the entities. Figure 2 shows that the value of the flow mean of regional FDI has resumed its ascending movement since 2011, placing itself at a higher level than during the first years of the 90s, which is consistent with the flow increase of the aggregated flow of the FDI observed in Figure 1. However, in Figure 2 we can also observe a growing dispersion of the regional FDI, expressed in the increase of the height of the bars as time goes by. In fact, the dark line that shows the evolution of the difference between the magnitude of the quantiles 75 and 25, suggest that even if the dispersion has fluctuated, its tendency is clearly ascendant.

Source: Own elaboration with INEGI information. Note: Figure 2 is similar to a boxplot. The light gray portion represents the magnitude of the quantile 75 as long as the dark gray portion represents the quantile 25, and both portions are divided by the median. A dark colored line was added, representing a scatter measure calculated as the difference between the magnitude of the quantile 75 and 25. Thus an increase of the difference implies an increase of the dispersion and viceversa.
Figure 2 Evolution of the dispersion of regional FDI in Mexico 1994-2013.
In this sense, the regional FDI is characterized by a broad geographical concentration, and even though some entities seem to have strengthened their capability to attract FDI (and others have debilitated), these efforts seem to induce a regional dispersion process that is accentuated with time, particularly since 2006 when global dispersion notably increased compared to previous years. However, a more complete analysis of the dynamic of the regional FDI requires the understanding of the transitions toward stages with higher levels (or lower levels) of acquisition, even considering the possible spatial interaction with other entities. In particular, the analysis of the dynamic is elaborated for the complete period from 1994 to 2013 and also for the sub-periods between the 1994 to 2005 and 2006 to 2013. The analysis by sub-periods helps identify the possible differences in the regional transition dynamic of the FDI, which could be associated to the rise in global dispersion since 2006.
Methodological aspects
In order to analyze the dynamic of the regional distribution of the foreign direct investment in Mexico, we resort to the Markov's chain approach. Unlike the traditional approaches that study the temporal dynamic of economic variables, e.g., the sigma convergence or beta convergence for the case of regional income, that offer limited information about the global behavior of the distribution of economic variables through time (Quah, 1993) and even the relative movement of the spatial units within the same distribution (Rey, 2001), Markov's chain approach offers a group of relevant analytical advantages. For example, Quah (1996) states that this approach helps to study the complete behavior of the distribution of the economic variables throughout time; likewise, Fingleton (1997) establishes that Markov's chain approach allows the incorporation of exogenous shocks and discontinuities (regime changes) in the analysis. Furthermore, Rey (2001) believes that this approach facilitates the inclusion of spatial effects, making it possible to analyze the temporal dynamic of the distribution that is conditioned to the spatial dimension.
Classic Markovian approach
The classic Markovian approach establishes that a stochastic approach has the Markov property if its distribution in a specific period of time t +1 depends only on its immediate distribution, in t, which means the future is explained solely by the present and not by the past. In particular, a Markov chain comprises three objects: a n-dimensional space state where the ei vector has a value of 1 in the i state and zero in the rest of the entries. A P transition matrix of n x n size that registers the probabilities of moving from one state to another within a period; and a π0 vector with a n x 1 size that indicates the probability of being in the i state in the initial 0 period. In this sense, and in short, the elements of the P transition probabilities matrix are described as: P ij = Prob(x t+1 = e j |x t = e i ) (Ljungqvist & Sargent, 2004).
Some relevant assumptions made with regard to the Markovian processes is that the P transition matrix is stochastic, meaning that the addition of the probabilities of the j columns for each i line in the P transition matrix is equal to 1, as is the addition of vector 7r0i throughout i. Similarly, it is assumed that the P transition matrix does not vary in time, that is to say, it complies with p t,i,j = m t+b,i,j for all of b.
It is worth noting that the analysis of the regional FDI in Mexico is particularly based on the P transition matrix which, under the assumption of invariability in time, presents two relevant properties: (1) it lets us know the average time in which a region can move from a state or class to another, and (2) parting from the limit of the transition matrix, lets us know the ergodic vector or stable state in the long term. Formally, the ergodicity property for P matrix indicated that
The spatial transition matrix
With the purpose of incorporating the spatial interaction in the analysis of the regional dynamic of FDI in Mexico, the focus of spatial Markov chains is implemented as proposed by Rey (2001). Specifically, the modification of the classic P transition matrix is used, which conditions the transition probabilities of a region to the initial state or class of its spatial lag, denominated spatial transition matrix.
This spatial version of the transition matrix takes into consideration spatial dependence in the form of spatial lag, i.e., it conditions the probability of a specific region of moving toward a state or class, to the state or class in which the neighboring regions initially found themselves in. This manner of incorporating the spatial interaction to the analysis of dynamic implies that matrix P no longer has a k × k dimension in its classic version in order to have a k × k × k dimension. According to Rey (2001), this spatial version allows the understanding of the influence that neighboring regions have in the advancement of a specific region from one state into another.
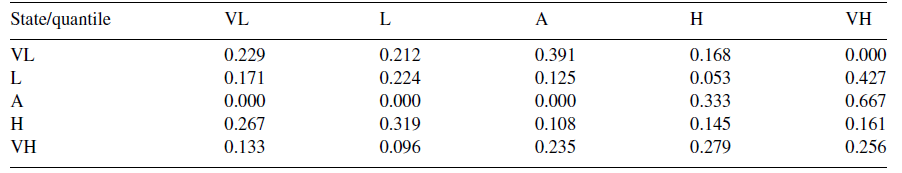
In order to clarify the elaboration and interpretation of the spatial transition matrix, its organization is described in Table 1. A matrix is assumed with k=5 states or classes, defined as very low (VL), low (L), average (A), high (H) and very high (VH). This definition corresponds to the number of mutually exclusive classes calculated through quantiles, and that in this study has the objective of distinguishing the capacity from the capture of regional FDI in the course of time. In particular, the notation PLL|L expresses the probability of a region advancing from a low (L) state or class to another also low (L) state or class within a given period of time, conditional that its neighboring regions were initially also part of a low (L) class or state. Similarly, the notation PLH|H indicates the probability of a region advancing from a low (L) state or class toward a high (H) state or class, conditional to interacting spatially with neighbors in a high (H) state or class.
Table 1 Hypothetical spatial transition matrix.
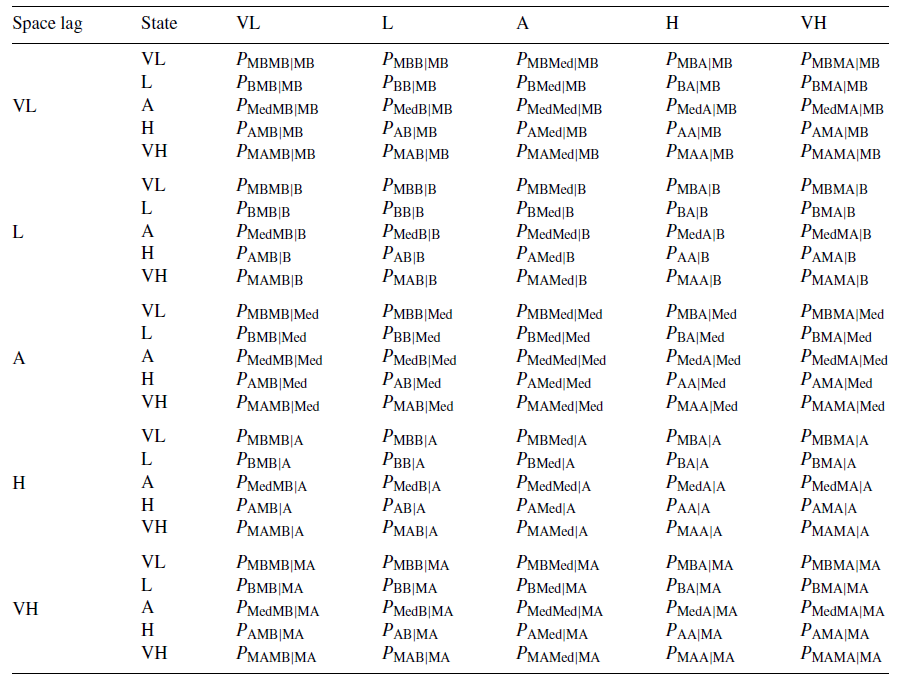
VL: very low; L: low; A: average; H: high; VH: very high.
Source: Authors based on Rey (2001).
In this sense, the spatial transition matrix expressed in detail the movement of a region toward higher or lower states or class in the course of time, taking into consideration the favorable or unfavorable influence of spatially interacting with regions in greater, inferior, or equal states or class.
Description of the databases
In the analysis of the regional dynamic of foreign direct investment, the flow of total FDI is used for each federative entity of Mexico with a yearly frequency from 1994 to 2013, obtained from the National Institute of Statistics, Geography and Information Technology (INEGI). Following the strategy proposed by Rey (2001), the FDI flows per entity relative to the average value were used in order to estimate the spatial transition matrix. Likewise, the number of federative entities and temporal data allowed us to calculate five states or classes through quantiles as suggested by Quah (1993), Rey (2001), and Wren and Jones (2010), so that each state/class represents the capture capacity of the FDI to which a federative entity can move toward within a period of time. Meanwhile, for the calculation of the spatial transition matrix, the spatial lag was obtained by preparing a first-order Queen-type spatial weight matrix, which captures the spatial interaction of a region with the immediate neighboring regions that touch any frontier or vertex.5 With this matrix, the FDI capture capacity of the adjacent neighbors to a specific entity is calculated as a weighted average between the FDI of said neighbors, in order to subsequently obtain the quantiles corresponding to the initial period.
Table 2 shows some characteristics of the regional FDI through basic statistics. For example, the regional average has increased approximately three times between 1994 and 2013; however, the dispersion measured through the standard deviation has also increased. These traits confirm the FDI behavior shown in Figure 2. In fact, this dispersal is reflected in the increase in absolute terms for the maximum and minimum FDI values captured by the federative entities of the country.

Dynamic of the regional FDI distribution in Mexico from 1994 to 2013
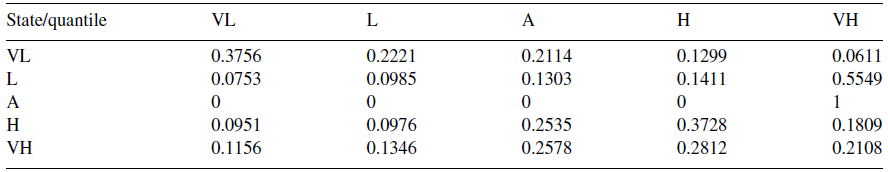
In this section, we analyze the spatial-temporal distribution of the foreign direct investment in Mexico for the full period of 1994 to 2013, using the transition probability matrix (P) described in the methodological section. Table 3 shows the global probabilistic transition matrix.6 Here, the elements in the main diagonal correspond to the probability that a region remains in its original class without moving toward a different class in a period of time, whereas the elements outside the main diagonal report the probability a region has of moving toward a different class.
Table 3 Probabilistic global transition matrix for regional FDI in Mexico, 1994-2013.

VL: very low; L: low; A: average; H: high; VH: very high.
Source: Own calculations with information from INEGI. Note: VPEE vector of stable state probabilities.
In particular, it is observed that the probability for a region to preserve their place in their original class is comparatively greater than the probability to move toward a new class, notably in the VL and VH classes where the regions with a lesser and greater capability for foreign investment attraction are located, respectively. That is to say, a region found within the group with a lesser capability for foreign direct investment attraction has a 56% probability to remain there, whereas a region located in the highest investment attraction level has an 85% probability to continue being highly attractive to foreign investors. For the rest of the classes, the probability for a region to remain in their original class/state is also high, although the probability to move toward a new level is not negligible (Table 3).
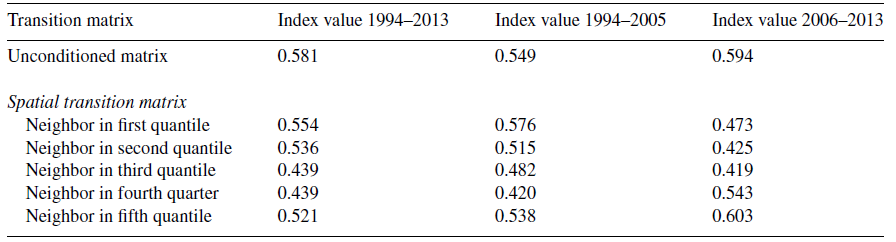
In this context, the spatial-temporal distribution of the foreign direct investment in Mexico has important implications regarding its dynamic, and particularly, its regional mobility. For example, the Shorrocks mobility index (1978) 7 calculated for the 1994-2003 period suggests a moderate regional mobility (Table A2). This global scenario of moderate regional mobility with the flow of foreign direct investment picks up the aforementioned fact that the regions with greater and lesser capability for foreign investment attraction have a high probability to continue with this characteristic, whereas the regions located in the intermediate classes have a not negligible probability of moving toward a new class. This suggests that the spatial-temporal dynamic of the foreign investment in Mexico is characterized by a regional divergence process. In fact, the stable-state probability vector indicates that in the long-term the spatial-temporal distribution will tend to be multimodal; in other words, the flows of foreign investment will be dispersed in the different classes/states. In this respect, we cannot appreciate a process of convergence toward the intermediate class although a relatively greater probability to concentrate in the highest class can be observed.
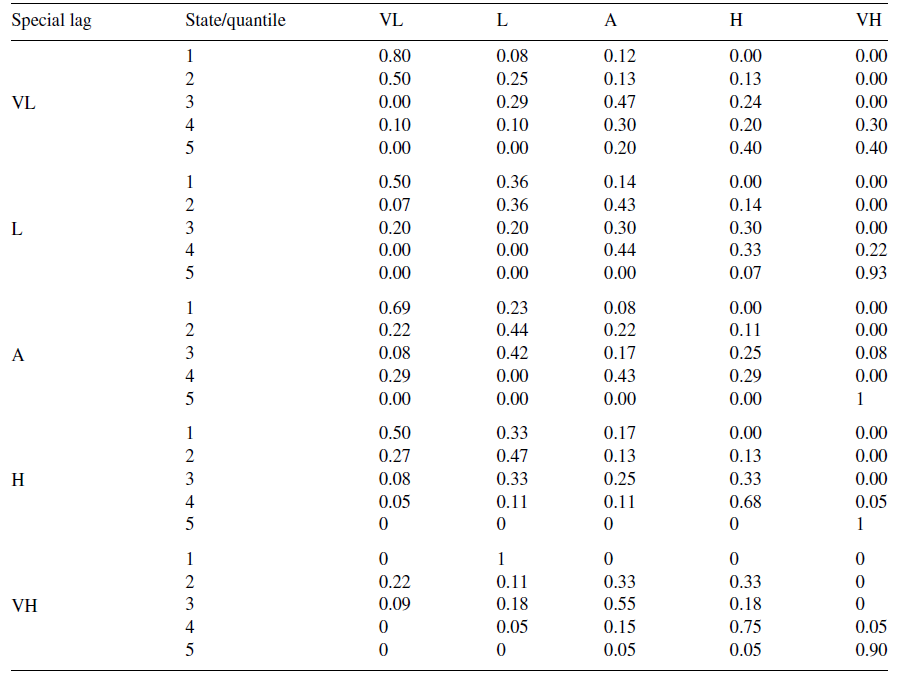
Table 4 shows the probabilistic transition matrix of the regional foreign direct investment conditioned to the spatial interaction with the neighboring regions. In the first block, we can see the spatial-temporal dynamic of the flow of the FDI of the regions spatially associated with neighboring regions in the VL class, i.e., with the least capability for foreign direct investment attraction. In particular, it can be observed that the probability for a region to remain in the VL class is notably high, at 63%, if it interacts spatially with regions initially located in said VL class.
Table 4 Spatially conditioned probabilistic transition matrix for regional FDI in Mexico, 1994-2013.

VL: very low; L: low; A: average; H: high; VH: very high.
Source: Data calculated by the authors with information from INEGI.
Likewise, it highlights the case of the regions located in the group with greater capability for foreign investment attraction (VH) that interacts spatially with regions located in the VL class; in this case, the probability of remaining in the group of the regions with greater capability to attract investment is of 50%, with a 25% probability to descend to classes with a lower capability for attraction. This result clashes with the 85% probability to remain in the group with highly receptive regions as observed in Table 3, when the transition process was not conditioned to the spatial interaction with the neighboring regions.
In this regard, the results suggest that not only does the inclusion of the spatial interaction in the spatial-temporal distribution of the foreign direct investment in Mexico offer a picture of the regional dynamic that differs from the analysis not spatially conditioned, but also that the regional dynamic differs with regard to the spatial association in each of the classes.
In particular, Table 4 shows that in the last block, the probability for a region to remain in the group with least capability for foreign investment attraction (class VL) is of 37% when considering the interaction with neighboring regions that belong to the group with greater capability for foreign investment attraction (class VH), and it can even be observed that it has a 50% probability to move toward a higher class. On the other hand, the probability to remain in the group of regions with greater capability for foreign investment attraction (class VH) is of 83% when the interaction with neighboring regions also in class VH is considered. Regarding the regions in class L, they have a 46% probability to move toward class A when the interaction with neighboring regions in class VH is considered. Although, in the case of regions in classes A and H, the probabilities of 43 and 59%, respectively, suggest a low mobility toward other classes.
In this sense, the transition dynamic of the regional FDI differs when it is conditioned to the spatial interaction with regions located in the classes with least or greater capability for investment attraction. In the case of the regions that interact with neighbors that are highly attractive to foreign investors, it can be appreciated that the regions with a low capability for attraction (classes VL and L) have a probability to move toward higher classes, and that in the higher classes (A, H, and VH), the probability to continue being an attractive region for foreign investors is high, particularly when they are in class VH. This trait contrasts with the dynamic observed when the interaction occurs with neighboring regions that have a low capacity for investment attraction, where the regions find difficulties in moving toward higher classes/states or even lose the capacity to attract foreign investment.
The aforementioned suggests that the regions that interact with highly attractive regions have a greater probability to increase their capability for attraction, also due to the presence of a favorable spatial diffusion process. The opposite appears to occur when there is a spatial association with regions less attractive for investment due to the possible presence, in this case, of unfavorable spatial diffusion processes.
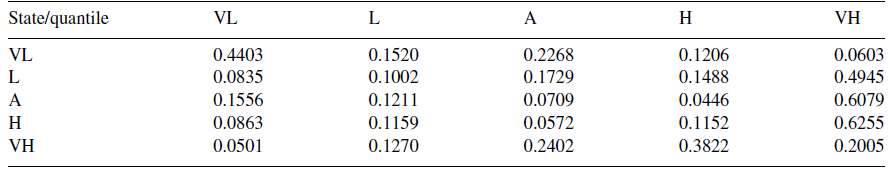
Table 5 shows the spatial-temporal distribution in the stationary state for each of the transition matrices conditioned in accordance to the corresponding class/state. The evidence indicates that the spatial-temporal dynamic, when the regions interact with neighbors that are unappealing for foreign (class VL), tends toward a divergence process, without there being an observed convergence toward the intermediate class. In fact, it suggests that in the long term the divergence is characterized by a greater probability to belong to the VL class and a low probability to belong to the VH class, which is not surprising when it is observed that some regions can even move toward groups of regions with less capability for attraction. In this case, the Shorrocks index is the highest for this block in comparison with the rest, and although the index suggests a moderate mobility, the distribution in the stable state implicates that it is not accompanied by a convergence process (Table A2).
Table 5 Spatially conditioned long-term stable state probabilities for regional FDI in Mexico, 1994-2013.
VL: very low; L: low; A: average; H: high; VH: very high.
Source: Data calculated by the authors with information from INEGI.
Regarding the regions that interact with neighboring regions that are highly attractive for foreign investment (class VH), the multimodal distribution in the stable-state vector suggests the presence of a divergence process in the long term, although a relatively greater concentration can be appreciated in the classes A, H and VH, as the result of the high probability that the regions located in the classes VL and L have in moving toward higher classes. It calls to attention that when the spatial interaction occurs with neighboring regions located in the intermediate A class, a unimodal distribution can be observed in class VH, which suggests a regional convergence process (Table 5).
Dynamic of the regional distribution of the FDI in Mexico in the sub-period of 1994-2005
The dynamic of the spatial-temporal distribution of the foreign direct investment in Mexico for the period of 1994-2005 is characterized by a moderate regional mobility, though less when compared with the complete period of analysis; in this period, the global Shorrocks regional mobility index is of 0.54 (Table A2). In particular, the global transition matrix of probabilities in Table 5 suggests that during this period, the probability for the regions located in the groups of less and greater capability for foreign investment attraction (classes VL and VH) remaining in their original location is greater than during the complete period of analysis, with 62 and 92%, respectively.
On the other hand, for the rest of the regions located in classes L, A and H, the probability to remain in their original location is greater than the probability to move toward new levels of foreign investment attraction. However, the probabilities of moving toward a new class are not small and in some cases suggest a transition toward classes with lesser capture. For example, the regions in class A have a 30% probability of remaining in this class, although there is also a 28% probability of moving toward class L, a similar situation for the regions in class H. In this sense, the lesser regional mobility indicated by the Shorrocks index is justified. For its part, the VPEE suggests that in the long term the spatial-temporal distribution is carried out by a divergence process with a greater concentration in the distribution extremes (classes L and VH) (Table 6).
Table 6 Probabilistic global transition matrix for regional FDI in Mexico, 1994-2005.

VL: very low; L: low; A: average; H: high; VH: very high.
Source: Authors’ own calculations with information from INEGI. Note: VPEE vector of stable state probabilities.
For its part, the analysis of the transition matrix, when the spatial interaction with neighboring regions is considered, suggests that the regions spatially associated with class VL regions have an 80% probability of remaining in the VL class. On the other hand, the regions with a high capability for foreign investment attraction (class VH) have a 40% probability of remaining in this class and even a similar probability of moving toward lower classes. A similar situation occurs with the regions located in classes L and H, with a greater probability of moving toward the class immediately below them than remaining in their original location. In this case, the regional dynamic of the foreign direct investment is similar to that observed for the complete period of analysis; when the spatial interaction with neighboring regions have a low capacity for foreign investment attraction, the probability to remain or move toward classes with lesser capacity seems to increase (Table 7).
Table 7 Spatially conditioned probabilistic transition matrix for regional FDI in Mexico, 1994-2005.
VL: very low; L: low; A: average; H: high; VH: very high.
Source: Authors’ own calculations with information from INEGI.
The opposite occurs when the regions are specially associated with neighboring regions located in class VH. In this case, a moderate mobility can be observed, when the regions in class VL have a 100% probability of moving toward class L, and the regions in class L have a 33% probability of advancing toward classes A and H, whereas the regions in classes A, H and VH have a high probability of remaining in their original locations. In this sense, it can be observed that the spatial interaction with regions highly attractive for foreign investment appears to favor the transition toward greater levels of investment attraction while the opposite process would occur when the interaction takes place with regions in class VL, which would indicate the presence of possible spatial diffusion effects (Table 7).
Table 8 shows the spatial-temporal distribution of the foreign investment of stable state. In this case, the evidence suggests that the dynamic is accompanied by a divergence process due to there being no observed tendency toward concentration in the intermediate classes. However, as the spatial association occurs with regions highly attractive for foreign investment, the probability to belong in the long term to a group of regions with greater capability of attraction is also greater.
Table 8 Spatially conditioned long-term stable state probabilities for regional FDI in Mexico, 1994-2005.
VL: very low; L: low; A: average; H: high; VH: very high.
Source: Authors’ own calculations.
For example, the regions associated with neighbors that belong to classes L, A and H have probabilities of 49, 60 and 62%, respectively, of moving toward the group of regions in class VH.
Dynamic of the regional distribution of the FDI in Mexico in the sub-period of 2006-2013
The transition dynamic of the regional foreign direct investment during the period of2006-2013 shares similar traits with the dynamic of the previous period, although some particularities are seen in Table 9. For example, in this period, the probability of a region located in class VL to move toward class L is notably greater, whereas the regions located in class B have a high probability of moving toward class VL. The probability of remaining in class VH has decreased, but it is still elevated at 78%. In this sense, although the dynamic is characterized by greater regional mobility as suggested by the Shorrocks index (Table A2), the divergence process continues to be a common trait. In this respect, the stable-state probabilities suggest a multimodal distribution with a slightly greater concentration at the extremes, moving away from a convergence process toward the intermediate class.
Table 9 Probabilistic global transition matrix for regional FDI in Mexico, 2006-2013.

VL: very low; L: low; A: average; H: high; VH: very high.
Source: own calculations with INEGI information. Note: VPEE vector of stable state probabilities.
In regard to the transition conditioned to the interaction with the neighboring regions, some particularities are also observed. In the case of the regions that interact with neighbors that belong to class VL, it can be appreciated that during this period there is a high probability of moving from class VL to class L, and with the exception of the regions located in class B, which have a high probability of moving toward class VL, it stands out that the probability in the main diagonal of the global matrix is notably high, which implies that the mobility toward groups of regiones with less capability of attraction is less probable in comparison with the period of 1994-2005 (Table 10). However, in the long-term the dynamic suggests a divergence process due to the multimodal distribution, although in this period the probability of moving in the long-term toward an intermediate class is greater, when the interaction occurs with neighboring regions located in class VL (Table 11). On the other hand, when the interaction occurs with neighboring regions located in the VH class, a notable mobility can be observed in the regions located in class VL (Table 10), in fact, the Shorrocks index is the highest with 0.60 (Table A2).
Table 10 Spatially conditioned probabilistic transition matrix for regional FDI in Mexico, 2006-2013.

VL: very low; L: low; A: average; H: high; VH: very high.
Source: Own calculations with INEGI information.
Table 11 Spatially conditioned long-term stable state probabilities for regional FDI in Mexico, 2006-2013.
VL: very low; L: low; A: average; H: high; VH: very high.
Source: Own calculations.
In the long term, the dynamic of the foreign direct investment is characterized by a generalized divergence process in which the regions that interact spatially with neighbors located in classes VL, L and A have a high probability of moving toward greater classes in said cases, whereas the regions that interact with neighbors in classes H and VH have a significant probability of moving toward a lower class. A trait that contrasts with the divergence process was observed in the previous period, such that in the first period the long-term divergence appears to be driven mainly by the forward transition of the regions that interact with neighbors in classes L, A and H, whereas the divergence in the second period appears to also be driven by the forward transition of regions that interact with neighbors in classes VL, L and A.
Conclusions
The implementation of regulatory reforms with the purpose of motivating the flow of foreign direct investment in the country reflects the importance that the governmental authorities have historically attributed to this asset as a means to boost the national economic progress. In fact, various national and international studies have found empirical evidence that supports this economic policy vision, so that there is reason to believe that the promotion policies for the capture of foreign direct investment will continue to be an important part of the economic development plans in Mexico.
Framed in the national economic policy, the federative entities in Mexico have gotten involved in a national competition to attract the greatest quantity of flows of foreign investment, with diverse results. In this sense, some entities have had greater success than others; such is the case of Mexico City and Nuevo León, which concentrate approximately 60% of the foreign direct investment accumulated in recent years. In turn, some entities such as Chiapas, Oaxaca, Tabasco, Nayarit and notably Zacatecas have made important efforts that have led to an increase in their capacity of FDI attraction. However, the long-term picture suggests that under the current conditions to attract regional foreign direct investment, the regional concentration and divergence is a highly probable scenario.
The analysis of the spatial-temporal evolution of the foreign direct investment, through the calculation of the transition probabilities matrix, suggests that the regional divergence in the capture of this asset is a process that seems to become stronger when the different cuts in time are analyzed. In fact, when the dynamic is conditioned to the spatial interaction, it can be observed that in the first period of 1994-2005, the divergence process appears to be driven by a transition toward classes of greater capture when interacting with states located in classes L, A and H, whereas in the most recent period, from 2006 to 2013, the divergence process toward greater classes would be driven by the regions that interact with neighbors in the lesser classes VL, L and A.
In this context, the fact that the dynamic of the foreign direct investment is characterized by a solid regional divergence process implies reflecting on the final objective of the reforms that promote the capture of foreign direct investment. It seems clear that the reforms and the derived economic policy that promotes the capture of foreign investment must be accompanied not only by a sectoral vision, but also by a regional vision that promotes the creation of incentives and conditions in order to motivate the localization of foreign investment in regions with limitations for its capture, with the objective of reducing the divergence process in the capture of foreign investment and to foster a less unequal regional economic progress.
REFERENCES
Airola, J. (2008). A regional analysis of the impact of trade and foreign direct investment on wages in Mexico, 1984-2000. Review of Development Economics, 12(2), 276-290. http://dx.doi.org/10.1111/j.1467-9361.2008.00428.x. [ Links ]
Carrillo, J. (2000). Las maquiladoras de exportación en México: evolución industrial, aglomeraciones y seguridad e higiene. Documento preparado para el Proyecto de Mejoramiento de las Condiciones de Empleo en la Industria Maquiladora financiado por la STyPS. [ Links ]
Carrillo, J. (2001). Maquiladoras de exportación y la formación de empresas mexicanas exitosas. En E. Dussel (Ed.), Claroscuros, integración exitosa de las pequeñas y medianas empresas en México .. México: CEPAL y editorial JUS, 2001. [ Links ]
Cuevas, A., Messmacher, M. y Werner, A. (2005). Foreign direct investment in Mexico since de approval of NAFTA. The World Bank Economic Review, 19(3), 473-488. [ Links ]
De la Cruz, J., Canfield, C. y González, P. (2009). Economic growth, foreign direct investment and international trade: evidence on causality in the Mexican economy. Revista Brasileira de Economia de Empresas, 9(1), 1-17. [ Links ]
Díaz-Bautista, A. (2006). Foreign direct investment and regional economic growth considering the distance to the northern border of Mexico. Análisis Económico, XXI(46 ), 355-367. [ Links ]
Domínguez, L. y Brown, F. (2004). Inversión extranjera directa y capacidades tecnológicas. pp. 1-63. CEPAL. [ Links ]
Dussel, E. (2000). La inversión extranjera en México. pp. 1-103. Chile: Serie desarrollo productivo CEPAL. [ Links ]
Dussel, E., Galindo, M., Loría, E. y Mortimore, M. (2007). Inversión extranjera directa en México: desempeño y potencial. México: Siglo XXI, UNAM y Secretaría de Economía. [ Links ]
Escobar, O. (2013). Foreign direct investment (FDI) determinants and spatial spillovers across Mexico's states. The Journal of International Trade and Economic Development, 22(7), 993-1012. http://dx.doi.org/10.1080/09638199.2011.624190. [ Links ]
Ernst, C., Berg, J. y Auer, P. (2007). Retos en materia de empleo y respuestas de política en Argentina, Brasil y México. Revista de la CEPAL, 91, 95-110. [ Links ]
Fingleton, B. (1997). Specification and testing of Markov chain models: an application to convergence in the European Union. Oxford Bulletin of Economics and Statistics, 59(3), 385-403. http://dx.doi.org/10.1111/1468-0084.00072. [ Links ]
García, R. (2001). La maquila y la inversión extranjera directa en México. ICE: Revista de Economía no, 795, 127-140. [ Links ]
Juárez, C. y Ángeles, G. (2013). Foreign direct investment in Mexico. Determinants and its effects on income inequality. Contabilidad y Administración, 58(4), 201-222. http://dx.doi.org/10.1016/S0186-1042(13)71239-7. [ Links ]
Kumar, N. (2003). Use and effectiveness of performance requirements: What can be learnt from the experiences of developed and developing countries? En UNCTAD Secretariat (2003). The development dimensión of FDI: policy and rule-making perspectives. New York and Geneva: United Nations. [ Links ]
Lichtensztejn, S. (2012). La inversión extranjera directa en México 1980-2011. México: Universidad Veracruzana. [ Links ]
Ljungqvist, L. y Sargent, T. (2004). Recursive macroeconomic theory. US: The MIT Press. [ Links ]
Mejía, P. (2005). La inversión extranjera directa en los estados de México: evolución reciente y retos futuros. Economía, Sociedad y Territorio Edición especial, (99), 185-236. [ Links ]
Mendoza, J. (2011). Impacto de la inversión extranjera directa en el crecimiento manufacturero de México. Problemas del desarrollo. Revista Latinoamericana de economía, 167(42), 45-69. [ Links ]
Oladipo, O. (2007). Foreign direct investment and growth in Mexico: an empirical investigation. Proceedings of the Northeast Business and Economics Association, 32, 87-91. [ Links ]
Oladipo, O. y Vázquez, B. (2009). The controversy about foreign direct investment as a source of growth for the Mexican economy. Problemas del desarrollo. Revista Latinoamericana de economía, 40(158), 91-112. [ Links ]
Quah, D. (1993). Empirical cross-section dynamics in economic growth. European Economic Review, 37(2), 426-434. [ Links ]
Quah, D. (1996). Empirics for economic growth and convergence. European Economic Review, 40(6), 1353-1375. http://dx.doi.org/10.1016/0014-2921(95)00051-8. [ Links ]
Rey, S. (2001). Spatial empirics for economic growth and convergence. Geographical Analysis, 33(3), 195-214. http://dx.doi.org/10.1111/j.1538-4632.2001.tb00444.x. [ Links ]
Romo, D. (2003). Derramas tecnológicas de la inversión extranjera en la industria mexicana. Comercio Exterior, 53(3), 230-243. [ Links ]
Romero, J. (2012). Inversión extranjera directa y crecimiento económico en México, 1940-2011. Investigación Económica, LXXI(282), 109-147. [ Links ]
Romero, J. (2014). Los límites al crecimiento económico de México. México: El Colegio de México. [ Links ]
Shorrocks, A. (1978). The measurement of mobility. Econometrica, 46(5), 1013-1024. [ Links ]
UNCTAD Secretariat. (2003). The development dimensión of FDI: policy and rule-making perspectives. New York and Geneva: United Nations. [ Links ]
UNCTAD. (2013). World investment report. Global value chains: investment and trade for development. New York and Geneva: United Nations. [ Links ]
UNCTAD. (2014). World investment report. Investing in the SDGs: an action plan. New York andGeneva: United Nations . [ Links ]
Valdivia, M. (2008). Desigualdad regional en el centro de México. pp. 5-34. Una exploración espacial de la productividad en el nivel municipal durante el periodo 1988. 2003 (13) Investigaciones regionales No. [ Links ]
Vera-Cruz, A., Dutrénit, G. y Gil, J. (2005). Derramas de la maquila en un sector de pequeñas y medianas empresas proveedoras. Comercio Exterior, 55(11), 970-986. [ Links ]
Vergara, R., de Jesús, L. y Carbajal, Y. (2015). IED y empleo en la región norte de México, 2004.1-2013.4 Un análisis para el sector industrial. Equilibrio Económico, II(1), 65-94. [ Links ]
Waldkirch, A. (2010). The effects of foreign direct investment in Mexico since NAFTA. The World Economy, 33,710-745. http://dx.doi.org/10.1111/j.1467-9701.2009.01244.x. [ Links ]
Wren, C. y Jones, J. (2010). FDI location across British regions and agglomerative forces: a Markov analysis. Spatial Economic Analysis, 7(2), 265-286. http://dx.doi.org/10.1080/17421772.2012.669492. [ Links ]
*The authors want to acknowledge the observations of two anonymous judges, which were useful in the improvement of the document.
1In this investigation a federative entity is considered a region, so that in the text both terms are used interchangeably.
2In the case of Mexico, Valdivia (2008) analyzes the transition dynamic of the municipal labor productivity in central Mexico through different alternative methodologies, one of them based on the classic and spatial Markov's chain approach.
3According to Lichtensztejn (2012), the elevated volume of FDI registered in 2001 is related to the sale of Banamex to Citibank.
4The recovery of the FDI flow acquired in Mexico during the year of 2013 is consistent with the global recovery of the FDI recorded by the UNCTAD (2014), the report of which established a slow recovery expectation toward 2016 with global FDI levels in 2014, barely above the ones recorded in 2013.
5The analysis of the spatial transition of the FDI follows the proposal by Rey (2001) of using a Queen type spatial weight matrix. Formally, matrix W describes the interaction between a federative entity i and the neighboring entities j, where j = 1,...,N, with i ≠ j, assuming that ≤ W ij ≤ 1 with W ij = 0 if i = j. Furthermore, Σw ij = 1 is satisfied. There are other contiguity criteria, however, the Queen type matrix has the advantage of modeling the spatial interaction with greater flexibility when a neighboring entity j touches any frontier or vertex of entity i.
6The global probabilistic transition matrix is obtained calculating the quantiles for the information grouped through time and space (pooling).
7The mobility index proposed by Shorrocks (1978) offers a global measure of the regional mobility of a specific economic variable. The index takes values between zero and one, with a value close to one (zero) indicating a high (low) regional mobility. The calculation is carried out based on the formula: m = n — tr(P)/n — 1 where n is the number of classes/states and tr is the trace of the transition matrix P.
Received: January 22, 2015; Accepted: September 14, 2015
 Este es un artículo publicado en acceso abierto bajo una licencia Creative Commons
