


 nova página do texto(beta)
 Inglês (pdf)
 Artigo em XML
 Referências do artigo
 Enviar este artigo por email
 Citado por SciELO
  Similares em
SciELO
Similares em
SciELO 
 Permalink
JEL classification: F15; F21; F22; H11; H51; H52; H53
Introduction
Since the mid-1990s, the Mexican economy has been exposed to significant supply and demand shocks, first with the start of NAFTA in January 1994, and then with the devaluation of the Mexican peso in December of that same year. On the positive side, as a result of NAFTA, Mexico's total trade to GDP ratio increased from 34% in 1993 to 64% in 2000. Foreign Direct Investment (FDI) inflows went from 4.3 billion U.S. dollars in 1993 to 10.9 billion U.S. dollars in 1994. Between 1994 and 2006, Mexico received more than 217 billion U.S. dollars in FDI (totaling around 40% of its GDP). Nevertheless, following the devaluation of the Mexican peso, in 1995 inflation surpassed 50% and real GDP fell by 6%. In terms of international migration, and as a result of considerable job losses, the net outflow of people rose from 412 thousand in 1993 to 625 thousand by the year 2000; this is roughly about 0.5% of Mexico's total population each year.1 All these shocks have had positive and negative effects on the aggregate economy which are considerably difficult to manage at the regional level.
According to the so-called “compensation hypothesis” proposed by Rodrik (1998), a more open economy requires a larger government capable of attenuating the effects of externally generated economic instability, which in turns prompts the demand for social security. In spite of the importance that this relation has for developing countries, only a few studies have examined it at the subnational level or by employing alternative non-trade-related openness measures more suitable for developing economies. This paper revisits the role of openness in the size of government across Mexican states and proposes the use of alternative measures of international capital and labor mobility as proxies for openness rather than more traditional trade-related measures.
We feel that the assessment proposed here is important for economic development and contributes to the existing literature in at least three important ways. First, ever since the seminal papers by Rodrik (1998) and Alesina and Wacziarg (1998), the literature has mostly employed total trade and trade volatility measures as proxies for openness in order to assess their relation to government size. While these measures are important in assessing the degree of openness of any economy, developing countries have been exposed to openness—traditionally and in recent years—in different ways than industrial economies.2
Historically, many developing countries have been significantly more exposed to the openness of their labor market, by means of legal and illegal immigration, than to trade. In Mexico, for instance, trade openness started in 1985 when the country joined the General Agreement on Tariffs and Trade (GATT). However, labor openness, in the form of international legal and illegal migration, came into existence much earlier.3 Throughout international migration, the labor market has worked as a buffer or shock-absorber device for many developing economies engaged in market liberalization, including Mexico (Robertson, 2000). Moreover, trade openness is usually accompanied by financial openness and, in recent years, emerging markets have benefitted greatly from the latter. Particularly since the early 1990s, foreign direct investment has played a major role in the development of several developing economies.4 For instance, in the case of Mexico, Ramirez (2006) documents gains in labor productivity arising from FDI flows.
While the studies relating government size to capital flows are not many, recently Gemmell, Richard, and Sanz (2008) have employed the inward stock of FDI as a proxy for openness across a sample of OECD economies. They explore the effects of these flows on government spending and find that inward FDI does not affect the size of government spending but that it affects its composition by shifting it toward social spending. Also, Kimakova (2009) explores this alternative dimension of openness across a sample of 87 emerging and industrial economies. She finds that trade alone does not capture some of the important elements that characterize the modern international economy and observes a statistically significant and strong positive relation between government size and financial openness.
In the absence of reliable trade statistics at the state level for Mexico, we employ two alternative proxies of openness: FDI flows and international migration rates. As far as we know, no proxies for openness associated with the labor market have been previously employed in the literature that studies the determinants of government size. In our analysis states with higher migration flows are not necessarily more open to trade or FDI. Instead, the idea is that more open states are more exposed to foreign shocks and, as a result, are the source of more migration. While different in nature to FDI and other previous proxies for openness employed in the literature, in our model variations in the rate of international migration captures the effects that openness has on, for instance, employment in Mexican regions. Henceforth, along with FDI flows, international migration controls for the effects of shocks linked to distortions affecting the capital and labor markets.
Second, there are only a few studies analyzing the effects of openness on subnational government size. To the best of our knowledge, this relation has only been observed in the case of a few industrial economies. Pickup (2006), for instance, examines the relation between trade openness and the magnitude of government spending in Canadian provinces conditional on variables such as the ideology of the government and the degree of provincial unionization. He finds that, while differences arise according to those two conditional variables, the traditional compensatory response to trade openness has been the norm across Canadian provinces. Balle and Vaidya (2002) explore the relation between trade openness and government size across US states. They find that spending in public welfare and health services is positively affected by the degree of the state's openness. Similarly, Fatas and Mihov (2001) examine the relation between government size and output volatility across US states and find that states with larger governments are exposed to lower output volatility. As far as we know, our study is the first that analyzes the relation between government size and openness across the states of a developing economy.5
The analysis of developing countries is particularly relevant because they are fundamentally different from industrial economies. In general, developing economies possess smaller governments and are more open to trade and capital flows than developed economies (Mollick, Cabral, & Carneiro, 2011). Fiscal policies in developing countries have also different characteristics than in industrial economies. In general, governments in developing countries have a smaller tax base, tend to be more centralized and to depend more on central government transfers. In Mexico, for instance, between 2005 and 2010 states received more than 85% of their total revenue in the form of intergovernmental transfers and their own revenue was less than 7% of their total revenue (Abbott, Cabral, Jones, & Palacios, 2015).
Third, this study builds on recent literature that not only looks at the government size-openness relation but also accounts for the link between these two variables and the size of a country, as proposed by Alesina and Wacziarg (1998). In his seminal paper Rodrik (1998) argues that more open economies need larger governments in order to respond to ‘external shocks’ and stabilize their economies. Alesina and Wacziarg (1998) cast doubt on Rodrik's argument and point out two important causal relations linking openness to government size. According to them, due to economies of scale, the larger a country, the lower its per capita government expenditures; consequently, small economies need larger government spending. At the same time, the smaller a country, the greater the incentives for it to be and remain open in order to gain access to larger markets abroad. As a result of these two underlying forces, more open economies tend to have bigger governments. We start our empirical analysis following the estimation of a parsimonious set of equations proposed by Ram (2009) to evaluate those three causal relations anticipated by Alesina and Wacziarg (1998). Thereafter, we build a more comprehensive model to explore the relationship between government size and openness controlling for several important factors including country size.
Having those underlying relations in mind, we employ a panel comprising all the 32 Mexican subnational entities over the period 1996-2006 and make use of two alternative measures of international capital and labor mobility to assess the relation between openness and government size. Following the estimations, we find some interesting results. First, using the parsimonious set of equations proposed by Ram (2009), we confirm the negative association between country size and both government size and openness. We also find systematic positive effects of our openness measures on the size of the states’ total government spending. Second, despite accounting for country size and other traditional determinants of government size, a more comprehensive model confirms the positive association between the latter variable and openness. These two results suggest that while the underlying relations pointed out by Alesina and Wacziarg (1998) exist, they are not producing the expected positive relation between openness and government size. Third, focusing on three subcategories of spending associated with social welfare (education, health and poverty alleviation programs), we observe that FDI flows are only a weak determinant of states’ social spending, while labor openness, in the form of international migration, has a significant and even more important impact on some of these categories than on total spending.
The rest of this paper proceeds as follows. The following section describes the data employed in the empirical analysis and presents some descriptive statistics. The third section explains the empirical methodology used and the fourth section reports our empirical results. Final section presents the main conclusions and implications of this paper.
Data
Our data set comprises information of all the 32 Mexican subnational entities (31 states and its capital) for the years between 1996 and 2006. The sample looks at a relatively stable period, it avoids using the years prior to 1995, in which an important domestic crisis took place, as well as the global financial crisis years, which also had important repercussions for the Mexican economy. Government expenditure is taken from the database Estadísticas de las Finanzas Públicas Estatales y Municipales published by Mexico's National Institute of Geography and Statistics (INEGI). Only the subcategories of expenditure, employed in the robustness check section, are available since 1998, for 3 of the categories, and since 1999, for one of them. In building output, density, dependency ratios and urban population, the main source of our data is INEGI. For international migration rates and population figures we use data from the National Population Council (CONAPO). Finally, FDI figures were obtained from the Mexican Ministry of Economy.
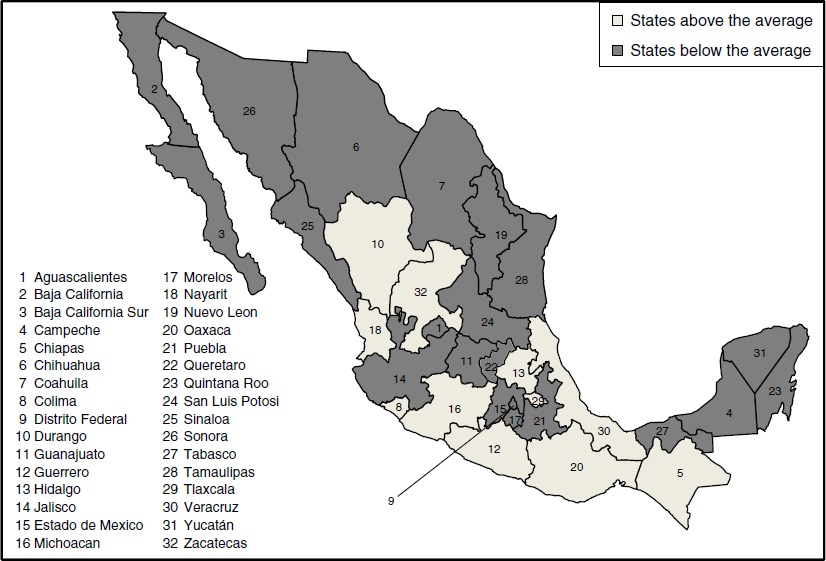
Tables 1 and 2 present some descriptive statistics and correlations for the main variables of our model. The average government spending to GDP ratio is 0.118, the highest ratios are in the southern states of Tabasco (0.25), Oaxaca (0.24) and Chiapas (0.21), while the lowest ratios are observed in the capital of Mexico, Distrito Federal (0.052), Coahuila (0.068) and Nuevo Leon (0.069). Output per capita, the first control variable in the model, observes a strong negative correlation with government expenditure (correlation coefficient of −0.57). Indeed, we observe that the two entities with the lowest government spending to GDP ratios are also those that possess the highest GDP per capital, Distrito Federal (36,000) and Nuevo León (25,641) and that two of the three entities with the highest GDP ratios are among those with the lowest GDP per capita, Oaxaca (6163) and Chiapas (6237).6 These figures might suggest that government spending has been oriented toward the improvement of social welfare in relatively less developed states. Figure 1 shows the geopolitical allocation of government expenditure. It is clear from the picture that states with a lower than average expenditure is mainly located in the south and center of Mexico. Interestingly, none of the states on the northern border poses a higher than average expenditure.
Table 1 Subnational descriptive statistics.
| ID | State | Government spending to GDP ratio | Output per capita | FDI to GDP ratio | Population (thousands) | International migration rate | Density (people per km2) | Proportion of urban population |
|---|---|---|---|---|---|---|---|---|
| 1 | Aguascalientes | 0.078 | 17,627 | 0.012 | 987 | 0.437 | 187 | 0.820 |
| 2 | Baja California | 0.099 | 19,005 | 0.051 | 2483 | −0.194 | 35 | 0.870 |
| 3 | Baja California Sur | 0.114 | 18,353 | 0.041 | 453 | 0.348 | 6 | 0.666 |
| 4 | Campeche | 0.105 | 23,062 | 0.002 | 716 | 0.371 | 13 | 0.545 |
| 5 | Chiapas | 0.214 | 6273 | 0.000 | 4072 | 0.225 | 55 | 0.316 |
| 6 | Chihuahua | 0.070 | 20,546 | 0.035 | 3087 | 0.721 | 13 | 0.772 |
| 7 | Coahuila | 0.068 | 20,432 | 0.011 | 2378 | 0.416 | 16 | 0.899 |
| 8 | Colima | 0.120 | 15,036 | 0.003 | 536 | 0.541 | 98 | 0.797 |
| 9 | Distrito Federal | 0.052 | 36,000 | 0.086 | 8716 | −0.052 | 5700 | 1.000 |
| 10 | Durango | 0.110 | 12,746 | 0.009 | 1483 | 0.975 | 12 | 0.601 |
| 11 | Guanajuato | 0.085 | 11,140 | 0.005 | 4783 | 1.157 | 154 | 0.662 |
| 12 | Guerrero | 0.177 | 7666 | 0.002 | 3122 | 1.142 | 48 | 0.445 |
| 13 | Hidalgo | 0.140 | 8872 | 0.002 | 2294 | 1.014 | 111 | 0.461 |
| 14 | Jalisco | 0.077 | 14,301 | 0.015 | 6483 | 0.597 | 82 | 0.769 |
| 15 | México | 0.090 | 11,627 | 0.018 | 13,100 | 0.320 | 609 | 0.871 |
| 16 | Michoacán | 0.132 | 8497 | 0.001 | 4023 | 1.626 | 68 | 0.497 |
| 17 | Morelos | 0.098 | 13,153 | 0.012 | 1553 | 0.818 | 312 | 0.788 |
| 18 | Nayarit | 0.196 | 8720 | 0.015 | 939 | 1.315 | 35 | 0.555 |
| 19 | Nuevo León | 0.069 | 25,641 | 0.048 | 3958 | 0.309 | 61 | 0.919 |
| 20 | Oaxaca | 0.236 | 6163 | 0.000 | 3512 | 1.067 | 38 | 0.275 |
| 21 | Puebla | 0.107 | 9844 | 0.022 | 5137 | 0.442 | 150 | 0.521 |
| 22 | Querétaro | 0.083 | 16,998 | 0.014 | 1468 | 0.298 | 121 | 0.656 |
| 23 | Quintana Roo | 0.077 | 21,778 | 0.012 | 952 | −0.750 | 24 | 0.762 |
| 24 | San Luis Potosí | 0.111 | 10,912 | 0.011 | 2360 | 0.882 | 37 | 0.529 |
| 25 | Sinaloa | 0.105 | 11,722 | 0.003 | 2586 | 0.914 | 44 | 0.539 |
| 26 | Sonora | 0.087 | 17,727 | 0.014 | 2290 | 0.535 | 13 | 0.748 |
| 27 | Tabasco | 0.250 | 8868 | 0.006 | 1939 | 0.378 | 79 | 0.484 |
| 28 | Tamaulipas | 0.089 | 15,649 | 0.024 | 2853 | 0.610 | 36 | 0.824 |
| 29 | Tlaxcala | 0.163 | 7855 | 0.007 | 1003 | 0.329 | 247 | 0.698 |
| 30 | Veracruz | 0.139 | 8694 | 0.002 | 7053 | 0.561 | 98 | 0.554 |
| 31 | Yucatán | 0.087 | 11,498 | 0.006 | 1720 | 0.003 | 39 | 0.639 |
| 32 | Zacatecas | 0.158 | 8565 | 0.002 | 1376 | 1.504 | 19 | 0.370 |
| National average | 0.118 | 14,218 | 0.015 | 3107 | 0.589 | 267 | 0.652 | |
Table 2 Correlogram.
| Variables: | Government spending to GDP ratio | Output per capita | FDI to GDP ratio | International migration rate | Population (thousands) | Density (people per km2) | Proportion of urban population |
|---|---|---|---|---|---|---|---|
| G/Y | Y/L | FDI/Y | Migration | Size | Density | Urban | |
| G/Y | 1 | ||||||
| Y/L | −0.57 | 1 | |||||
| FDI/Y | −0.33 | 0.67 | 1.00 | ||||
| Population | −0.14 | 0.07 | 0.25 | 1 | |||
| Migration | 0.34 | −0.51 | −0.33 | −0.07 | 1 | ||
| Density | −0.22 | 0.57 | 0.59 | 0.45 | −0.22 | 1 | |
| Urban | −0.66 | 0.74 | 0.56 | 0.22 | −0.48 | 0.37 | 1 |
Note: Elaborated with data from the Mexico's National Institute of Geography and Statistics (INEGI).
Figure 1 Geographical allocation of government expenditure as a proportion of GDP.
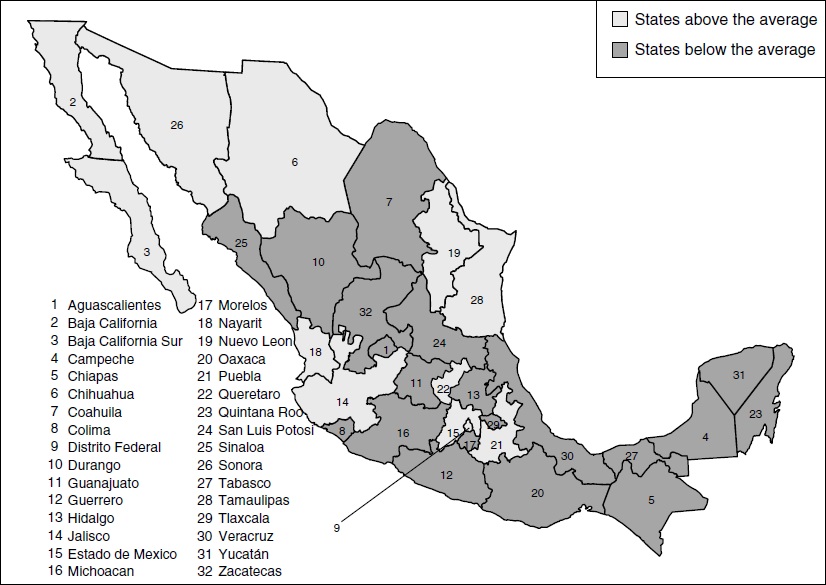
In the absence of reliable trade figures at the state level, we measure openness by employing two different alternative indicators: FDI flows and net international migration. For the period observed, FDI represents on average around 1.57% of GDP across all 32 states. The largest receptor of FDI is the capital of Mexico, Distrito Federal, 8.75%, followed by the northern border states of Baja California and Nuevo Leon, with about 5.1% and 4.8% of their respective GDP each. The states with the lowest FDI reception are the southern states of Chiapas and Oaxaca, followed by the central state of Michoacán (less than 0.2% of their respective GDP in all three cases). Figure 2 shows the geographical location of states above and below the average annual FDI to GDP ratio. The concentration of the highest receivers of FDI along the northern border and the center of Mexico is evident from this diagram.
Note: Elaborated with data from the Ministry of Economy, FDI National Registry (RNIE).
Figure 2 Geographic location of FDI across Mexican states.
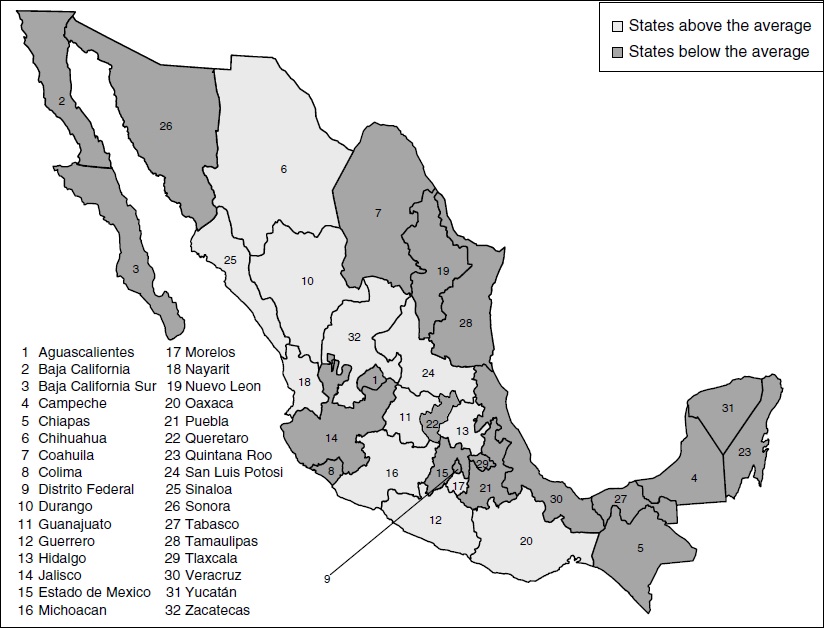
The international migration rate is defined as the outflows of people leaving a state to live abroad minus the inflows of people arriving from abroad divided by each state's total population. We observe that only three states present a net inflow of people: Quintana Roo (0.75%), Baja California (0.19%) and the capital of Mexico, Distrito Federal (0.05%). These entities typically receive a considerable number of foreign immigrants due to tourism and business activities. Among the states from which more migrants go abroad are Michoacán (1.63%), Zacatecas (1.5%) and Nayarit (1.32%). From our two openness indicators only international migration observes a positive correlation with the government spending to GDP ratio (correlation coefficient of 0.34), suggesting that greater international migration positively influences the size of the government. The geographical pattern of international migration is shown in Figure 3. Clearly, states with more than average net migration rates extend all along Mexico from Chihuahua in the northern border to Oaxaca, with no particular geographical concentration in the south or the north.
Population in our model is a proxy for size. In Table 1 this is given in thousands of people. The state of Mexico is the one with the highest average population (13.1 million), followed by Distrito Federal (8.7 million) and Veracruz (7.1 million). The states with the lowest population are Baja California Sur (453 thousand), Colima (536 thousand) and Campeche (716 thousand). The last two columns in Table 1 contain two other control variables commonly employed in the literature that analyze the role of openness in government size: population density and urban population. The average population density in Mexico is 267 people per square kilometer. The entities with the highest density are Distrito Federal (5700), the state of Mexico (609) and Morelos (312), while those with the lowest density are Baja California Sur (6), Durango (12), Campeche (13) and Chihuahua (13). In terms of the proportion of urban population, the figures suggest that on average, 65% of the Mexican population lives in urban areas. Finally, the entities with the highest urban population proportions are Distrito Federal (100%), Nuevo Leon (92%) and Coahuila (90%). The states with the lowest levels of urban population are Oaxaca (27.5%), Chiapas (31.6%) and Guerrero (37%).
The model
We start our analysis by estimating Ram's (2009) parsimonious set of equations that look at the relation between government size, country size and openness as proposed by Alesina and Wacziarg (1998). The three regression equations are:
 (1)
(1)
 (2)
(2)
 (3)
(3)
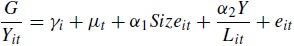
where γi is a set of state specific effects, μt is a groups of time specific effects, G/Yit is the logarithm of government spending to GDP ratio in state i at time t, Size refers to the logarithm of the state's size, which is proxied by the log of population, Y/L is the GDP per capita and Openness is the log of our non-trade measures of openness.
Following Alesina and Wacziarg (1998), we expect the coefficients α1 and β1 in Eqs. (1) and (2), respectively, to be negative. This would suggest that (1) sharing government spending among a larger population reduces per capita expenditure (α1 < 0); (2) market size enhances productivity through economies of scale; hence, relatively smaller states are more eager to become and remain open in order to gain access to larger markets (β1 < 0). Given the negative relation of country size with government size and with openness, in Eq. (3) we expect the coefficient for openness (δ1) to be positive.
After the estimation of this parsimonious set of equations, we verify the robustness of the results by estimating an augmented version of Eq. (3) which controls also for factors such as country size, income per capita, urbanization rates and population density. This model is akin to previous estimates by Rodrik (1998) and by Benarroch and Pandey (2008). We first estimate the model for total government spending, then revisit the augmented model for alternative categories of government spending. The augmented model is as follows:
 (4)
(4)
where Urban is the urbanization rate across states (i.e. the proportion of urban population living in urban areas) and Density the logarithm of the number of people per square kilometer. With respect to previous studies employing panel data methods (see, for instance, Rodrik, 1998; Garen & Trask, 2005; Benarroch & Pandey, 2008, among others), the model proposed in equation (4) offers the advantage of explicitly controlling for country size as done by Ram (2009) in his revision of the causality suggested by Alesina and Wacziarg (1998).
Results
Trivariate models
Table 3 presents the estimations of Eqs. (1)-(3) employing our two measures of openness: FDI and international migration flows. The models are estimated by using generalized least square (GLS) panel data methods that allow for heteroscedasticity and autocorrelation in the disturbances, eit. Following the estimations, the results are as follows. First, we observe the expected negative signs for the effect of output per capita on government size. The estimates in column (1) suggest that a 1% increase in population (size) leads to a contraction of 0.69% in the size of government, while a 1% increase in output per capita causes government size to decline by 0.8%. Thus, in line with previous findings at the national level, the evidence indicates that the greater a state, the smaller the size of its government, presumably as a result of economies of scale. Second, we observe that larger states, as measured by population size, are also considerably less open to capital and labor flows. According to our estimates in column (2a), a 1% increase in population reduces the FDI to GDP ratio by 3.98%. Similarly, in (2b) the log of population also has the negative expected sign (coefficient of −3.205). Finally, in columns (3a) and (3b) we explore the effects of openness on the size of government. According to our estimates, a 1% increase in the FDI to GDP ratio leads to a less than 0.01% increase in the size of government. Meanwhile, the coefficient for the effect of the international migration rate on the size of government (log of G/Y) is also positive and significant (0.12).
Table 3 Country size, government size and openness: equations to (3).
| Dependent variable: | Log of G/Y | Log of FDI/Y | Log of migration | Log of G/Y | |
|---|---|---|---|---|---|
| (1) | (2a) | (2b) | (3a) | (3b) | |
| Log of population | −0.690*** | −3.981*** | −3.205*** | ||
| (0.093) | (1.104) | (0.343) | |||
| Log of Y/L | −0.800*** | −3.409*** | −0.328*** | −0.522*** | −0.613*** |
| (0.082) | (0.925) | (0.126) | (0.077) | (0.087) | |
| Log of FDI/Y | 0.008*** | ||||
| (0.003) | |||||
| Migration rate | 0.118*** | ||||
| (0.017) | |||||
| Constant | 14.296*** | 82.809*** | 47.573*** | 2.178*** | 2.965*** |
| (1.521) | (19.676) | (5.016) | (0.736) | (0.845) | |
| Observations | 352 | 334 | 352 | 334 | 352 |
| Pseudo R 2 | 0.956 | 0.867 | 0.669 | 0.954 | 0.631 |
Note: Generalized least squares (GLS) that allow for heteroscedasticity and first order serial correlation are employed.
* Refers to levels of significance of 10%.
** Refers to levels of significance of 5%.
*** Refers to levels of significance of 1%.
Overall, our results for the Mexican states are consistent with previous findings across countries. We observe (i) a negative relation between state size and government size and (ii) between state size and openness, and also (iii) a positive relation between the size of the government and the degree of openness measured by foreign capital inflows and net labor migration. All these results are consistent with Alesina and Wacziarg's (1998) hypothesis that the latter relation (in (iii)) is a result of the former two ((i) and (ii)). We now go on to propose a more comprehensive model to explore the relationship between government size and openness.
Sensitivity checks
Table 4 presents the estimations of Eq. (4). This is a more comprehensive version of Eq. (3) in which, besides capturing the influence of state size, we also control for two additional government size determinants: density and urban population. Columns (a) to (c) present progressive estimates of Eq. (4) by employing the ratio of foreign capital flows to GDP as openness determinants and columns (d) to (f) using the rate of net migration as the control for openness. In order to observe the sensitivity of our results to the inclusion of control variables, in Table 4 we add all those control variables in a progressive fashion.
Table 4 Government size and openness.
| G/Yit=γi+μt+β1Sizeit+β2Y/Lit+β3Urbanit+β4Densityit+β5Opennessit+eit (4) | ||||||
|---|---|---|---|---|---|---|
| (a) | (b) | (c) | (d) | (e) | (f) | |
| Log of population | −0.668*** | −0.608*** | −0.294*** | −0.342*** | −0.329** | −0.094 |
| (0.107) | (0.102) | (0.098) | (0.131) | (0.137) | (0.106) | |
| Log of per capita output | −0.749*** | −0.831*** | −0.831*** | −0.699*** | −0.718*** | −0.717*** |
| (0.089) | (0.088) | (0.088) | (0.092) | (0.096) | (0.096) | |
| Log of urban | 0.659*** | 0.659*** | 0.570*** | 0.570*** | ||
| (0.162) | (0.162) | (0.178) | (0.178) | |||
| Log of density | −0.314*** | −0.235*** | ||||
| (0.083) | (0.073) | |||||
| Log of FDI/Y | 0.006** | 0.006** | 0.006** | |||
| (0.003) | (0.003) | (0.003) | ||||
| Migration rate | 0.084*** | 0.078*** | 0.078*** | |||
| (0.021) | (0.021) | (0.021) | ||||
| Constant | 13.528*** | 13.641*** | 10.955*** | 8.499*** | 8.626*** | 6.615*** |
| (1.724) | (1.724) | (1.575) | (2.256) | (2.365) | (2.046) | |
| Observations | 334 | 334 | 334 | 352 | 352 | 352 |
| Pseudo R 2 | 0.955 | 0.956 | 0.957 | 0.105 | 0.957 | 0.958 |
Note: Generalized least squares (GLS) that allow for heteroscedasticity and first order serial correlation are employed.
* Refers to levels of significance of 10%.
** Refers to levels of significance of 5%.
*** Refers to levels of significance of 1%.
The estimates show some interesting results. First, size (proxied by population) is negative and significant in five of the six specifications. This is consistent with Alesina and Wacziarg's (1998) findings which suggest that this negative ratio exists as a result of economies of scale in the provision of public goods and other public services. Second, per-capita output also presents the expected negative sign with coefficients ranging from −0.70 to −0.83. These estimates indicate that states with lower per capita income tend to have bigger governments. This might happen because less developed states require more public expenditure in order to converge toward the income of more developed ones. The results are consistent with previous literature that accounts for size and with those previously shown in Table 3. Third, the lag of urban population presents the positive expected sign indicating that a 1% increase in the proportion of people living in urban areas leads to an increase of between 0.57% and 0.66% in the size of the government. Fourth, density presents a negative and significant sign which suggests that states with a larger density per square km tend to have smaller governments. This might be, once again, as a result of economies of scale in the provision of public goods and services.
Finally, with regard to our openness measurements, our estimates confirm that, despite the persisting negative relation between government spending and country size, there is a positive influence of capital and labor mobility on the size of government. For the FDI to GDP ratio, a 1% increase in this measure results now in a 0.006% increase in size of government, only a slightly smaller effect than in the more parsimonious model of Table 3 that does not control for size. For the effect of labor mobility on government size, the coefficients in columns (d) to (f) range from 0.078 to 0.084, slightly less than in the absence of size controls but equally significant at the 1% level.
The estimates in Table 4 confirm the positive effects of capital and labor openness on the size of the Mexican state governments. These results are consistent with previous evidence reported by Ram (2009) at the country level and who also finds a significant impact of country size on government spending. In contrast with Ram (2009), however, we observe a negative rather than positive effect of state size on openness. Here we document the expected negative effects of population, our proxy for size, on government spending but also a robust positive effect of openness on the size of government. Overall, our results suggest that, while the underlying relations pointed out by Alesina and Wacziarg (1998) exist, they are not influencing the expected positive relation between government size and openness. In the next section, we study three subcategories of government spending to observe whether the results remain robust across different expenditure needs.
Government spending on health, education and social programs
In this section we concentrate our analysis on three categories of spending which are important to ensure social welfare: health, education and poverty alleviation (social) programs.7 The data employed for these three categories of expenditure corresponds to non-discretionary transfers (aportaciones) made by the federal government to the states and labeled for specific purposes. As mentioned earlier, Mexican states rely heavily on central government transfers. For the period analyzed, 1998-2006, aportaciones represented about 51% of states total revenue, most of which were earmarked for health, education and poverty alleviation (social) programs. Since the response of government expenditure to the needs of different entities can vary according to their specific characteristics, we expect to find dissimilar responses for each expenditure category and for our two openness measures.
In Table 5 we report the estimates of Eq. (4) for the three spending categories and for our two measures of capital and labor openness. Columns (a) to (c) report the results for the model controlling for openness using the FDI to GDP ratio and (d) to (f) employing net international migration flows as proxy for openness. The coefficients of all the control variables are significant and present the expected sign. Except for the rate of urbanization, the rest of the coefficients are in line with those we found for total government spending.
Table 5 Alternative categories of government social spending and openness.
| G/Yit=γi+μt+β1Sizeit+β2Y/Lit+β3Urbanit+β4Densityit+β5Opennessit+eit (4) | ||||||
|---|---|---|---|---|---|---|
| Dependent variable: | Log of government spending on | Log of government spending on | ||||
| Education | Health | Social | Education | Health | Social | |
| Log of population | −0.415*** | −1.011*** | −2.603*** | −0.428*** | −0.764*** | −2.379*** |
| (0.037) | (0.047) | (0.237) | (0.041) | (0.075) | (0.247) | |
| Log of per capita output | −1.072*** | −0.918*** | −1.448*** | −1.066*** | −0.893*** | −1.324*** |
| (0.039) | (0.053) | (0.167) | (0.040) | (0.057) | (0.159) | |
| Log of urban | −0.150* | 0.243* | −0.688* | −0.142 | 0.367** | −0.516 |
| (0.088) | (0.141) | (0.392) | (0.091) | (0.148) | (0.407) | |
| Log of density | −0.188*** | −0.224*** | −1.120*** | −0.196*** | −0.119*** | −1.055*** |
| (0.022) | (0.031) | (0.151) | (0.023) | (0.042) | (0.150) | |
| Log of FDI/Y | 0.000 | −0.003* | 0.005 | |||
| (0.001) | (0.002) | (0.004) | ||||
| Migration rate | 0.002 | 0.078*** | 0.133*** | |||
| (0.009) | (0.015) | (0.045) | ||||
| Constant | 13.362*** | 18.701*** | 49.410*** | 13.524*** | 14.521*** | 44.715*** |
| (0.802) | (1.125) | (4.206) | (0.887) | (1.462) | (4.354) | |
| Observations | 263 | 263 | 263 | 279 | 279 | 279 |
| Pseudo R 2 | 0.870 | 0.833 | 0.763 | 0.874 | 0.835 | 0.771 |
Note: Generalized least squares (GLS) that allow for heteroscedasticity and first order serial correlation are employed. Public Security data are available from 1999 to 2006, for all the other spending categories data is available from 1998 to 2006.
* Refers to levels of significance of 10%.
** Refers to levels of significance of 5%.
*** Refers to levels of significance of 1%.
With respect to our two measures of openness, we observe very different results. There is no significant effect of capital flows on size of government for health and social programs but there is a negative and significant effect on health expenditure (only at the 10% level). Presumably, this has to do with the nature of capital flows which exert little influence on these categories of expenditure, particularly education and social programs advocated to poverty alleviation. As for migration, we observe positive and strongly significant effects of migration on health and poverty alleviation (social) programs. These results are consistent with the idea that after household heads migrate, the need for programs that target health and poverty alleviation increases. While this might be also true for education, we do not find significant evidence that Mexican states’ spending has responded effectively.
Concluding remarks
This paper has examined the relation between openness and government size across a sample of 32 Mexican entities over the period 1996-2006 employing two alternative new measures of openness linked to international capital and labor mobility: FDI flows and the net international migration rate. Using a set of parsimonious equations, the study confirms the existing negative relation between country size and both government size and openness, as well as the positive relation between government size and openness, as proposed by Alesina and Wacziarg (1998). A more comprehensive model that controls for country size and other important determinants of government spending, confirms the positive association between government size and openness. All these results are observed for our two measures of capital and labor openness.
A disaggregation of total government spending to concentrate the analysis on social spending allocated to education, health and poverty alleviation programs renders different results for our two measures of capital and labor openness. We find no significant effect of capital flows on the size of government for education and poverty alleviation programs, but a weakly significant negative effect on health expenditure. We argue that this has to do with the nature of capital flows which exert little influence on these social categories of expenditure. For international migration we observe positive and strong effects of migration on health and poverty alleviation programs but not on education. These results are consistent with the idea that after household heads migrate, the need for programs that target health and poverty alleviation increases. This could also be true for education; however, we do not find significant evidence that states’ spending has favorably responded to such needs.
As for our proposed measure of openness, the results suggest that, in the absence of trade-related openness measures, the international migration rate is fully capable of capturing the effects of external shocks affecting the Mexican economy. Further investigation on how international migration could capture overall macroeconomic instability across more diverse, less homogenous economies is needed.

