


 nova página do texto(beta)
 Inglês (pdf)
 Artigo em XML
 Referências do artigo
 Enviar este artigo por email
 Citado por SciELO
  Similares em
SciELO
Similares em
SciELO 
 Permalink
JEL classification: G21; G28
Introduction
The banking sector is the main source of funds for long-term investments and the foundation of economic growth (Schumpeter, 1934). In most developing countries, the banking sector represents the backbone of the financial system. Therefore, an efficient and profitable banking sector may help ensure an effective financial system which is conducive to economic growth and development. Levine (1998) points out that the efficiency of financial intermediation affects a country's economic growth and at the same time, bank (financial intermediation) insolvencies could result in systemic crises and consequently negative implications on the economy.
The banking sector is considered the backbone of most economies and plays a important role in attaining economic growth and development and becomes the most important mechanisms of Bangladesh financial system since the early 1970s. During the early years, all financial institutions, including commercial banks, are required to fulfil economic objectives set by the government. However, the efficiency of the banking sector has become an imperative issue among policymakers in Bangladesh since the formation of the National Commission on Money, Banking and Credit in 1986 (Shameem, 1995). The purpose for the establishment of the commission among others is to find solutions for efficient operations and management of the banking system (Shameem, 1995). In maintaining the stability of the banking system, the efficiency of the banking sector is important so as to ensure that banks remain profitable and healthy.
It would be reasonable to expect that improvements in profit efficiency could lead to higher bank profitability levels and help ensure the sustainability of the country's economic growth. Besides, profit efficiency is also in line with firms’ main objective that is to maximize profit since it takes into account both the cost and revenue effects on changes in outputs scale and scope. Profit efficiency measures how close a bank is in producing the maximum level of profit, given the amount of inputs and outputs and their price levels (Ariff & Can, 2008). Thus, profit efficiency provides a complete description on the economic goal of a bank which requires that banks reduce their costs and increase their revenues. Furthermore, Berger and Mester (2003) among others suggest that profit efficiency offers valuable information on the efficiency of bank managements.
Nevertheless, during the years 2007-2008 financial crisis has resulted in bank foreclosures in both the developed and developing economies. Throughout the period, approximately 168 United States (U.S.) banks have failed, while the profitability and the efficiency levels of banking sectors worldwide declined abruptly. The financial crisis illustrated how ruinous problems in the financial sector could be for the entire economy. In the case of Bangladesh country, the impact of this global financial crisis is slightly different to other affected countries mostly from European and U.S. Although the global financial crisis has not been directly felt because of the shielding of the economy from the most immediate effects of the crisis, the economy of Bangladesh could be poorly effected due to the instability of the financial market and economic conditions in the developed and several emerging economies.
In fact, even though it is hard to speculate how bad the financial crisis would affect the developing countries, the failing financial institutions and toxic assets in US and others developed countries can indirectly provide the lower level of profit efficiency to the developing countries’ banks. Thus, the developing country like Bangladesh could use the phenomena of financial crisis that affect the developed countries as a guidance to provide the wise strategies in constructing their financial systems to remain the higher level of bank profit efficiency. Furthermore, numerous developed and developing countries experienced some important ownership transformations in several dimension during the years 2007 to 2013 due to the impact of global financial crisis (Claessens & Horen, 2014). This phenomena leads several banks retrenched from foreign activities, others grasped opportunities to expand abroad or increase their market shares in foreign countries to ensure the.
In fact, the factor of ownership can also significantly influence the efficiency of the banks. According to Isik and Hassan (2003) the banking sectors have heterogeneous ownership, corporate, market and risk characteristics. The selection of the ownership such as local, foreign, private, public, state, etc. is vital in the context of non-bank firms and banking sector (Boubakri, Cosset, Fischer, & Guedhami, 2005). Besides, the ownership represent an essential element for the development of health banking sector in developing countries. Generally, the ownership of Bangladesh banks can be categorized into four groups namely Nationalized Commercial Banks or State Owned Commercial Banks (SCBs), Private Commercial Banks (PCBs), Specialized Development Banks (SDBs), and Foreign Commercial Banks (FCBs). The SCBs (consists of four banks which are Agrani Bank, Janata Bank, Rupali Bank Limited and Sonali banks) were formed via the event of merger process of all commercial banks operating in Bangladesh except foreign banks. SCBs were considered as the proper means of generating savings that can be facilitate industrial finance to the sectors of the economy with the greatest development prospects (Islam, Siddiqui, Hossain, & Karim, 2014).
The PCBs lead the Bangladesh banking sector since they cover more than 50% of total assets and deposits. Basically, the PCBs’ performance is higher than SCBs and SDBs because their quality and superb services such as banking service automation and client service innovation. Islam et al. (2014) reported that the PCBs have rapidly occupy the market share at the expense of the SCBs. In present, the PCBs have more than 59% of total deposits but SCBs have only 28% and PCBs assets coverage is 58% while it is only 29% in SCBs. Meanwhile, the SDBs and FCBs are not similar to both SCBs and PCBs commercial banks ownership. SDBs are formed specifically to promote agricultural development and to promote small and medium entrepreneurship in Bangladesh, whilst FCBs are the banks that operating in the Bangladesh which was incorporated in abroad.
Therefore, this study investigate for the first time empirical evidence on impact of global financial crisis focusing on SCBs and PCBs ownership and others bank specific and macroeconomics factors influencing profit efficiency level of the Bangladesh banking sector. Although studies on bank efficiency are voluminous, these studies have mainly concentrated on the banking sectors of the western and developed countries (Berger, 2007). Besides, very few have been examine issues of global financial crisis specifically on SCBs and PCBs ownership on the specific profit efficiency in the Bangladesh banks. On the other hand, empirical evidence on the developing countries is relatively scarce and the majority of these studies focuses on the technical, pure technical, and scale efficiency concepts. To do so, we adopt a two stage analysis. In the first stage, we employ the Slack-Based Data Envelopment Analysis (SBM-DEA) method to compute the profit efficiency of 31 commercial banks operating in the Bangladesh banking sector during the period 2004-2011 which encapsulates the most recent global financial crisis period and covered the types of bank ownership. In the second stage, we employ a multivariate panel regression analysis framework based on the Ordinary Least Square (OLS) and Generalized Least Square (GLS) methods comprising the Fixed Effect (FE) and Random Effect (RE) models to examine the potential determinants of banks’ profit efficiency.
The paper is set out as follows: the next section provides review of the related literature and hypotheses development, followed by “Data and methodology employed” section which outlines the data and methodology employed by the study. “Empirical results” section reports the empirical findings. Finally, we conclude in “Conclusions” section with some discussions on the policy issues and offers avenues for future research.
Theoretical framework and literature review
Cobb Douglas production theory
The basic concept of efficiency is that it measures how well firms transform their inputs into outputs according to their behavioural objectives (Fare, Grosskopf, Norris, & Zhang, 1994). A firm is said to be efficient if it is able to achieve its goals and inefficient if it fails. In normal circumstances, a firm's goal is assumed to be cost minimization of production. Thus, any waste of inputs is to be avoided so that there is no idleness in the use of resources. In the production theory, it is often assumed that firms are behaving efficiently in an economic sense. The production theory originally proposed by Cobb and Douglas (1928) namely Cobb Douglass Production Theory assumes that firms behave efficiently in an economic sense. He develops the production theory from the movement of labour, capital, production, value and wages for the manufacturing industries. According to Fare, Grosskopf, and Lovell (1985), firms are able to successfully allocate all resources in an efficient manner relative to the constraints imposed by the structure of the production technology, by the structure of input and output markets, and relative to whatever behavioural goals attributed to the producers.
Furthermore, Berger and Humphrey (1997) extend the production function model to the banking sector by focusing mainly on financial sector's efficiency. The efficiency of the financial sector underlines the efficient allocations of financial resources that are required to promote productivity. This indicates that the economy has the opportunity to transfer the input of saving resources for more productive output such as investments.
Technical and cost efficiency
A wide range of models have been used to investigate a spectrum of efficiency related issues in a wide range of environments. Koopmans (1951) was the first to provide the definition of technical efficiency where the producer is technically efficient if an increase in any output requires a reduction in at least one output and if a reduction in any input requires an increase in at least one other input or a reduction in at least an output. Liebstein (1966) on the other hand was the first to introduce the concept of X-efficiency. The X-efficiency concept defines cost inefficiencies that are due to wasteful use of inputs, or managerial weakness. The X-efficiency concept seeks to explain why all firms do not succeed in minimizing the cost of production and recognizes that the sources of X-efficiency may also be from outside of the firm. In this regard, Button and Weyman-Jones (1992) suggest that X-inefficiency is due partly to the firm's own actions as well as from exogenous factors surrounding the environment in which the firm operates.
Ariff and Can (2008) state that, the cost efficiency means that a firm is able to minimize the costs of inputs while producing the same amount of outputs sold at certain. Berger and Humphrey (1997) claimed that most of the previous studies focused on the cost efficiency and suggested that research on the profit efficiency has been scarce. Most ignored the revenue and profit side on the efficiency of the banks since only nine out of 130 studies on efficiency of financial institutions reviewed, had analyzed profit efficiency (Bader, Mohammed, Ariff, and Hassan, 2008). Basically, profit maximization requires a firm to choose an input and output bundle such that the output bundle generates the maximum revenue possible from the corresponding input bundle. At the same time, the input bundle chosen produces the corresponding output bundle at the lowest cost.
However, a study by Adongo, Strok, and Hasheela (2005) suggested that cost efficiency may not sufficient to describe the overall performance of the bank's financial performance. The reason is that cost efficiency only considers on how to minimize the cost, but it does not take into account the revenue gained from the provision of higher quality services. Also, cost efficiency only evaluates the performance holding output quantities statistically fixed at their observed levels, but it does not consider the optimally efficient levels involving a different scale and mix of outputs. Thus, the bank is considered cost efficient at the current output which may or may not be cost efficient at optimal outputs. In this regard, the problem could be solved by examining the profit efficiency concept.
Profit efficiency
Profit efficiency refers to a firm's maximization of profit and involves both the cost and revenue effects on the changes in output scale and scope. Profit efficiency considers how successful a bank is in achieving maximum profit based on a given level of inputs and outputs and a level of their prices (Ariff & Can, 2008). Therefore, the profit efficiency of a bank describes how it is able to reduce cost and increase revenue. According to Berger and Mester (2003), profit efficiency provides more useful information on management efficiency. Also, Adongo et al. (2005) maintain that there is profit efficiency if cost increase is due to increased or enhanced output but increase in revenue should exceed increase in cost.
Jayaraman and Srinivasan (2014) examine the profit efficiency of banks in India. They employed the Nerlovian profit indicator to measure the banks profit efficiency. The profit inefficiency of banks has been decomposed into technical and allocation inefficiency using directional distance function. The study suggest that banks profit inefficiency is due to inefficiency from the element of allocative and this indicates banks required to focus on optimal utilization of input-output mix.
Another study by Fu, Juo, Chiang, Yu, and Huang (2015) investigate the profit efficiencies of 70 Chinese and 34 Taiwanese banks in 2011. They include the equity capital as a quasi-fixed input and develop the risk-based measure of the meta Nerlovian profit efficiency to consider risk consideration of banks. The profit efficiency involve the basic two elements which are technology and allocative efficiencies. The empirical results summarized that the Chinese joint-equity banks, Chinese state-owned banks and Taiwanese state-owned banks perform the best in meta profit efficiency.
In the Malaysian Islamic and conventional banks cases, Kamarudin and Yahya (2013) study the cost, revenue and profit efficiency on both banks ownership. This research employed Data Envelopment Analysis (DEA) method on the sample of 39 Islamic and conventional banks. They discovered that the levels of profit and cost efficiency for Islamic banks are lower than conventional banks due to the factors of bank-specifics characteristics and macroeconomic conditions.
Kamarudin, Nordin, Muhammad, and Hamid (2014) examine the efficiency level on Islamic and conventional banks in Gulf Cooperation Council countries on the 74 banks over the years 2007-2011. The findings seems to suggest that lower Islamic banks profit efficiency level due to the higher level on banks revenue inefficiency. Another study by Sufian and Kamarudin (2015) also find the similar finding where the Islamic banks revenue efficiency has greater influence on the profit efficiency levels in the selected Southeast Asian countries consists of Malaysia, Indonesia and Brunei over the years 2006-2011. The results show that the level of profit efficiency in the domestic Islamic banks is higher than foreign Islamic banks due to the higher level of revenue efficiency on domestic Islamic banks. They suggest that the higher profit efficiency levels the higher profitability of the banks.
In general, most of the previous studies applied the Data Envelopment Analysis (DEA) to measure banks profit efficiency and its required the selection of inputs, input prices, outputs and output prices. The collection or selection of the bank inputs and outputs could be difficult in the evaluation of the bank efficiency to be used in the first stage of DEA analysis. Bader et al. (2008) stated explicitly that there is ‘no perfect approach’ in the selection of the bank inputs and outputs. Berger and Humphrey (1997) also found that there are some restrictions on the type of variables since there is a need for comparable data and to minimize possible biases due to different accounting practices in the collection of the variables. In fact, they stated that even in the same country, different banks might apply different accounting standards. The results of the efficiency scores for each study on the bank efficiency will be affected due to the selection of variables. Thus, the DEA method requires bank inputs, input prices, outputs and output prices as the choice is always an arbitrary issue (Ariff & Can, 2008; Berger & Humphrey, 1997; Sufian, Kamarudin, & Noor, 2013).
The above literature reveals the following research gaps. First, the majority of these studies have mainly concentrated on other countries rather than Bangladesh. Second, empirical evidence generally focus on the technical, cost, revenue and profit efficiencies in the banking sectors without indentifying the impact of specific potential and macroeconomics determinants on banks profit efficiency. Finally, virtually nothing has been published on the specific impact of global financial crisis and ownership to the specific profit efficiency concept in the Bangladesh banks. In the light of these knowledge gaps, this paper seeks to provide new empirical evidence on the impact of global financial crisis to the profit efficiency and others factors that influence the level of profit efficiency of the SCBs and PCBs in Bangladesh baking sector.
Data and methodology employed
The present study gathers data on commercial banks operating in the Bangladesh banking sector during the years 2004 to 2011. The source of financial data is the Bureau van Dijk's BankScope database which provides banks’ balance sheet and income statement information. Due to the entry and exit of banks during the years, the actual number of banks operating in the Bangladesh banking sector varies. The final sample comprised of 31 commercial banks of which complete data are available for the years 2004-2011. The analysis periods are divided into three event windows: 2004-2006, referred as pre global financial crisis, 2007-2008, referred as during global financial crisis, and 2009-2011, considered as post-merger period. This event window was inspired by Rhoades (1998) who suggested that the three-year time period is optimal because about half of any efficiency gains should be realized within three years (−3,3). This fact is almost unanimously agreed among the experts interviewed. In order to maintain homogeneity, only state owned commercial banks (SCBs) and private commercial banks (PCBs) are included in the analysis. Foreign commercial banks (FCBs) and specialized development banks (SDBs) are excluded from the sample.
Data envelopment analysis (DEA)
The Data Envelopment Analysis (DEA) method is based on mathematical programming model developed by Charnes, Cooper, and Rhodes (1978) known as Charnes, Cooper and Rhodes Model (CCR) that has been adopted by several studies to measures banks’ efficiency (e.g. Kamarudin, Nordin, & Nasir, 2013; Kamarudin, Nasir, Yahya, Said, & Nordin, 2014; Sufian, Muhammad, Nordin, Yahya, & Kamarudin, 2013; Sufian, Kamarudin, & Noor, 2014). The method seeks to establish how the n decision making units (banks in our case) determine the envelopment surface (the best practice efficiency frontier). The CCR model presupposes that there is no significant relationship between the scale of operations and efficiency by assuming constant returns to scale (CRS) and is only justifiable when all decision making units are operating at an optimal scale. However, technological advances and regulatory changes may have different impacts across banks of different sizes resulting in banks to face either economies or diseconomies of scale (Assaf, Barros, & Matousek, 2011). To address this issue, Banker, Charnes, and Cooper (1984) extends the CCR model by relaxing the CRS assumption. The resulting Banker, Charnes and Cooper (BCC) Model is used to assess the efficiency of decision making units characterized by variable returns to scale (VRS). Thus, the primary profit efficiency VRS model is given in Eq. (1):
 (1)
(1)
where s is a is output observation, m is a input observation, r is a sth output, i is a mth input,
The slack-based data envelopment analysis (SBM-DEA)
The present study employs the non-parametric Slack-Based Data Envelopment Analysis (SBM-DEA) method to compute the efficiency of individual banks operating in the Bangladesh banking sector (e.g. Sufian & Kamarudin, 2014). The method constructs the frontier of the observed input-output ratios by linear programming techniques. The method is a non-radial efficiency measure dealing directly with input excesses and output shortfalls (Tone, 2002). A decision making units (DMU) that refer to bank is said to be efficient with a value of unity if the DMU is on the frontier of the production possibility set with no input and output slack. The estimated model is modified from Eq. (1) and the profit efficiency can be illustrated by
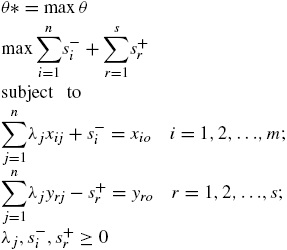 (2)
(2)
where DMU0 is one of the n DMUs under evaluation; xio and yro are the ith input and rth output for DMU0, respectively; and λj represents the unknown weights, where j represents the number of DMUs. The optimal value of θ* represents the distance from the efficient frontier. Therefore, the most efficient bank will have θ* = 1 and the inefficient bank will exhibit θ*< 1.
The SBM-DEA method is preferred to parametric estimation as the former deals with input excesses and output shortfalls simultaneously rather than holding the input or output at a given level (Chan, Karim, Burton, & Aktan, 2014). Furthermore, Chiu and Chen (2009) suggest that the SBM-DEA method provides a well representation of banking operation in the real situation since banks are given a certain degree of control on both the input and output sides. For the purpose of this study, we adopt the SBM-DEA under the VRS model to solve the profit efficiency problem. Eq. (2) is modified to a VRS slack-based model as follows:
 (3)
(3)
where
 (4)
(4)
Approach selection, input and output variables
There are three main approaches that are widely used in the banking theory literature namely, production, intermediation, and value added approaches (Sealey & Lindley, 1977). The present study adopts the intermediation approach attributed to three main reasons. First, the study attempts to evaluate the efficiency of the whole banking sector and not branches of a particular bank. Second, the intermediation approach is the most preferred approach among researchers investigating the efficiency of banking sectors in developing countries (e.g. Bader et al., 2008; Isik & Hassan, 2002). Third, Sealey and Lindley (1977) suggest that financial institutions normally employ labour, physical capital, and deposits as their inputs to produce earning assets. Since the issue selecting approaches is still arbitrary (Ariff & Can, 2008; Berger & Humphrey, 1997; Sufian & Habibullah, 2009a; Sufian, Kamarudin, & Noor, 2013), this study had decided to use intermediation approach because we assume bank is more suitable to be classified as intermediary entity. Table 3 provides a listing of inputs and outputs chosen for a few of these studies. The choice of the inputs, outputs, input prices and output prices are guided by the choices made in previous studies summarized in Table 1a.
Table 1a Summary of inputs and outputs on bank efficiency analysis.
| Study | Inputs (x) | Outputs (y) | Input prices | Output prices |
|---|---|---|---|---|
| Sufian, Kamarudin, and Noor (2013) | 1. Deposits 2: Labour |
1. Loans 2. Investment |
1. Price of deposits (total interest
expenses/deposits) 2. Price of labour (personnel expenses/total assets) |
1. price of loans (interest income on
loans and others interest income/loans) 2. price of investment(other operating income/income) |
| Sufian et al. (2012) | 1. Deposit 2. Labour 3. Physical capital |
1. Loans 2. Investment 3. Off-balance sheet item |
1. Price of deposit(total interest
expenses/deposits) 2. Price of labour(personnel expenses/total assets) 3. Price of physical capital(Other operating expenses/fixed assets) |
1. Price of loans(interest income on
loans and others interest income/loan) 2. Price of investment(other operating income/investment) 3. Price of off-balance sheet item(net fees and commissions/off-balance sheet items) |
| Ariff and Can (2008) | 1. Deposits 2. No. of employees 3. Physical capital |
1. Loans 2. Investment (short and long term) |
1. Price of deposits (interest
paid/deposits) 2. Price of labour(personnel expenses/no. of employees) 3. Price of physical capital (other operating expenses/physical capital) |
1. Price of loans(interest from
loans/loans) 2. Price of investment(investment income/investment) |
| Bader et al. (2008) | 1. Labour 2. Fixed assets 3. Total Funds |
1. Total loans 2. Investment 3. Off-balance sheet items |
1. Price of labour(total personnel expenses/total
funds) 2. Price of fixed assets(depreciation expenses/fixed assets) 3. Price of funds(interest expenses on deposits and non-deposits funds plus other operating expenses/total funds) |
1. Price of loans(interest income/total loans) 2. Price of investment(investment/other earning assets) 3. Price of off balance sheet items(net commission revenue plus net earning income/off-balance sheet items) |
For the purpose of this study, three inputs and two outputs variables are chosen. The selection of the input and output variables are based on Ariff and Can (2008) and other major studies on the efficiency of banking sectors in developing countries (e.g. Bader et al., 2008; Sufian, Kamarudin, & Noor, 2012; Sufian, Kamarudin, & Noor, 2013). The three input vector variables consist of x1: Deposits, x2: Labour, and x3: Capital. Meanwhile, the two output vector variables are y1: Loans and y2: Investments. The input prices consist of w1: Price of Deposit, w2: Price of Labour and w3: Price of Capital. The two output prices consist of r1: Price of Loans and r2: Price of Investment. The summary of data used to construct the efficiency frontiers are presented in Table 1b.
Table 1b Summary statistics of the input and output variables 2004-2011.
| Variable | Crisis period | Minimum | Maximum | Mean | Std. deviation |
|---|---|---|---|---|---|
| Deposit (x1) | Pre | 4305.000 | 303,955.400 | 47,247.761 | 62,227.976 |
| During | 5691.000 | 364,931.900 | 67,553.580 | 73,925.609 | |
| Post | 7545.700 | 535,288.400 | 108,993.191 | 94,721.342 | |
| Labour (x2) | Pre | 51.100 | 3718.700 | 655.133 | 801.734 |
| During | 120.600 | 5822.300 | 1001.816 | 1148.399 | |
| Post | 142.400 | 9345.600 | 1690.263 | 1655.307 | |
| Capital (x3) | Pre | 17.300 | 3383.500 | 511.336 | 666.660 |
| During | 37.200 | 9920.900 | 1364.423 | 2126.094 | |
| Post | 39.000 | 23,026.400 | 2892.831 | 3400.495 | |
| Loan (y1) | Pre | 3073.000 | 274,486.300 | 38,290.293 | 51,509.073 |
| During | 5010.400 | 278,501.400 | 55,937.773 | 58,925.302 | |
| Post | 6256.200 | 345,991.300 | 87,373.341 | 66,540.986 | |
| Investment (y2) | Pre | 200.000 | 58,895.500 | 7079.030 | 10,910.332 |
| During | 508.400 | 95,344.100 | 11,488.195 | 18,888.809 | |
| Post | 710.100 | 134,075.800 | 19,765.555 | 24,362.132 | |
| Price of deposit (w1) | Pre | 0.032 | 0.093 | 0.062 | 0.015 |
| During | 0.033 | 0.111 | 0.070 | 0.019 | |
| Post | 0.034 | 0.173 | 0.066 | 0.019 | |
| Price of labour (w2) | Pre | 0.005 | 0.022 | 0.011 | 0.005 |
| During | 0.005 | 0.023 | 0.012 | 0.005 | |
| Post | 0.005 | 0.023 | 0.013 | 0.004 | |
| Price of capital (w3) | Pre | 0.229 | 18.975 | 1.656 | 2.646 |
| During | 0.180 | 12.857 | 1.318 | 1.870 | |
| Post | 0.075 | 2.522 | 0.807 | 0.537 | |
| Price of loan (r1) | Pre | 0.052 | 0.171 | 0.106 | 0.025 |
| During | 0.047 | 0.169 | 0.117 | 0.024 | |
| Post | 0.095 | 0.247 | 0.128 | 0.022 | |
| Price of investment (r2) | Pre | 0.032 | 0.810 | 0.231 | 0.130 |
| During | 0.000 | 0.628 | 0.119 | 0.110 | |
| Post | 0.000 | 0.285 | 0.047 | 0.044 |
Notes: x1: deposits (deposits and short term funding), x2: labour (personnel expenses), x3: capital (fixed assets), y1: loans (gross loan), y2: investment (total security)
Pre: pre global financial crisis (2004-2006), During: during global financial crisis (2007-2008), Post: post financial crisis (2009-2011).
Source: Bankscope Database & authors’ own calculation.
Multivariate panel regression analysis
To examine the relationship between the profit efficiency of Bangladesh banks and the contextual variables, we use the Ordinary Least Square (OLS) and Generalized Least Square (GLS) methods comprising the Fixed Effect (FE) and Random Effect (RE) models to examine the potential determinants of banks’ profit efficiency (Table 2). We estimate a linear regression model in the following form
 (5)
(5)
where j refers to an individual bank; t refers to year; y refers to the profit efficiency and is the observation of bank j in a particular year t; INTER represents the internal (bank specific) factors; EXTER represents the external (macroeconomic and market conditions) factors; εjt is a normally distributed random variable disturbance term. By extending Eq. (5) to reflect the internal (bank specific) and external (macroeconomic and market) variables discussed in “Theoretical framework and literature review” section, we estimate the following regression model:
 (6)
(6)
Table 2 Variables used in the multivariate panel regression analysis.
| Variable | Description |
|---|---|
| Dependent | |
| LN(PE) (Profit Efficiency) | Natural log of the profit efficiency derived from the DEA method. |
| Independent | |
| Bank specific factors | |
| LNTA (Size) | The natural log of the accounting value of bank j's total assets in year t. |
| LNLLRGL (Credit risk) | Natural log of loan loss reserves/gross loans. An indicator of credit risk, which shows how much a bank is provisioning in year t relative to its total loans. |
| LNNIITA (Diversification) | A measure of bank's diversification towards non-interest income, computed as the natural log of non-interest income over total assets. |
| LNETA (Capitalization) | A measure of bank's capital strength in year t, calculated as the natural log of equity/total assets. |
| LNNIETA (Overhead expenses) | Calculated as the natural log of non-interest expense/total assets and provides information on the efficiency of the management regarding expenses relative to assets in year t. |
| LNLOANSTA (Liquidity) | A measure of bank's loans intensity calculated as the natural log of total loans divided by total assets. |
| Macroeconomic conditions | |
| LNGDP (Economic growth) | The natural log of gross domestic products. |
| LNINFL (Inflation) | The natural log of the rate of inflation. |
| LNCR3 (Market concentration) | The natural log of the three largest banks asset concentration ratio. |
| PTC (Dummy post global financial crisis) | A binary variable that takes a value of 1 for the post global financial crisis period, 0 otherwise. |
Empirical results
Before proceeding with the discussion of SBM-DEA results, this study first tested the rule of thumb on the selection of inputs and outputs variables suggested by Cooper, Seiford, and Tone (2002). Since the total number of DMUs (31 banks) in this study is more than the numbers of inputs and outputs variables (3 inputs × 2 outputs @ 3 [3 inputs + 2 outputs]), the selection of variables are valid since it complies with the rule of thumb and allows the efficiencies of DMUs to be measured. Next, by calculating the profit efficiency level on all pre, during and post global financial crisis periods, we could observe the profit efficiency level of SCBs and PCBs ownership to these periods and further obtain more robust results. Fig. 1 (graph) and Table 3 illustrates profit efficiency level pre, during and post global financial crisis on SCBs and PCBs ownership.
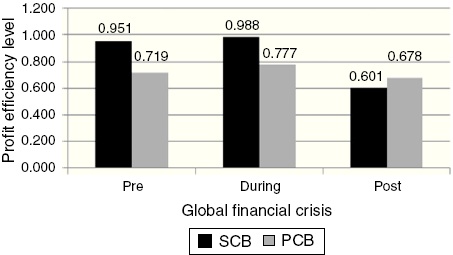
Fig. 1 Graph on profit efficiency level pre, during and post global financial crisis on SCBs and PCBs ownership.
Table 3 Profit efficiency level pre, during and post global financial crisis on SCBs and PCBs ownership.
| No. | SCB ownership | Global financial crisis | No. | PCB ownership | Global financial crisis | ||||
|---|---|---|---|---|---|---|---|---|---|
| Pre | During | Post | Pre | During | Post | ||||
| 2004-2006 | 2007-2008 | 2009-2011 | 2004-2006 | 2007-2008 | 2009-2011 | ||||
| 1 | Agrani Bank | 1.000 | 1.000 | 0.667 | 1 | Arab Bangladesh Bank | - | - | 0.376 |
| 2 | Janata Bank | - | - | 1.000 | 2 | Bangladesh Commerce Bank | 1.000 | 1.000 | 1.000 |
| 3 | Rupali Bank | 0.854 | 0.964 | 0.239 | 3 | Bank Asia | 1.000 | 1.000 | 0.625 |
| 4 | Shahjalal Bank | 1.000 | 1.000 | 0.499 | 4 | BRAC Bank | - | - | 0.366 |
| 5 | City Bank | - | - | 0.707 | |||||
| 6 | Dhaka Bank | 0.566 | 1.000 | 0.199 | |||||
| 7 | Dutch-Bangla Bank | 0.270 | 0.045 | 0.536 | |||||
| 8 | Eastern Bank | - | - | 0.249 | |||||
| 9 | Export Import Bank of Bangladesh | - | - | 1.000 | |||||
| 10 | First Security Bank | 0.777 | 1.000 | 1.000 | |||||
| 11 | IFIC Bank | 0.729 | 1.000 | 0.309 | |||||
| 12 | Islami Bank Bangladesh | 0.797 | 1.000 | 1.000 | |||||
| 13 | Jamuna Bank | 0.025 | 1.000 | 0.230 | |||||
| 14 | Mercantile Bank | 0.679 | 0.212 | 0.419 | |||||
| 15 | Mutual Trust Bank | - | - | 1.000 | |||||
| 16 | National Bank | 0.435 | 0.118 | 0.876 | |||||
| 17 | National Credit and Commerce Bank | 0.669 | 1.000 | 1.000 | |||||
| 18 | One Bank | 0.691 | 0.289 | 0.487 | |||||
| 19 | Premier Bank | - | - | 0.544 | |||||
| 20 | Prime Bank | 1.000 | 1.000 | 1.000 | |||||
| 21 | Pubali Bank | 0.492 | 0.199 | 0.431 | |||||
| 22 | Sonali Bank | 1.000 | 1.000 | 1.000 | |||||
| 23 | Southeast Bank | - | - | 1.000 | |||||
| 24 | Standard Bank | 1.000 | 1.000 | 1.000 | |||||
| 25 | Trust Bank | 1.000 | 0.127 | 0.671 | |||||
| 26 | United Commercial Bank | - | - | 0.465 | |||||
| 27 | Uttara Bank | 1.000 | 1.000 | 0.680 | |||||
| All mean | 0.951 | 0.988 | 0.601 | All mean | 0.719 | 0.777 | 0.678 | ||
Profit efficiency pre, during and post global financial crisis: SBCs vs. PCBs
Table 3 shows the means of profit efficiency for pre, during and post global financial crisis periods of the SCBs and PCBs ownership. They are 95.1% vs. 71.9%, 98.8% vs. 77.7%, and 60.1% vs. 67.8% for SCBs and PCBs ownership, respectively. As for pre global financial crisis, the average SCBs and PCBs generate 95.1% vs. 71.9%, of profit efficiency pre crisis, less than what was initially expected to be generated. This result shows that the SCBs are generating more profit compared to the PCBs since the level of the profit efficiency for SCBs are higher than PCBs. With regards to profit efficiency during crisis period, the results indicate that, on average, the SCBs and PCBs shows the same findings since the level of profit efficiency of SCBs are higher than PCBs. This indicate that the SCBs banks have earn 98.8% vs. 77.7%, respectively, of the profit for the maximum outputs. For profit efficiency post global financial crisis, the results suggest that the average SCBs and PCBs can only earn 60.1% vs. 67.8% respectively, of what is available. Both categories of banks ownership lose the prospect of generating 39.9% and 32.2% additional outputs from the minimum level of inputs, respectively. Although SCBs and PCBs are show a declining level of profit efficiency after the crisis period, the level of profit efficiency on PCBs are higher than SCBs.
In conclusion, the empirical findings from this study indicate that although during the period of global financial crisis increase the profit efficiency to SCBs and PCBs, the ultimate impact of this crisis reduce the profit efficiency level to both ownership since it can be observed over the post global financial crisis. Even though PCBs reported an improvement and higher profit efficiency than SCBs, the efficiency level still lower compared to during financial crisis.
Robustness test
After examining the results derived from the SBM-DEA method, the issue of interest now is whether the difference in the profit efficiency level pre, during and post global financial crisis of the SCBs and PCBs are statistically significant. The Mann-Whitney (Wilcoxon) is a relevant test for two independent samples coming from populations having the same distribution. The most relevant reason is that the data violate the stringent assumptions of the independent group's t-test. In what follows, we perform the non-parametric Mann-Whitney (Wilcoxon) test along with a series of other parametric (t-test) and non-parametric Kruskall-Wallis tests to obtain robust results. Table 4 shows the robustness tests.
Table 4 Summary of parametric and non-parametric tests.
| Test groups | ||||||
|---|---|---|---|---|---|---|
| Parametric test | Non-parametric test | |||||
| Individual tests | t-Test | Mann-Whitney | Kruskall-Wallis | |||
| [Wilcoxon rank-sum] test | Equality of populations test | |||||
| Hypothesis | Median SCBs = Median PCBs | |||||
| Profit efficiency | t(Prb > t) | z(Prb > z) | X 2 (Prb > X 2) | |||
| Test statistics | Mean | t | Mean Rank | z | Mean Rank | X 2 |
| Pre-crisis | ||||||
| SCBs | 0.951 | 3.126*** | 39.222 | −1.751* | 39.222 | 3.066* |
| PCBs | 0.719 | 29.577 | 29.577 | |||
| During crisis | ||||||
| SCBs | 0.988 | 3.759*** | 27.750 | −1.250 | 27.750 | 1.563 |
| PCBs | 0.777 | 21.671 | 21.671 | |||
| Post-crisis | ||||||
| SCBs | 0.601 | −0.695 | 41.167 | −0.726 | 41.167 | 0.526 |
| PCBs | 0.678 | 46.734 | 46.734 | |||
*** Correlation is significant at the 0.01 level (2-tailed).
* Correlation is significant at the 0.01 level (2-tailed).
The results from the parametric t-test and non-parametric Mann-Whitney (Wilcoxon) test suggest that the SCBs have exhibited a higher mean profit efficiency level than PCBs peers pre financial crisis (0.951 > 0.719) and significantly different at 1%. Likewise, the SCBs have also exhibited a higher mean profit efficiency level during financial crisis compared to PCBs (0.988 < 0.777) and significantly different at 1%. The results from the parametric t-test are further confirmed by the non-parametric Mann-Whitney (Wilcoxon) and Kruskall-Wallis tests, but only for pre financial crisis. The interesting findings seem to suggests that the profit efficiency level of PCBs are higher than SCBs after the period of financial crisis (0.678 > 0.601). However, the result on the post global financial crisis shows that the profit efficiency level on PCBs and SCBs are not significantly different and this indicate that they are behave homogenously during that period. Thus, we can conclude that in general the financial crisis significantly lead to the lower profit efficiency level on the Bangladesh banking sector and it can reduce the level of profit efficiency specifically on both ownership of banks (SCBs and PCBs).
Residual analysis
Result of normality test
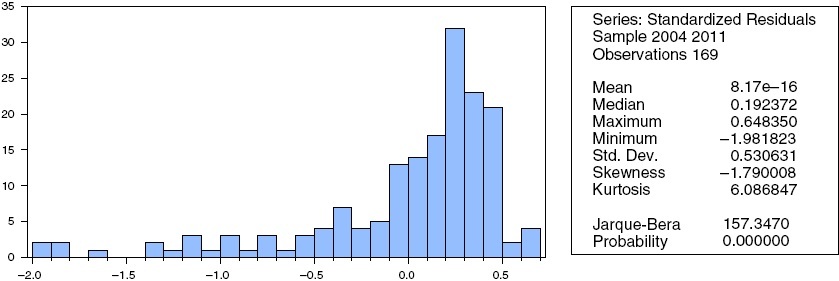
Figs. 2 and 3 exhibits the group normality test statistics. The results on PCBs (Fig. 2) revealed that the group value of skewness is -1.790, which indicates that the data are normal (error variable) since the value is in the range of ±1.96. Nevertheless, the values of Kurtosis and Jarque-Bera are not normally distributed because the Kurtosis's value is not in the range of ±2 and the value of Jarque-Bera is statistically significant at 1% level. While the results on SCBs shows that (Fig. 3) although the probability of Jarque-Bera is insignificant and the skewness value is around ±1.96, the kurtosis (3.977) is not around ±2. Therefore both results indicate that the error variable is not normally distributed. Thus, adopting the GLS method in both SCBs and PCBs is more suitable and is expected to produce better results (Gujarati, 2002).

Result of heteroscedasticity test
Tables 5 and 6 exhibits the results of the White General Heteroscedasticity test. The results of F-test for all SCBs and PCBs models fail to reject the null hypothesis of no heteroscedasticity problem, suggesting that the error variance is constant by applying the GLS regression along with the White's Heteroscedasticity Consistent Standard Errors technique, the heteroscedasticity problem in this study was solved (Gujarati, 2002).
Table 5 White general heteroscedasticity test on SCBs.
| Model 1 | Model 2 | Model 3 | Model 4 | Model 5 | Model 6 | Model 7 | Model 8 | Model 9 | Model 10 | Model 11 | Model 12 | |
|---|---|---|---|---|---|---|---|---|---|---|---|---|
| F-statistic | 1.322 | 0.346 | 1.040 | 1.836 | 0.544 | 0.280 | 0.403 | 0.321 | 0.141 | 0.943 | 1.651 | 2.315 |
| Obs R 2 | 1.334 | 0.354 | 1.053 | 1.840 | 0.554 | 0.287 | 0.412 | 0.328 | 0.144 | 0.956 | 1.659 | 2.306 |
| Prob. Chi-Sq. χ 2 | 0.248 | 0.552 | 0.305 | 0.175 | 0.457 | 0.592 | 0.521 | 0.567 | 0.704 | 0.328 | 0.198 | 0.129 |
| Ho (null-no heteroscedasticity problem) | Fail to reject Ho | |||||||||||
Table 6 White general heteroscedasticity test on PCBs.
| Model 1 | Model 2 | Model 3 | Model 4 | Model 5 | Model 6 | Model 7 | Model 8 | Model 9 | Model 10 | Model 11 | Model 12 | |
|---|---|---|---|---|---|---|---|---|---|---|---|---|
| F-statistic | 0.744 | 0.794 | 0.828 | 0.755 | 0.836 | 0.666 | 0.820 | 0.788 | 0.805 | 0.829 | 0.855 | 0.827 |
| Obs R 2 | 16.235 | 38.041 | 51.375 | 49.945 | 54.549 | 46.487 | 53.817 | 52.382 | 52.214 | 51.421 | 52.507 | 51.338 |
| Prob. Chi-Sq. χ 2 | 0.756 | 0.759 | 0.718 | 0.819 | 0.707 | 0.915 | 0.731 | 0.776 | 0.753 | 0.717 | 0.679 | 0.720 |
| Ho (null-no heteroscedasticity problem) | Fail to reject Ho | |||||||||||
Result of autocorrelations test
This study used the Durbin-Watson (DW) to test the autocorrelation problems. Tables 7 and 8 show the results of the autocorrelation test on SCBs and PCBs which suggest that the entire proposed model has no serial correlation or the errors are independent of each others because the value of the DW statistic is around 2 (Gujarati, 2002).
Table 7 Autocorrelation test using Durbin-Watson test on SCBs.
| Model 1 | Model 2 | Model 3 | Model 4 | Model 5 | Model 6 | Model 7 | Model 8 | Model 9 | Model 10 | Model 11 | Model 12 | |
|---|---|---|---|---|---|---|---|---|---|---|---|---|
| Durbin-Watson stat | 2.257 | 2.007 | 2.004 | 1.801 | 2.042 | 1.991 | 1.949 | 1.995 | 2.027 | 2.000 | 2.166 | 2.004 |
| Sel Est method | FE | FE | RE | RE | FE | FE | FE | FE | RE | RE | FE | RE |
Table 8 Autocorrelation test using Durbin-Watson test on PCBs.
| Model 1 | Model 2 | Model 3 | Model 4 | Model 5 | Model 6 | Model 7 | Model 8 | Model 9 | Model 10 | Model 11 | Model 12 | |
|---|---|---|---|---|---|---|---|---|---|---|---|---|
| Durbin-Watson stat | 1.956 | 1.920 | 1.927 | 2.317 | 1.934 | 2.274 | 2.299 | 1.936 | 1.932 | 1.927 | 1.925 | 1.927 |
| Sel Est method | RE | RE | RE | FE | RE | FE | FE | RE | RE | RE | RE | RE |
Determinants of profit efficiency on SCBs and PCBs
In essence, results from the first stage identify the level of profit efficiency of the SCBs and PCBs for specific year and bank. In what follows, we proceed to identify the internal (bank specific) and external (macroeconomic) factors which could improve the profit efficiency of the Bangladesh banking sector (Tables 9 and 10). To do so, we estimate 12 multivariate panel regression models which are presented in Tables 9 and 10. In Model 1, we report the regression results for the baseline regression model which include all six bank specific variables namely LNTA, LNLLRGL, LNETA, LNNIITA, LNNIETA, and LNLOANSTA. In regression Model 2, we introduce the macroeconomic variables namely LNGDP, LNINFL, and LNCR3, while the bank specific variables are retained in the regression model. In regression Model 3, we include the PTC variable to control for the post global financial crisis period.
Table 9 Multivariate regression analysis on SCBs under ordinary least square model.
| Variable | Model 1 | Model 2 | Model 3 | Model 4 | Model 5 | Model 6 | Model 7 | Model 8 | Model 9 | Model 10 | Model 11 | Model 12 |
|---|---|---|---|---|---|---|---|---|---|---|---|---|
| C | −7.816*** | 8.998*** | −8.09 | −3.006 | 6.662 | 4.74 | 8.252*** | 9.282*** | −9.508* | −7.81 | −1.341 | −8.747 |
| (2.618) | (3.255) | (5.480) | (6.345) | (4.291) | (5.265) | (3.027) | (3.240) | (5.660) | (5.468) | (5.146) | (5.605) | |
| Bank-specific variables | ||||||||||||
| LNTA | 0.361*** | 0.638*** | 0.835*** | 0.842*** | 0.647*** | 0.633*** | 0.671*** | 0.639*** | 0.842*** | 0.833*** | 0.790*** | 0.834*** |
| (0.127) | (0.093) | (0.071) | (0.105) | (0.052) | (0.043) | (0.064) | (0.048) | (0.072) | (0.071) | (0.075) | (0.069) | |
| LNLLRGL | 0.012 | 0.075 | −0.053 | −0.006 | 0.079 | 0.034 | 0.068 | 0.076 | −0.049 | −0.051 | −0.011 | −0.049 |
| (0.062) | (0.052) | (0.077) | (0.078) | (0.049) | (0.068) | (0.055) | (0.053) | (0.075) | (0.077) | (0.077) | (0.074) | |
| LNNIITA | −0.556*** | −0.640*** | −0.714*** | −0.758*** | −0.621*** | −0.542*** | −0.661*** | −0.656*** | −0.733*** | −0.713*** | −0.693*** | −0.717*** |
| (0.113) | (0.130) | (0.046) | (0.064) | (0.075) | (0.046) | (0.096) | (0.068) | (0.042) | (0.047) | (0.050) | (0.045) | |
| LNETA | 0.077 | 0.674*** | 0.741*** | 0.772*** | 0.673*** | 0.614*** | 0.719*** | 0.666*** | 0.727*** | 0.740*** | 0.716*** | 0.738*** |
| (0.053) | (0.129) | (0.020) | (0.024) | (0.059) | (0.066) | (0.032) | (0.036) | (0.021) | (0.021) | (0.029) | (0.021) | |
| LNNIETA | 0.237*** | 0.059 | 0.292*** | 0.246*** | 0.129*** | 0.116* | 0.084** | 0.044 | 0.296*** | 0.288*** | 0.202*** | 0.294*** |
| (0.065) | (0.060) | (0.062) | (0.072) | (0.048) | (0.065) | (0.040) | (0.054) | (0.061) | (0.062) | (0.054) | (0.063) | |
| LNLOANSTA | 3.278*** | 2.158*** | 3.043*** | 2.908*** | 1.765*** | 2.271*** | 2.273*** | 2.220*** | 3.490*** | 3.037*** | 2.914*** | 3.106*** |
| (1.093) | (0.740) | (0.348) | (0.524) | (0.505) | (0.527) | (0.544) | (0.467) | (0.393) | (0.350) | (0.436) | (0.364) | |
| Macroeconomic variables | ||||||||||||
| LNGDP | −5.385*** | 0.655 | −1.203 | −4.269*** | −3.973*** | −5.067*** | −5.584*** | 0.736 | 0.577 | −1.576 | 0.613 | |
| (0.916) | (1.757) | (1.905) | (0.989) | (1.268) | (0.535) | (0.666) | (1.715) | (1.753) | (1.554) | (1.737) | ||
| LNINFL | 0.896*** | −1.465** | −0.808 | 0.410** | 0.578*** | 0.705*** | 0.979*** | −1.406** | −1.411** | −0.168 | −1.508** | |
| (0.128) | (0.594) | (0.632) | (0.196) | (0.166) | (0.073) | (0.138) | (0.559) | (0.584) | (0.324) | (0.602) | ||
| LNCR3 | 1.008*** | −1.576*** | −0.996 | 0.732* | 0.684* | 0.668 | 1.146** | −1.430*** | −1.599*** | −1.405** | −1.139*** | |
| (0.366) | (0.505) | (0.617) | (0.416) | (0.378) | (0.513) | (0.498) | (0.442) | (0.514) | (0.583) | (0.402) | ||
| PTC | −0.961*** | |||||||||||
| (0.242) | ||||||||||||
| Bank-specific on post global financial crisis variables | ||||||||||||
| LNTA*PTC | −0.137*** | |||||||||||
| (0.050) | ||||||||||||
| LNLLRGL*PTC | −0.268*** | |||||||||||
| (0.092) | ||||||||||||
| LNNIITA*PTC | −0.337 | |||||||||||
| (0.221) | ||||||||||||
| LNETA*PTC | −0.121 | |||||||||||
| (0.087) | ||||||||||||
| LNNIETA*PTC | 0.091 | |||||||||||
| (0.156) | ||||||||||||
| LNLOANSTA*PTC | −0.523*** | |||||||||||
| (0.128) | ||||||||||||
| Macroeconomic on post global financial crisis variables | ||||||||||||
| LNGDP*PTC | −0.269*** | |||||||||||
| (0.068) | ||||||||||||
| LNINFL*PTC | −0.777*** | |||||||||||
| (0.244) | ||||||||||||
| LNCR3*PTC | −0.581*** | |||||||||||
| (0.146) | ||||||||||||
| R 2 | 0.292 | 0.585 | 0.776 | 0.709 | 0.638 | 0.621 | 0.59 | 0.587 | 0.777 | 0.774 | 0.715 | 0.777 |
| Adj R 2 | 0.235 | 0.533 | 0.744 | 0.667 | 0.586 | 0.567 | 0.531 | 0.528 | 0.746 | 0.742 | 0.674 | 0.745 |
| F-statistic | 5.095*** | 11.143*** | 24.301*** | 17.017*** | 12.327*** | 11.479*** | 10.068*** | 9.949*** | 24.436*** | 24.005*** | 17.578*** | 24.333*** |
| Durbin-Watson stat | 1.544 | 1.901 | 2.011 | 1.82 | 1.673 | 1.873 | 1.951 | 1.914 | 2.048 | 2.008 | 1.938 | 2.000 |
| No. of Obs. | 27 | 27 | 27 | 27 | 27 | 27 | 27 | 27 | 27 | 27 | 27 | 27 |
Figure in parentheses () are standard error.
* Significance at the 10% level.
** Significance at the 5% level.
*** Significance at the 1% level.
Table 10 Multivariate regression analysis on PCBs under ordinary least square model.
| Variable | Model 1 | Model 2 | Model 3 | Model 4 | Model 5 | Model 6 | Model 7 | Model 8 | Model 9 | Model 10 | Model 11 | Model 12 |
|---|---|---|---|---|---|---|---|---|---|---|---|---|
| C | −1.016 | −3.324 | 0.815 | 0.336 | −3.443 | −2.768 | −0.485 | −4.307* | 1.056 | 0.756 | −0.816 | 0.864 |
| (0.677) | (2.613) | (1.146) | (1.040) | (2.569) | (1.795) | (1.136) | (2.280) | (1.166) | (1.139) | (1.162) | (1.219) | |
| Bank-specific variables | ||||||||||||
| LNTA | 0.084*** | 0.118** | 0.107** | 0.076 | 0.114** | 0.116** | 0.108** | 0.119** | 0.110** | 0.107** | 0.109** | 0.107** |
| (0.027) | (0.049) | (0.050) | (0.057) | (0.053) | (0.052) | (0.051) | (0.048) | (0.049) | (0.050) | (0.050) | (0.050) | |
| LNLLRGL | 0.016 | 0.053 | 0.109 | 0.114 | 0.042 | 0.064 | 0.081 | 0.037 | 0.118 | 0.109 | 0.099 | 0.107 |
| (0.094) | (0.076) | (0.091) | (0.093) | (0.083) | (0.081) | (0.079) | (0.079) | (0.092) | (0.091) | (0.093) | (0.091) | |
| LNNIITA | −0.344*** | −0.406*** | −0.454*** | −0.439*** | −0.416*** | −0.521** | −0.506*** | −0.354*** | −0.448*** | −0.454*** | −0.454*** | −0.453*** |
| (0.110) | (0.118) | (0.124) | (0.120) | (0.119) | (0.220) | (0.146) | (0.124) | (0.123) | (0.125) | (0.129) | (0.125) | |
| LNETA | 0.175*** | 0.261* | 0.268** | 0.239* | 0.241 | 0.238 | 0.182 | 0.268* | 0.291** | 0.268** | 0.267** | 0.268** |
| (0.052) | (0.138) | (0.124) | (0.124) | (0.148) | (0.156) | (0.143) | (0.141) | (0.124) | (0.124) | (0.127) | (0.124) | |
| LNNIETA | −0.360 | −0.266 | −0.202 | −0.189 | −0.229 | −0.242 | −0.200 | −0.245 | −0.211 | −0.202 | −0.206 | −0.206 |
| (0.224) | (0.232) | (0.263) | (0.264) | (0.233) | (0.232) | (0.246) | (0.185) | (0.268) | (0.263) | (0.256) | (0.262) | |
| LNLOANSTA | 0.322 | 0.340 | 0.567 | 0.626 | 0.395 | 0.431 | 0.524 | 0.238 | 0.473 | 0.566 | 0.511 | 0.555 |
| (0.357) | (0.321) | (0.392) | (0.402) | (0.343) | (0.341) | (0.375) | (0.344) | (0.363) | (0.392) | (0.383) | (0.391) | |
| Macroeconomic variables | ||||||||||||
| LNGDP | 0.117 | −2.136*** | −1.980*** | 0.069 | −0.232 | −1.564** | 0.686 | −2.177*** | −2.121*** | −1.499** | −2.041*** | |
| (0.722) | (0.673) | (0.689) | (0.714) | (0.414) | (0.603) | (0.632) | (0.653) | (0.675) | (0.667) | (0.677) | ||
| LNINFL | 0.282*** | 1.288*** | 1.250*** | 0.339** | 0.449** | 1.061*** | 0.022 | 1.304*** | 1.272*** | 0.809*** | 1.280*** | |
| (0.069) | (0.362) | (0.394) | (0.145) | (0.226) | (0.358) | (0.226) | (0.357) | (0.360) | (0.283) | (0.381) | ||
| LNCR3 | 0.832*** | 2.235*** | 2.250*** | 0.927*** | 1.063** | 2.052*** | 0.478 | 2.249*** | 2.249*** | 2.211** | 2.025*** | |
| (0.254) | (0.702) | (0.788) | (0.292) | (0.457) | (0.753) | (0.479) | (0.700) | (0.712) | (0.890) | (0.653) | ||
| PTC | 0.408** | |||||||||||
| (0.159) | ||||||||||||
| Bank-specific on post global financial crisis variables | ||||||||||||
| LNTA*PTC | 0.079** | |||||||||||
| (0.035) | ||||||||||||
| LNLLRGL*PTC | 0.055 | |||||||||||
| (0.107) | ||||||||||||
| LNNIITA*PTC | 0.184 | |||||||||||
| (0.225) | ||||||||||||
| LNETA*PTC | 0.372*** | |||||||||||
| (0.181) | ||||||||||||
| LNNIETA*PTC | −0.240 | |||||||||||
| (0.206) | ||||||||||||
| LNLOANSTA*PTC | 0.221*** | |||||||||||
| (0.084) | ||||||||||||
| Macroeconomic on post global financial crisis variables | ||||||||||||
| LNGDP*PTC | 0.115** | |||||||||||
| (0.045) | ||||||||||||
| LNINFL*PTC | 0.374* | |||||||||||
| (0.199) | ||||||||||||
| LNCR3*PTC | 0.241** | |||||||||||
| (0.099) | ||||||||||||
| R 2 | 0.124 | 0.126 | 0.172 | 0.178 | 0.126 | 0.130 | 0.162 | 0.120 | 0.176 | 0.171 | 0.156 | 0.169 |
| Adj R 2 | 0.092 | 0.076 | 0.119 | 0.126 | 0.070 | 0.075 | 0.109 | 0.065 | 0.124 | 0.119 | 0.103 | 0.117 |
| F-statistic | 3.834*** | 2.540*** | 3.275*** | 3.428*** | 2.268*** | 2.358*** | 3.061*** | 2.162*** | 3.386*** | 3.266*** | 2.926*** | 3.220*** |
| Durbin-Watson stat | 1.679 | 1.678 | 1.706 | 1.708 | 1.678 | 1.674 | 1.706 | 1.668 | 1.717 | 1.705 | 1.702 | 1.707 |
| No. of Obs. | 169 | 169 | 169 | 169 | 169 | 169 | 169 | 169 | 169 | 169 | 169 | 169 |
Figure in parentheses () are standard error.
* Significance at the 10% level.
** Significance at the 5% level.
*** Significance at the 1% level.
Models 4-12 represent focused models adopted to identify the potential determinants of SCBs’ and PCBs’ profit efficiency specifically on post global financial crisis period. All the bank specific and macroeconomic variables are retained in these models (Model 4-Model 12). This study include interaction variables namely LNTA*PTC, LNLLRGL*PTC, LNNIITA*PTC, LNETA*PTC, LNNIETA*PTC, LNLOANSTA*PTC, LNGDP*PTC, LNINFL*PTC and LNCR3*PTC.
Tables 9 and 10 summarize that, size (LNTA) reveals a positive relationship with profit efficiency for both SCBs and PCBs and this is statistically significant at 1% and 5% levels (except Model 4 of Table 10). This result implies that the larger (smaller) size banks tend to exhibit higher (lower) profit efficiency. This provide support to the argument that large banks may benefit from economies of scale which enables them to generate higher profits. Large banks may achieve higher profit efficiency levels because their costs are compensated by higher profits that are generated via quality services. Besides, large banks may have better capabilities to capitalize on profit enhancement activities and better cost cutting opportunities compared to their smaller bank counterparts. This result is consistent with study such as Sufian et al. (2012) providing support to the argument that big banks have high efficiency levels compared to medium and small banks.
The coefficient of LNNIITA has consistently exhibits a negative sign (statistically significant at the 5% level or better) for both banks (Tables 9 and 10). The results imply that banks which derived a higher proportion of its income from non-interest sources such as fee based services tend to be relatively less efficient in their intermediation function. The finding is in consonance with the earlier studies by among others Sufian and Habibullah (2009b) and Stiroh (2006). To recap, Stiroh and Rumble (2006) find that diversification benefits of the U.S. financial holding companies are offset by the increased exposure to non-interest activities, which are much more volatile, but not necessarily more profitable than interest generating activities.
With regard to the impact of capitalization (LNETA) on profit efficiency it can be observed from Tables 9 and 10 that the coefficient LNETA exhibits a positive sign for both SCBs and PCBs (except Model 1 of Table 9 and Models 5,6,7 of Table 10). The positive coefficient of capitalization signifies the positive relationship between capitalization and profit efficiency of the banks where the well-capitalized banks would increase banks’ revenue and profitability due to the lower expected costs of financial distress, lower expected bankruptcy costs, and lower risk of portfolio. Such advantages will then be translated into high profitability (Demirguc-Kunt & Huizinga, 1999).
Likewise, it can be observed from Table 9 that the overhead expenses (LNNIETA) and liquidity (LNLOANSTA) have significant positive relationship only in SCBs at the 1% level. The LNNIETA is the proxy of overhead expenses applied to provide the information on variation in operating costs across the financial system. It reflects employment, total amount of wages and salaries, as well as the cost of running branch office facilities. The positive sign indicates that higher profit earned by banks that are more efficient may be appropriated in the form of higher payroll expenditures paid to the more productive human capital. This ensures a high SCBs profit efficiency in Bangladesh.
On the other hand, referring to the impact of bank's loan intensity or liquidity, we find that LNLOANSTA is positively related only to the profit efficiency of SCBs operating in the Bangladesh banks. This finding implies that the higher the liquidity is, the higher the SCBs profit efficiency is. Higher liquidity is required to fund large loans in order to increase the profitability of the banks. The liquidity risk arises from the possible inability of banks to accommodate declining liabilities or to provide funds on the assets’ side of the balance sheet. This is considered an important determinant of the banks’ efficiency. Higher expected return is expected to be generated from the risky loan market (bank's asset). Thus, a higher liquidity is required to fund large loans in order to increase the profitability of the SCBs and this implies that liquidity has a positive relationship with banks’ profit efficiency.
The findings suggest that the coefficient for economic growth (LNGDP) is negative for both SCBs (refer Models 2,5,6,7,8 of Table 9) and PCBs (refer Models 3,4,7,9,10,11,12 of Table 10). The negative sign indicates that the higher the economic growth is, the lower the bank profit efficiency is. This result may be due to the volatile economic growth that drives banks to suffer from lower demand for their financial services, increased loan defaults and thus depleted outputs.
This study discover that, the coefficient of LNINFL and lnCR3 are mixed (positive and negative) in SCBs but produce consistently positive sign in PCBs. On one hand,the LNINFL variable is positive sign indicates the banks will charge a higher interest rate and obtain higher profit. The banks may obtain higher income since the number of borrowers increases even though the interest rate is higher because the consumer assumes there will be much higher inflation for the future that will lead to further increase in interest rates. On the other hands, the negative relationship indicate that the borrowers will react negatively to the increase in inflation as they believe the rate of inflation may be reduced in the future.
Furthermore, the lnCR3 has a positive sign under both SCBs and PCBs providing support to the Structure-Conduct-Performance (SCP) hypothesis. The SCP theory posits that the SCBs and PCBs banks in a highly concentrated market tend to collude, and therefore earn monopoly profits. The higher the bank concentration is, the lower the cost of collusion between firms or banks is. This will lead to higher bank profitability. Market concentration reveals the monopoly power of the banks. This explains the positive relationship between market concentrations with bank efficiency. Meanwhile the coefficient of market concentration (lnCR3) also exhibits a negative sign for SCB banks (Table 9). The negative sign for market concentration in SCBs imply that increased bank concentration (by increasing the credit cost) will reduce the firms’ demand for credit and consequently retard or slow down the growth of the economy.
Finally, it is discovered that the impact of global financial crisis or post global financial crisis (PTC) is significantly negative and positively to the profit efficiency of the SCBs and PCBs. The negative sign in Table 9 indicate that the SCBs banks’ funding structure depends mostly on wholesale funding that consists of funding from other nonbank investors, other banks, corporate treasuries and money market funds. This wholesale funding that is practised by the banks is more exposed to the liquidity risk that can be disseminated via the financial sector's interlinked relationship which contributes the banks’ vulnerability to liquidity shocks. Therefore, the financial crisis lead to liquidity shock that hitting one bank may lead to bank runs on solvent banks since depositors may assume that the whole banking system is bogged with insufficient liquidity. Liquidity shock limits the banks capabilities to run their operation and lead to lower banks’ profit efficiency. It could also cause bankruptcies in the banking system (Smolo & Mirakhor, 2010).
Meanwhile, the coefficient of the PTC exhibits an positive relationship with the PCBs’ profit efficiency in Table 10. This indicates that global financial crisis may increase the banks’ profit efficiency due to the excess liquidity in their accounts. Therefore, PCBs need to hold massive cash or very low return assets as their liquid assets in order to avoid liquidity risk. Because of this reason, the PCBs are stable during the financial crisis in contrast to SCBs.
Determinants of profit efficiency on SCBs and PCBs specifically on post global financial crisis
The internal and external determinants of SCBs and PCBs profit efficiency may react differently on post global financial crisis. In what precedes, we seek to identify factors which influence the profit efficiency of the both banks on post global financial crisis. To do so, we include the interactions of all the bank specific and macroeconomic determinants against the PTC variable. As a result, 9 new bank specific interaction variables namely LNTA*PTC, LNLLRGL*PTC, LNNIITA*PTC, LNETA*PTC, LNNIETA*PTC, LNLOANSTA*PTC, LNGDP*PTC, LNINFL*PTC and LNCR3*PTC are introduced in regression Models 4 to 12 respectively.
The empirical findings presented in Model 4,7,11,12 of Table 10 suggest that the result of LNTA*PTC, LNETA*PTC, LNINFL*PTC and LNCR3*PTC coefficient remain the same on PCBs but not SCBs. The LNTA*PTC, LNINFL*PTC, LNCR3*PTC variables changed the sign to negative and it should be noted that the coefficient of the LNETA*PTC is statistically insignificant after controlling the post global financial crisis period in SCBs (Table 9).
The size of banks (LNTA*PTC) turn negative to SCBs (Table 9). The empirical findings presented in Model 4 of Tables 9 and 10 suggest that the sign of LNTA*PTC coefficient remain the same on PCBs but turn negative to SCBs. The large SCBs operate at diseconomies of scale since banks only enjoy small increase of output although the inputs are proportionately increased. Besides, large banks have the capabilities to increase the diversification to reduce the credit risk but it would drive the returns lower. Indirectly, this indicates that the effect of large SCBs size can be negative with the banks’ profitability on post global financial crisis
Furthermore, the LNLLRGL*PTC have a negatively significant only to the SCBs profit efficiency. This implies that SCBs with a higher credit risk will have lower bank efficiency. A higher credit risk means that banks may deal with a higher possibility that its loans will become non-performing. Thus, the higher credit risk indicates the higher possibility of the banks to be confronted with unpaid loans and increasing of the non-performing loans, which both, imply lower asset quality.
Turning to the liquidity variable, the empirical findings seem to suggest the LNLOANSTA*PTC turns into negative and significant with the SCBs profit efficiency but positively to PCBs after controlling the post global financial crisis. The negative LNLOANSTA*PTC to the SCBs profit efficiency indicate that a high amount of liquidity could have an effect on the banks during a weak economy (global financial crisis). Borrowers are likely to default on their loans and this drives lower profitability.
A closer examination on the variable of economic growth on post global financial crisis indicates a changing sign to positive relationship with the profit efficiency of the PCBs (Model 11 of Table 11) but remain the same on SCBs. The positive LNGDP*PTC signify that the favourable economic conditions during the global financial crisis period have fuelled higher demand for PCBs products and services, reducing default loan probabilities and thus increasing the profitability of the PCBs. High economic growth motivates PCBs to serve more loans and improve the quality of their assets.
Main results: controlling for heteroscedasticity
In general, the preliminary results obtained using the OLS as an estimation model indicate that the coefficients of LNTA*PTC, LNLLRGL*PTC, LNLOANSTA*PTC, LNGDP*PTC, LNINFL*PTC and LNCR3*PTC represent as the determinants that negatively influence the level of SCBs profit efficiency specifically on post global financial crisis period (Table 9). Meanwhile, the coefficients of LNTA*PTC, LNETA*PTC, LNLOANSTA*PTC, LNGDP*PTC, LNINFL*PTC and LNCR3*PTC are significantly positive with the PCBs profit efficiency after controlling the period of global financial crisis (Table 10). However, this study proceed the analysis using the GLS estimation method in order to obtain robust results. Therefore the main results are based on regression models under this estimation method.
The Generalized Least Square (GLS) comprising the Fixed Effect (FE) and Random Effect (RE) method is used for the robustness test rather than the Ordinary Least Square (OLS) as method of estimation to estimate the panel data regression formed. The decision is made following Gujarati's (2002) suggestion that GLS may overcome the heteroscedasticity, resulted from utilizing financial data with differences in sizes. Due to the fact that the sample employed in this study consists of small and large banks, differences in sizes of the observations are expected to be observed. The usual practice of econometrics modelling assumes that error is constant over all time periods and locations due to the existence of homoscedascity. Nevertheless, problems could arise which lead to heteroscedasticity issues as variance of the error term produced from regression tend not to be constant, which is caused by variations of sizes in the observation. Therefore, the estimates of the dependent variable will be less predictable (Gujarati, 2002).
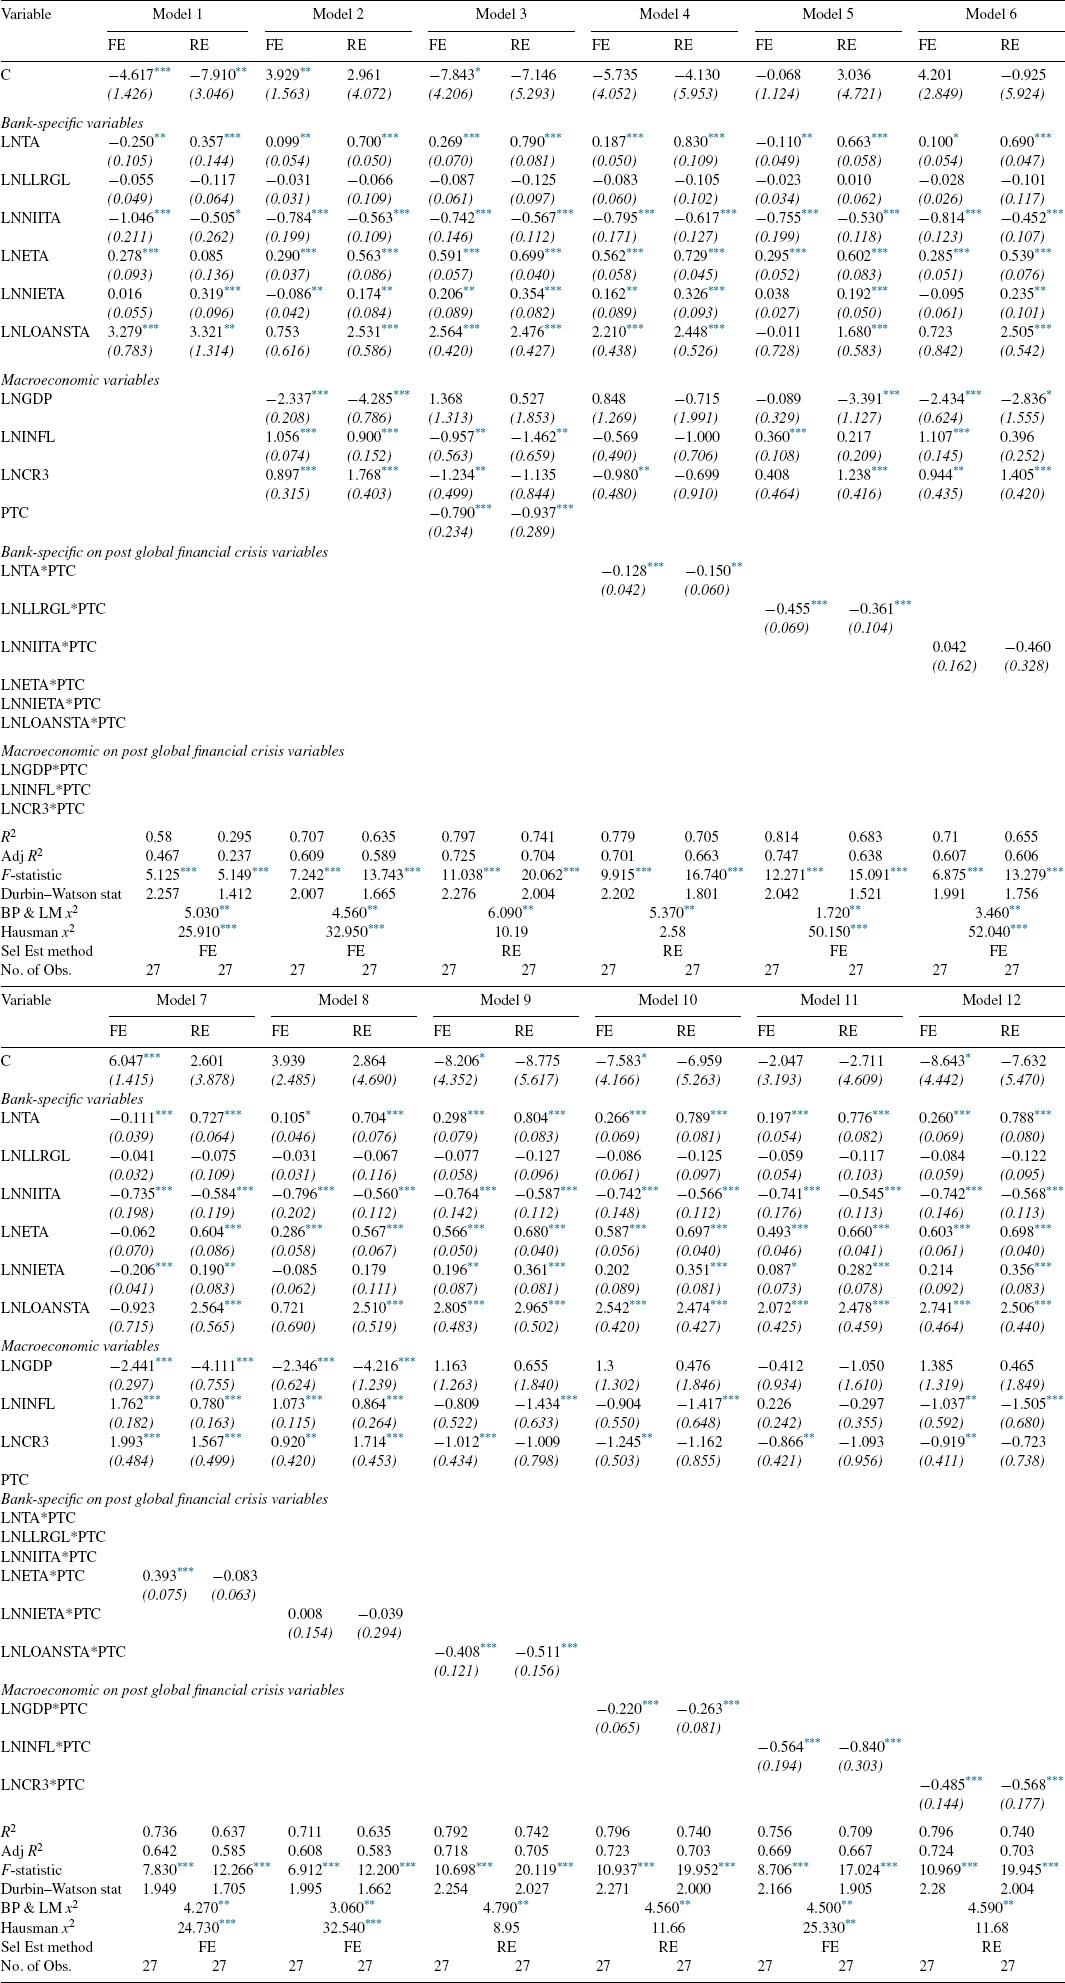
The results from Tables 11 and 12 shows that the panel data is most suitable to be used in this study since the p-value of the Breusch Pagan and Lagrangian Multiplier (BP and LM) Chi-Square (χ2) test is significant at 5% and 1% levels in all models. Furthermore, the selection of estimation method of FE (significant at 5% or better levels) and RE (insignificant) regression analysis are based on the Chi-Square (χ2) of the Hausman test. The results clearly indicate that the FE is preferable in Models (1,2,5,6,7,8,11 of Table 11 and 4,6,7 of Table 12) and RE is suitable in Models (3,4,9,10,12 of Table 11 and 1,2,3,5,8,9,10,11,12 of Table 12). Therefore, for the purpose of this study, we will proceed with the analysis based on the FE and RE focusing only on the specific determinants on post global financial crisis period (interaction model 4-12 of Tables 11 and 12).
Table 12 Panel regression analysis on PCBs under fixed and random effects model.
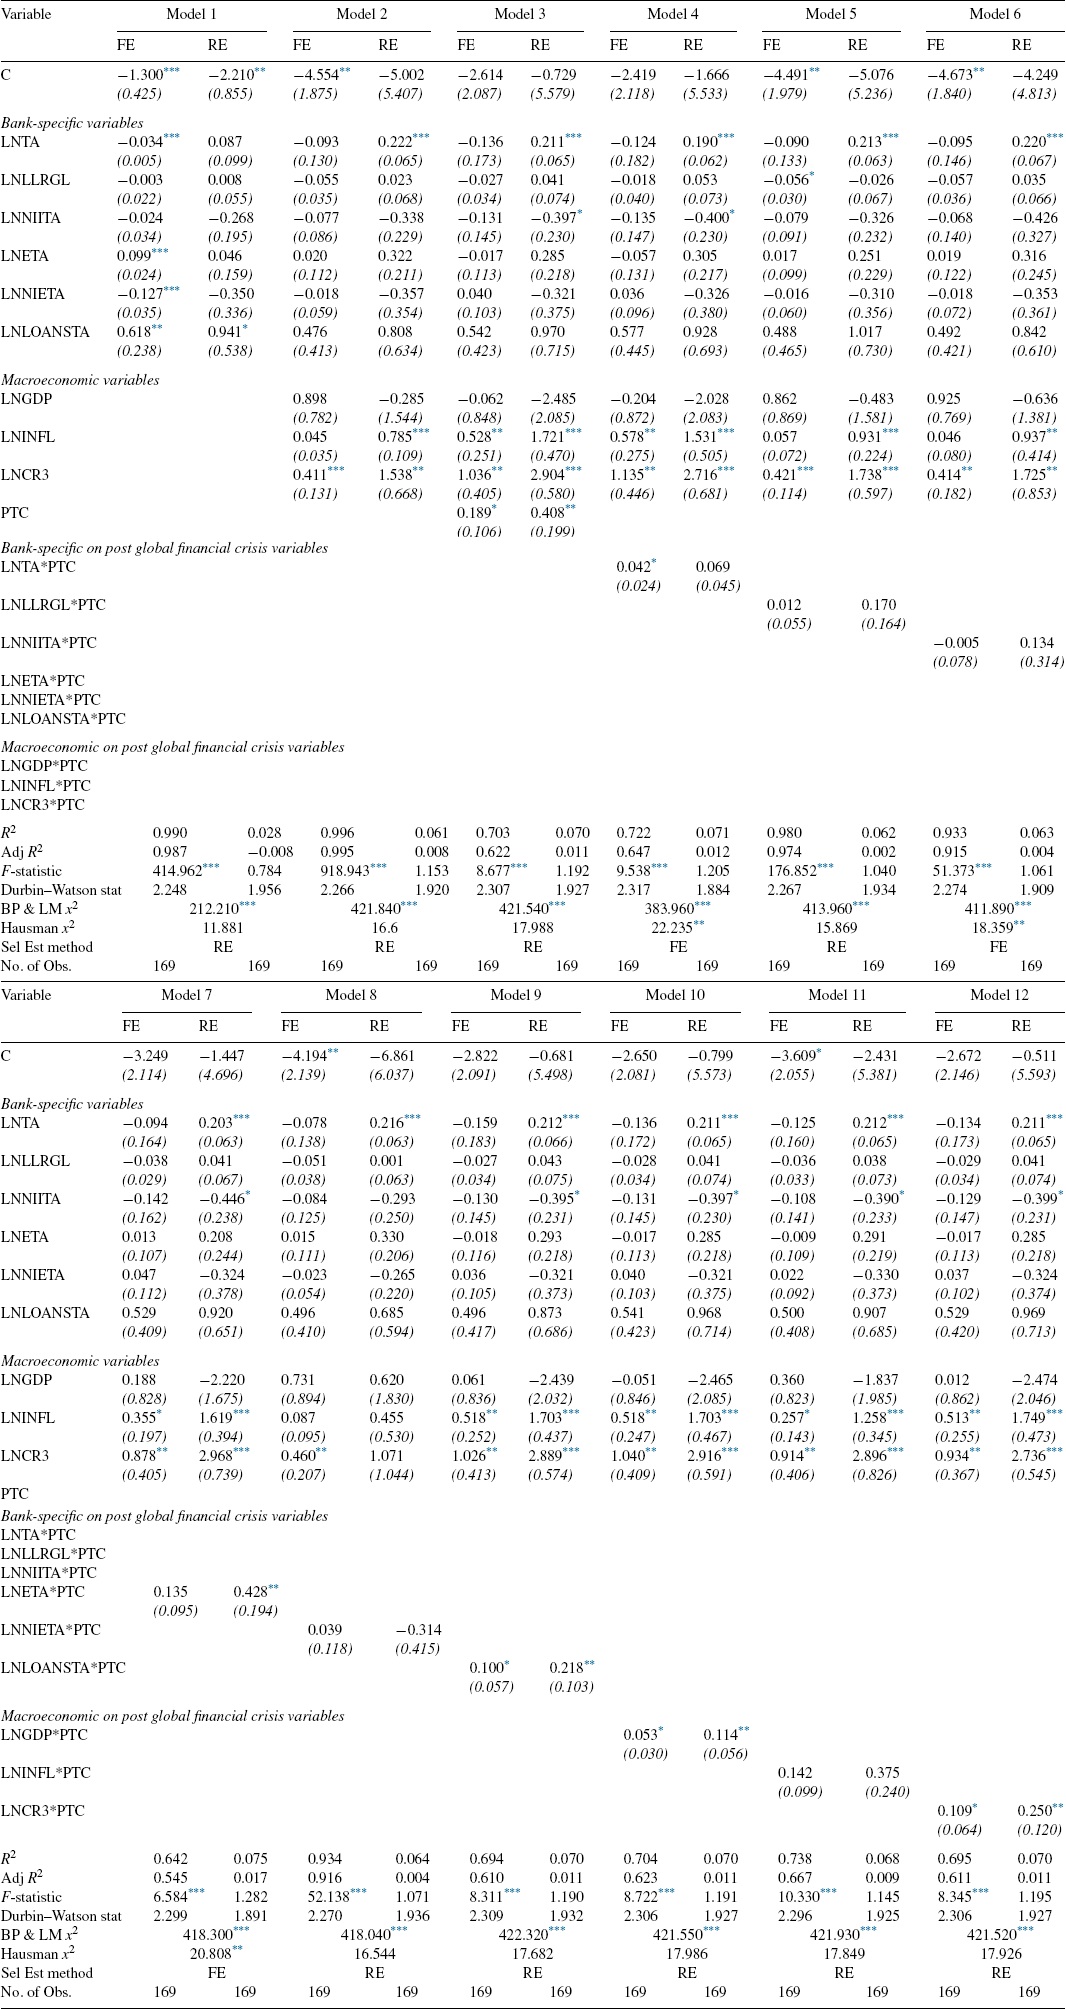
Figure in parentheses () are standard error.
* Significance at the 10% level.
** Significance at the 5% level.
*** Significance at the 1% level.
It can be observed from Models 4-12 of Tables 11 and 12 that the coefficients of the interaction variables (specific determinants on post global financial crisis) mostly remain the same. They exhibit the same sign, the same order of magnitude, and remain significant as in the OLS regression models (albeit sometimes at different levels). However, it can be observed from Table 11 the coefficient of capitalization (LNETA*PTC) turn into significantly positive relationship with profit efficiency for SCBs (Model 7) under FE estimation after controlling for heteroscedasticity. This implies, the higher capitalization, contribute to the higher SCBs’ profit efficiency specifically on post global financial crisis.
Finally, it should be noted that the coefficient of the size (LNTA*PTC) is remain significant with the PCBs profit efficiency under FE estimation (Model 4 of Table 12) when we control for potential heteroscedasticity. However, the result need be interpreted with caution since the coefficient of the variable is significant only at 10% level. Meanwhile, when this study control for heteroscedasticity, the coefficient of inflation on post global financial crisis (LNINFL*PTC) turn into insignificant exhibited in Model 11 of Table 12. Thus, this explain that the factor of inflation is not significantly influence the profit efficiency of PCBs on post global financial crisis.
Conclusions
To date, studies on bank efficiency are numerous. However, most of these studies have concentrated on the banking sectors of the western and developed countries. Therefore, this study investigate for the first time empirical evidence on impact of global financial crisis focusing on SCBs and PCBs ownership and others bank specific and macroeconomics factors influencing profit efficiency level of the Bangladesh banking sector. By using data on Bangladesh banks during the years 2004-2011 the present study fills in this demanding gap by providing new empirical evidence. The present study consists of two stages. In the first stage, this study employ the Slack-Based Data Envelopment Analysis (SBM-DEA) method to measure the level of profit efficiency on SCBs and PCBs over the period of pre, during and post global financial crisis. In the second stage, this study adopt a multivariate panel regression analysis framework based on the Ordinary Least Square (OLS) and Generalized Least Square (GLS) methods comprising the Fixed Effect (FE) and Random Effect (RE) models to examine the potential determinants of banks’ profit efficiency.
The empirical findings from the first stage indicate that the levels of profit efficiency on both SCBs and PCBs are increasing by 3.7% (95.1% to 98.8%) on SCBs and increasing by 5.8% (71.9% to 77.7%) on PCBs during financial crisis years (2007-2008). However, over the period of post financial crisis years (2009-2011) exhibited that, profit efficiency levels on SCBs and PCBs are decreasing by 38.7% (98.8% to 60.1%) on SCBs and decreasing by 9.9% (77.7% to 67.8%) on PCBs.
Although profit efficiency levels on both ownership of banks shows declining over the post financial crisis years, the PCBs still higher than SCBs (67.8% > 60.1%) but insignificantly different. Accordingly, this results could suggest that to avoid the declining of the profit efficiency levels over the period of post financial crisis, banks should identify the potential external and internal determinants that can significantly influence to the improvement of SCBs and PCBs efficiency.
Furthermore, the results from the multivariate panel regression analysis discovered the potential bank specific and macroeconomics determinants that significantly influence the improvement of profit efficiency levels on both SCBs and PCBs specifically on post global financial crisis period. A closer examination on the findings reveals that the relationship of size of bank (LNTA*PTC), liquidity (LNLOANSTA*PTC), economic growth (LNGDP*PTC) and market concentration (LNCR3*PTC) are significantly negative with profit efficiency of SCBs but have a positive impact in the case of the PCBs ownership.
This result implies that over the period of post global financial crisis, the large size of banks, higher liquidity, well economic growth and higher market concentration tend to lead to lower level of SCBs’ profit efficiency. This indicate that the SCBs operated at diseconomies of scale, borrowers are likely to default on their loans, the volatile of economic growth and reducing the credit demand from the firms. Therefore, the results suggest that to improve or increase the level of SCBs’ profit efficiency, banks should shrink the banks’ size, reduce the liquidity, await for the stable economic growth and squeeze the market concentration since those determinants have negative relationship with efficiency.
Meanwhile, the contra finding for the PCBs indicate that over the global financial crisis period banks may benefit from economies of scale, banks used huge liquidity to fund large loans, reducing on the default loan and the PCBs earn the monopoly profits. Thus, based on the findings reveal, the PCBs should promote growth for size of banks, enhance the liquidity, offer more loans and increase the market concentration in order to obtain higher level of profit efficiency since these variables have a positive relationship with the banks’ profit efficiency specifically over the global financial crisis period.
Furthermore, the variables of credit risk (LNLLRGL*PTC) and inflation (LNINFL*PTC) are significant with the negative sign but the capitalization (LNETA*PTC) is significantly positive with the profit efficiency of the SCBs specifically on post global financial crisis period. This results indicate that the over the period of post crisis, SCBs with a higher credit risk (LNLLRGL*PTC) will have lower bank efficiency. A higher credit risk means that banks may deal with a higher possibility that its loans will become non-performing. Thus, the higher credit risk indicates the higher possibility of the banks to be confronted with unpaid loans and increasing of the non-performing loans, which both, imply lower asset quality. Furthermore, the negative coefficient of LNINFL*PTC indicate that the borrowers will react negatively to the increase in inflation as they believe the rate of inflation may be reduced in the future. Finally, the positive coefficient of capitalization signifies the well-capitalized banks would increase banks’ revenue and profitability due to the lower expected costs of financial distress, lower expected bankruptcy costs, and lower risk of portfolio.
The empirical findings from this study clearly call for regulators and decision makers to review the profit efficiency of banks operating in the Bangladesh banking sector. This consideration is vital because profit efficiency is the most important concept which could lead to higher or lower profitability of the Bangladesh banking sector. The results could also provide better information and guidance to bank managers, as they need to have clear understanding on the impact of profit efficiency on the performance of their banks. The findings may also have implications for investors whose main goal is to reap higher profit from their investments. By doing so, they could concentrate on the potential profitability of banks before investing.

