


 nova página do texto(beta)
 Inglês (pdf)
 Artigo em XML
 Referências do artigo
 Enviar este artigo por email
 Citado por SciELO
  Similares em
SciELO
Similares em
SciELO 
 Permalink
JEL classification: M41; D24; M10
Introduction
Notions of cost behavior are a key element in management accounting. In the traditional model of cost behavior that permeates the literature of accounting, the costs are described as fixed or variable with respect to changes in the volume of activity (Anderson, Banker, & Janakiraman, 2003). In this model, some authors like Leone (1982) and Horngren, Foster, and Datar (2000) argue that variable costs alter in proportion to changes in the volume of activity, implying that the magnitude of a change in costs depends primarily on the extent of change activity level, not in the direction of change.
However, there are authors like Noreen and Soderstrom (1997) who argue that the costs have asymmetric behavior and increases more with elevation of the activity volume than decreases when the activity levels of the company falls. This realization got more strength from the findings in the study by Anderson et al. (2003), who compared the traditional model of cost behavior with a “alternative” model, where costs increase more when activity rises than falls when the activity decreases. These models have been tested by the authors in a sample of 7629 companies over 20 years. The results show consistency with the approach proposed by the authors in the “alternative” model theory, which was called sticky costs.
Through this cost behavior found in the study by Anderson et al. (2003), sticky costs began to be studied in samples of companies in different countries around the world, the focus of research of several authors in the management area of accounting. In Brazil, the pioneering work was developed by Medeiros, Costa, and Silva (2005), who used 198 publicly traded companies with information between 1986 and 2002 to test four hypotheses related to sticky costs, being these partially accepted in this scenario.
In a current view, Malik (2012) points out that there is a latent complexity between costs and volume of organizations activity. Thus, studies addressing that the costs do not move in proportion to activity levels has had a significant role in the understanding of this area of accounting, especially in terms of analyzing the input cost and value of outputs provided for such entries. This is also linked to improvement of cost accounting systems that help managers improve the decision-making process in order to achieve the efficiency that ultimately will generate higher profitability.
Similarly, Abu-Serdaneh (2014) reports that a clear understanding of cost behavior is essential in management accounting, because this provides evidence for countless decisions-making, even related to the budget. Moreover, in the current global context, globalization is more and more present, providing fierce competition between organizations across borders, which need to understand the costs behavior to remain active in the market. In this regard, Benachenhou (2013) points out that globalization tends to cause, at times, instability in the growing of emerging markets, driven by competition between the emerging nations itself.
In this context, there is also another important factor to consider, which are the macroeconomic aspects of the countries that can interfere with the behavior of business costs. Such economic relationship has been explored mainly in the Asian context, as in the studies of He, Teruya, and Shimizu (2010) and Abu-Serdaneh (2014), who observed GDP growth as a significant determinant of sticky costs.
Despite the importance of this topic, there are few studies carried out in Brazil seeking to compare the behavior of costs in Brazilian companies with other countries such as Latin American companies, especially trying to relate macroeconomic factors to understand differences that may affect the competitiveness of organizations in world market. Moreover, as pointed out Abu-Serdaneh (2014), the area that studies the behavior of cost empirically is relatively new and therefore deserves to be better exploited.
Thus, considering all study opportunities identified in the literature comes the following research question: What is the behavior of the costs of the largest publicly traded companies in Brazil, Chile and Mexico between 2002 and 2013? The main objective of this research is to verify the behavior of the costs of the largest publicly traded companies in Brazil, Chile and Mexico between 2002 and 2013.
The sticky cost behavior accept in this study is defined as the rise more steeply costs while increasing revenue than reducing costs while the decrease in revenue in the same proportion, which is observed from a percentage change of 1%. These criteria are the same used by Anderson et al. (2003) for the analysis of sticky costs.
The study is justified by the need to understand the behavior of costs, since the accounting and cost analysis helps business management and it is important to maintain the continuity and survival of businesses. Therefore, decisions using cost information is essential to achieving an appropriate level of profitability. The lack of cost information threatens the economic and financial companies stability, which can compromise the continuity of the organizations.
In the same way, considering companies that operates in the capital market, the information of the relationship between Total Costs (TC) and Net Sales Revenue (NSR) interest to different users of accounting information. In addition, the study is also justified to investigate a theme and a context little studied, since the costs behavior and the investigated countries (Brazil, Chile and Mexico) are presented as important field studies, once they are emerging economies.
Literature review
In this chapter the literature review is carried out to support the factors discussed in the research. Thus, the chapter was separated from the perspective of three pillars, being: costs behavior, sticky costs and macroeconomic determinants of sticky costs. It should be noted that for the theoretical approach, we performed the subject search in Jstor, Scielo, Science Direct, Scopus and Wiley Online Library, and professional journals on the subject, allowing support the study of relevant papers published in scientific journals high impact.
Cost behavior
The cost behavior to Hansen and Mowen (2001), is the general term for delineating if a value changes when the level of production changes. Thus, for these authors, the costs of conduct of the explanation demands the measure of activity implementation, suggested by the cost drivers. In this context, Medeiros et al. (2005) emphasize that the costs behavioral data relevant for both researchers and professionals directly related to business activities, especially to these last that use of knowledge of how the costs may vary depending on the economic activity and support base of many management decisions.
As the cost drivers for Oliveira, Lustosa, and Sales (2007), elucidate variations in costs for a certain period of time. It is a variable that eventually affects costs, i.e. there is particular cause and effect relationship between variations in the level of activity or volume and the total level of costs, into a relevant range.
As explained by Garrison and Noreen (2001), the understanding on the part of administrators on how costs behave sustains decision making, since such behavior reflected as a cost reacts or responds to changes in the level of activity. The way these change from modifications in activity levels or the volume of production is a necessary knowledge to managers, in order to reduce the doubts of how costs are generated when activities are performed (Gomes, Lima, & Steppan, 2007). Therefore, responses to changes in production volume are the subject of understanding on the part of decision makers in virtually all sectors (Atkinson, 2000, p. 182).
In this sense, some studies have been conducted in order to consistently understand the behavior of costs to business, seen its importance to the management of organizations. The evidence found by Banker, Potter, and Schroeder (1995), suggest that the indirect costs are driven not only by the volume of production but also for transactions resulting from the complexity of the productive structure of the organization. Looking investigate such relationships, the authors segregated cost drivers in volume and complexity, which is measured by indicators such as the quality. In a sample of 32 electronics companies, machinery and automotive components, the authors found that there is a strong relationship between the indirect costs of manufacturing and production volume. However, most of the variation in the indirect costs is explained by measures complexity of manufacturing operations.
Smith and Mason (1996) checked the performance, stability and ease of modeling cost estimation by using regression and neural networks, making a comparison between them. The results show that neural networks have greater explanatory power when working with low knowledge data from the variables involved in the model. Already regression, when the identification and understanding of the variables, provides significant advantages in terms such as precision, variability and creation and examination of the model in estimating cost.
In Brazil, Zatta, Freire, Coser, Sarlo Neto, and Zanqueto FIlho (2003) investigated the behavior of indirect costs in relation to net operational revenue on an electricity distribution company located in the southeast region. Using regression analysis statistical technique on the cost structure and net operational revenue of the company, the authors observed there is no relation between the modifications of indirect fixed costs (MMC - Modification of Manageable Costs) by the change in net operating revenue.
Weiss (2010) noted how the behavior of costs affects on forecast earnings, especially concerning the forecast of analysts. With a sample of industrial companies and observing a longitudinal period, the author found that, among other things, cost behavior and its asymmetry influence the priorities of analysts and investors who use this information to observe the value of the company.
In order to identify the behavior of costs in Yarn and Fabrics sector in Santa Catarina's public companies listed on the BM&FBovespa, Richartz, Nunes, Borgert, and Dorow (2011) promoted a longitudinal study with the analysis of financial information obtained from such companies between 1990 and 2009, adjusting them by the CPI a inflation index. The analysis, based on descriptive statistics and linear correlation coefficient of Pearson, revealed that the Cost of Goods Sold (COGS) consumed on average 78.88% of the Net Sales of the companies surveyed, and the observed tendency is for companies with higher revenues have better relationship between COGS/NSR.
Note that not all the results found in previous studies converge, suggesting there is no similarity between cost behavior patterns in the investigated companies. These results reveal that the behavior of costs may differ from company to company and from period to period. For this reason, comparative analyzes become appropriate to be able to evaluate the relationship between COGS/NSR, as well as the evolution of the behavior of costs in different companies and periods, as well as the context investigated in this research.
Sticky costs
Traditional models of behavior cost found in literature distinguish costs in fixed and variable with regard to variations in the level of activity. In this context, the fixed costs are considered independent of the activity level, while the variable costs are allowed to change up linearly and proportionally the changes in the level of activity of the companies. So realize that underlies the traditional model costs a number of assumptions that, besides simplifying the real world, distance from this model of how the costs actually behave (Calleja, Steliaros, & Thomas, 2006).
Given this traditional prerogative, rises a new approach that considers that costs have asymmetric behavior. More broadly, Anderson et al. (2003) reported that the cost of sales, general and administrative responds differently to rising and falling changes in the company's activity, and, when revenue increases costs increases proportionally more than falls into a possible decline in revenue. This fact occurs, according to the authors (2003), due to several aspects, including the tenacity to dismiss employees when loss occurs in the activity, by status issues that the company does not want to show that it is in an adverse moment, by the delay there to be able to identify the reduction of activity, among many other factors.
In addition, Calleja et al. (2006) points out that an important premise for cost stickiness is that when there are signed contracts, managers often fail to shut or renegotiate the terms or, if you can, it's too expensive because there contractual fines. With this, the demand decline of case managers may decide to retain underutilized resources, rather than incurring contract costs ruptures, causing asymmetry in costs and corroborates the premises of sticky costs.
More broadly, He et al. (2010) differ in that companies have their costs changed according to volume of activity. Increased revenues creates positive changes in cost, however, when revenue decreases, at times, managers may be hesitant to reduce assets, number of employees, or other resources that generate costs, allowing it cost stickiness as delineation of sticky costs.
To understand the managers behavior that influence the costs behavior, are exhibited two main reasons: the first is based on agency theory, which states that managers tend to make decisions in order to maximize their own interests at the expense of business interests and this way they maintains unused resources to avoid personal consequences; the second reason part of understanding that managers fights to reduce decline in cost of revenues for not having sure of future demands and therefore they will purposely delay the reduction of resources until it is clear the decline of activity is permanently (He et al., 2010).
Faced with this scenario, arise different studies in order to prove that costs are sticky, and identify the direction of change in the level of activity that interferes with this asymmetry. The forerunner study that addresses this understanding has been realized by Noreen and Soderstrom (1997). However, at that moment, the empirical study conducted by the authors did not find enough evidence to consolidate this knowledge. This finding was reached six years later, in the large US study by Anderson et al. (2003) which covered 7629 companies in longitudinal period, in which the authors found that sales costs, general and administrative increased on average 0.55% every 1% revenues increase and decrease only 0.35% when there is a decrease of 1% of revenue.
After this study, other studies have been conducted in order to test the sticky costs in different contexts. Subramaniam and Weidenmier (2003) found cost stickiness with a sample 9562 companies with information between 1979 and 2000 collected on the Compustat database. For this study, the authors collected information about Net Sales, Cost of Sales and Selling, General and Administrative of the studied companies. This information was called by the authors as total costs (COGS + SG&A), because they have a direct relationship with the volume of production. The findings reported by the authors revealed that the total costs increase 0.93% for every 1% growth in revenue, while decreasing only 0.85% for every 1% decrease in revenues, thus corroborating the theory that advocates the sticky costs. In addition, the authors pointed out that the level of asymmetry is also influenced by economic issues in which the company is inserted.
Looking verify the asymmetry of costs in healthcare, Balakrishnan, Petersen, and Soderstrom (2004) developed an empirical study with a total sample of 49 clinics. The results found also indicate that there is asymmetric costs, corroborating with sticky costs. In addition to identifying the sticky cost behavior, the authors attempted to relate these findings with specific characteristics of the studied companies. Thereby state that, in a company that has spare capacity, managers may be more likely to use the slack to absorb the demand if there is an increase in activity levels. As a result, companies that do not operate at full capacity tend to have lower costs of asymmetry compared with companies operating at the limit or close to this, since administrators can manage costs in the demand fluctuations through the idleness that the company has, reducing asymmetry.
In Brazil, the first study about the sticky costs that brought more notoriety has been developed by Medeiros et al. (2005), which used as a sample 198 publicly traded companies and worked with information for over 17 years, more precisely from 1986 to 2002 with data collected from Economática base. The variables used by the authors represent net sales and SG&A (selling, general and administrative) expenses corrected by the General Price Index produced by the Getúlio Vargas Foundation (GPI/FGV). The authors are based on the study by Anderson et al. (2003) to investigate such relationships. The term cost of sales, general and administrative is handled by the authors as selling, general and administrative.
The results of tests conducted to examine the fact that the costs increase with higher intensity when revenue is increased, than in the opposite direction of the lower revenue for periods of one year, suggest confirmation of sticky costs, since it was found increased costs of 0.549-1% increase in revenue against the decrease of the costs of 0.301-1% reduction in revenue. The authors also tested three other hypotheses in the same study. The results demonstrated that, unlike the findings of Anderson et al. (2003), cost stickiness in Brazilian companies does not behave equally with the aggregation of years per period (H2). Similarly, these companies have not found the lagged adjustment of costs in response to revenue reductions (H3). Only the partial reversal of asymmetry in subsequent periods has been proven (H4), which allowed the authors consider that the sticky costs are partly applicable in Brazil.
Calleja et al. (2006) tested the asymmetry of costs through a sample of four developed country companies, which are: Germany, USA, France and UK. The findings reported by the authors have identified in the consolidated results of companies from four countries, that, on average, every 1% increase in revenue the costs go up 0.97%, while having a reduction of 1% in revenue costs tend to reduce of 0.91%. As the difference between countries, the authors pointed out that the greater asymmetry in costs occurred in German and French companies, and these differences can be attributed to corporate governance systems and management oversight.
Aiming at understanding the cost stickiness, Banker, Ciftci, and Mashruwala (2008) sought to explore the optimism of managers in order to understand the effect of their management decisions on business costs. Considering changes in costs with SG&A (selling, general and administrative) and changes of sales to infer how managers acts and thus considering the historical signs (positive or negative) toward the revenue, GDP growth, among other factors, the authors found that the more optimistic the managers are as to future demands, higher they bet, which makes most striking asymmetry costs, having emphasis costs upwards of revenue and slowing the downward changes in revenue. These results provide evidence which show that variations in costs also tend to be asymmetrical in this case because the decisions of managers linked to optimism thereof.
Balakrishnan, Labro, and Soderstrom (2011) focus their studies in empirical tests of cost stickiness by making use of data collected from the Compustat base. As main finding, the authors report that managers makes decisions in order to maximize future benefits that usually occur in the long term. In contrast, the evidence found by the authors concluded that observed in the short term data tend to have asymmetric costs. Therefore, when observing the behavior of costs over longer periods, the observed asymmetry tends to reduce.
Another study that sought to identify factors that explain the asymmetry of the costs in companies has been developed by Banker, Byzalov, and Chen (2012), who worked with the premise that countries with more protective legislation to employees tend to provide a higher asymmetry costs, since when there is negative growth in the company's activity level, the dismissal of employees becomes more costly for the company, increasing the cost and therefore the asymmetry of it. In this context, to test that premise, the authors investigated these relationships in a sample of companies from 19 countries, with the period spanning between 1990 and 2008, in which it promoted a parallel between the asymmetry of costs analyzed, compared to the differences of the employee protection legislation in each country. The findings reported proved to be consistent with the premise, i.e. countries with stricter legislation on the protection of employees have the companies with stronger cost asymmetry.
Seeking to identify cost stickiness in publicly traded companies in Latin American countries, Costa, Marques, Santos, and Lima (2013) conducted their study with 669 companies from nine countries of that region, the period contemplated for the analysis included the years 1995 to 2012. The variables used are the selling, general and administrative and net sales, being that, the panel analysis showed mainly that, on average, by increasing the sales revenue by 1%, the cost of SG&A increases 0.56%, whereas when the sales revenue decreases 1%, these expenses reduce only 0.45%, which suggests an asymmetrical behavior of such expenses.
Recently, Richartz and Borgert (2014) observed the behavior of the costs of Brazilian companies listed on the Stock Exchange between 1994 and 2011. For the data analysis, use is made of statistical analysis, such as regression technique. The findings highlighted by the authors, in general, show that the Cost of Goods Sold (COGS) show strong downward trend in the period under review. Regarding sticky costs proposed by Anderson et al. (2003), the authors also found that there is a partial implementation of such concepts as, for varying degrees of revenue to 10% the sticky costs are ratified. However, when the variation exceeds 10%, the results are different.
Partially conflicting findings between the two studies developed in Brazil by Medeiros et al., 2005 and Richartz and Borgert (2014) compared to the findings reported in the study by Anderson et al. (2003) show that the asymmetric behavior costs can vary in different markets and periods, which stimulates new studies. The few comparative analyzes between the sticky cost behavior in companies from different countries contribute to the understanding of behavior patterns and factors that may explain the existence of asymmetry in costs between them.
With this in mind, a research opportunity that emerges from this evidence is related to the opportunity to investigate the behavior of costs in emerging countries companies, as in the case for this proposed research (Brazil, Chile and Mexico). In light of this evidence found in literature and considering the main focus of this study, with respect to sticky costs, which advocate the existence of asymmetry in the behavior of costs, elaborated the following research hypothesis:
H1. The behavior of costs in the largest publicly traded companies in Brazil, Chile and Mexico are asymmetrical and the increased costs through to the increase in net sales is higher when compared with the cost reduction due to a proportional reduction in revenue net sales.
Macroeconomic determinants of sticky costs
Considering that the proposed study investigates the theme of sticky costs in different countries, it is appropriate to evaluate the influence of macroeconomic determinants in these relationships. Overall, it was identified that there are three groups of researchers investigating the topic sticky costs, namely: (a) those establishing additional evidence of sticky costs through Anderson et al. (2003) study replication, in different contexts, expanding the literature with different approaches costs (such as COGS, SG&A, Salary costs, etc.); (b) those who attempt to identify the determinants of cost stickiness; and (c) investigating the consequences of cost stickiness (Malik, 2012).
Facing the still limited number of studies in the area, research that aims to evidence, identify the determinants and/or investigate the consequences of sticky cost behavior in different contexts has been, in all cases, very important to the evolution of existing knowledge on the subject. However, it is worth noting that currently, researchers have mostly promoted efforts to identify the determinants of sticky cost behavior.
In this context, according Sorros and Karagiorgos (2013), the differences in macroeconomic factors from one year to another, and especially different macroeconomic patterns between countries has been substantial to the understanding of behavior of costs. Therefore, factors such as inflation and GDP growth are relevant to understanding the differences in the behavior of costs that has been highlighted by researchers when comparing countries companies with rigid levels of various costs.
In this regard, Calleja et al. (2006) emphasizes the economic growth period that questions arise of how the managers of organizations will obtain internal and external sustainability through the flexibility inherent in the new features that arise when the economic ascent of a particular country.
Empirically, He et al. (2010) found cost stickiness in the Japanese context, using information between 1975 and 2000, which totaled 35,510 observations of active companies in 29 different industries. As found in general the cost of sales, general and administrative raised in average 0.593% when the revenue increase 1%, but fall just 0.454% as the decrease in revenues in the same proportion, accepting the sticky costs. When only analyzed the retail segment of goods, the results demonstrate that the increase/decrease in revenue of 1% on average costs go up 0.703%, while falls 0.701%, respectively, and economic growth (scaled by the growth variable GDP) is positively related to cost behavior (coefficient of 0.0496), such a fact proven statistically at 5% reliability.
The study by Abu-Serdaneh (2014) aimed to verify the behavior of Jordanian manufacturing companies in the segment costs. For this purpose, made use of information from years 2008 to 2012, being analyzed 62 companies listed on the Amman Stock Exchange. The findings, overall, do not support the recommendations by sticky costs, that costs increase proportionately more when the revenue increase by 1%, than falls when the decrease in revenues by 1%. In addition, it found that GDP growth has positive relationship with the behavior of the costs of the companies analyzed. Thereby with regard to economic growth, the author implies that their finding is in agreement with the literature, since Banker, Byzalov, and Plehn-Dujowich (2011) point out that the behavior of the costs will be more rigid in times of macroeconomic growth, because managers are more optimistic expectations and thus tend to maintain excess production capacity.
In this context, the face of such evidence and considering the proposed configuration for this study, for conducting this research it has been developed the following research hypothesis:
H1. There is relation between macroeconomic factors and behavior of costs in the largest publicly traded companies in Brazil, Chile and Mexico.
Method and procedures of research
To analyze the behavior of costs facing changes in the volume of net sales in major Brazilian companies, Chilean and Mexican, this research is defined as the objectives as descriptive. To Gil (2010) descriptive research aims to describe the characteristics of a certain population, it can also be performed in order to identify possible relationships between variables.
As the approach to the problem, it is characterized as quantitative research because it used statistical methods such as panel analysis. Quantitative research aims to evaluate the phenomenon or population through application of statistical techniques (Richardson, 1999). The survey also sets itself as documental analysis, because the data used to calculate the variables were obtained from the Thomson® database through financial statements of the largest Brazilian, Chilean and Mexican companies. As explained Martins and Theóphilo (2009), the document analysis use materials that have not been edited, such as, for example, the reports.
The research population consists of the set of Brazilian companies listed on the BM&FBovespa, Chilean listed on the Santiago Stock Exchange and Mexican listed on the Mexican Stock Exchange. To determine the sample of the survey, companies in the financial segment were excluded, because they have particular characteristics. Subsequently, it was selected the top 50 companies in each country taking into account whether they had at least six years information to calculate the variables needed in the study. To measure the size of the companies, was used based on the net revenues of the most recent sales period analyzed, i.e. 2013. Net sales revenue is consistently and historically mainly used to measure the size of the organizations, as it turns out for example, in studies of Trotman and Bradley (1981) and Belkaoui and Karpik (1989).
Initially it was determined the 50 largest companies of each of the three study countries, being Brazil, Chile and Mexico, respecting the assumptions described for defining the population and sample. This information was extracted from Thomson® database, and the period consists of 12 years, more precisely between 2002 and 2013. The cutoff point was made due to the reduction of the initial number of companies selected by size with the necessary information in recent years of the study period, and if there was continuity collection in previous years, the trend was to reduce further the number companies, which could considerably hamper the data analysis in the form proposed to this research.
In all three countries, the most recent six years of analysis there are a total of 50 companies. Subsequent to this, there is a gradual decrease, since not all companies have information for earlier periods. Therefore, have between 2008 and 2013 a sample of 50 companies in each country and, in 2002, the earliest period in analysis, has 33 Brazilian companies, 30 Chilean and 37 Mexican. In other years, i.e. from 2003 to 2007, the number of companies per country is between the minimum and maximum range of the first and last period.
The collected data were tabulated in spreadsheets in order to do the calculations. In the data analysis was initially performed a descriptive analysis, which is also represented through graphic, with the help of Microsoft Excel® software and specialized statistical SPSS version 21, in order to check the behavior of the average costs over the period study. In addition, the correlation analysis by Pearson was performed between the total costs of the companies surveyed and net sales also supported by the statistical software SPSS version 21.
As for sticky costs, the empirical model analysis to check the reaction of the costs by the change in net sales revenue is composed as follows:
 (1)
(1)
To better details of model, it is found that there are two main variables, which are the net sales revenue and total costs. In this context, it is emphasized that the nomenclature used in total cost includes the sum of the financial accounts Cost of Goods Sold - COGS and Selling, General and Administrative SG&A.
This model is adapted and based on the studies developed by Anderson et al. (2003), Subramaniam and Weidenmier (2003) and Richartz, Borgert, and Lunkes (2014). It is reported that the work of Subramaniam and Weidenmier (2003) is the main basis for the operationalization of the total costs as the sum of COGS to the selling, general and administrative, as this variable was also operationalized by these authors. Besides this international work, there are other research whose understanding of the variables is similar. In Brazil, for example, the study Richartz et al. (2014) also worked with the variable total costs, operationalizing it in similarly to this study, emphasizing further that financial expenses are not part of the set because total costs does not have a direct relationship with the volume of production and only with the capital structure of companies.
As for the model, the equations consider the change in rate for both the dependent variable “total costs” as the independent variable “net sales”, considering the numerator the period t and denominator the period t − 1. So it is possible to segregate positive and negative variations of revenue from period t to the period t − 1. In this context, for each country applies the equation with panel data twice, one containing data that showed an increase in net sales and another containing the data with the decreases in net sales of the t period to t − 1, that is, two different sets of data. Such a procedure adopted is similar to that used by Richartz et al. (2014) who applied the multiple linear regression analysis, reporting that the constant angle β coefficient of variation of NSR and by the error you can check the reflection in the total costs (TC) by variations in NSR.
The linear use in logarithm appearing in the model, according to Anderson et al. (2003) is important because of the huge variety of industries and major diversification in the size of companies, which provides improved comparability of variables collected, easing the intensification of potential cross heterocedasticity.
To acceptance of the hypothesis 1 of research, that costs are asymmetric and have an expected direction, it is believed that when the revenue increase occurs in 1% the costs increases proportionately more from when the revenue falls in 1%. With this, as will run the model twice by country, primarily for the positive growth of net sales (called “A”) and then to the negative growth of net sales (considered as “B”), the stickiness must present β_1 a> β_1 B.
In order to minimize the temporal distances concerning the collected quantitative data, they are adjusted by the inflation through official consumer price index - CPI of Brazil, Chile and Mexico, based on information extracted from the Banco Central do Brasil (BCB), Instituto Nacional de Estadísticas (INE) - Chile and Instituto Nacional de Estadísticas y Geografia (INEGI) - México. This procedure is performed on the basis of previous studies that also made use of inflation indices with similar objective as the work developed by Banker, Byzalov, Ciftci, and Mashruwala (2012) and Richartz and Borgert (2014).
Seen Eq. (1), is shown now Eq. (2), elaborates primarily based on studies of He et al. (2010) and Abu-Serdaneh (2014) which will be used to test the research hypothesis 2. In it, the data of the three countries studied are run jointly in order to check whether there is a relationship between macroeconomic factors and behavior of costs in the largest publicly traded companies in Brazil, Chile and Mexico.
 (2)
(2)
In Eq. (2) additionally has β_2, and β_3 β_4, as compared with Equation 1 addressed previously. On a consolidated explanation of this model have that the variable “dummy_decrease_NSRt ”, receives 1 in case the revenue t is less than t − 1 and 0 otherwise. The variable “inflationt ” corresponds to the percentage index CPI Brazil, Chile and Mexico, extracted from the websites of the BCB, INE and INEGI, respectively. Finally, the “GDP growtht ” is the percentage change in GDP of each of the three countries studied, all of which are derived from the World Bank website.
As Anderson et al. (2003) data analysis to test costs of the asymmetry will be performed by panel data. To Guajarati and Porter (2011), the panel data have several advantages, in short, can enrich the analysis applied to the point of being impossible to use only time series data or cross-section, i.e. in panel data there is a advantage of combining time series with cross-sections.
As explained by Fávero, Belfiore, Silva, and Chan (2009), the analysis panel has three common approaches: POLS - pooled ordinary least squares, fixed effects and random effects. In this context, in order to determine which one of the modeling should be used, it will be performed the tests Breusch-Pagan, Chow and Hausman, the last when required. For all procedures described here on the panel analysis, will be used the statistical software STATA (Data Analysis and Statistical Software) version 12. The results of the conducted study are highlighted below.
Analysis of results
The analysis of the research results is outlined in three steps in order to provide a better understanding of the findings. Thus, it initially presents the analysis of the behavior of costs, second analysis of the sticky costs, and finally, analysis of the macro-economic determinants of sticky costs.
Analysis of cost behavior
Initially presents the average ratio between the TC/NSR in this period. In addition, presents separately for purposes of analysis also the average of the relationship between COGS/NSR and SG&A/NSR. Note also the number of companies per country in each year analyzed, reiterating that the gradual decline over the years is due to the fact that not all of the largest companies in each country in 2013 provide information in all the previous years analyzed, and the number starts to decline from 2007 because until 2008 sought to the largest companies that had information for at least six periods, i.e. from 2008 to 2013. The results of this analysis are presented in Table 1.
Table 1 Average annual (2002-2013) of the TC/NSR indexes, COGS/NSR and SG&A/NSR by Country.
| Year | Brasil | Chile | Mexico | |||||||||
|---|---|---|---|---|---|---|---|---|---|---|---|---|
| N. | TC/NSR | COGS/NSR | SG&A/RLV | N. | TC/NSR | COGS/NSR | SG&A/NSR | N. | TC/NSR | COGS/NSR | SG&A/NSR | |
| 2002 | 33 | 0.713 | 0.543 | 0.169 | 30 | 0.786 | 0.617 | 0.169 | 37 | 0.795 | 0.583 | 0.212 |
| 2003 | 38 | 0.719 | 0.556 | 0.163 | 34 | 0.818 | 0.673 | 0.145 | 38 | 0.809 | 0.600 | 0.208 |
| 2004 | 40 | 0.703 | 0.555 | 0.148 | 35 | 0.843 | 0.688 | 0.155 | 39 | 0.785 | 0.579 | 0.206 |
| 2005 | 50 | 0.745 | 0.616 | 0.129 | 38 | 0.824 | 0.680 | 0.144 | 41 | 0.779 | 0.567 | 0.212 |
| 2006 | 50 | 0.746 | 0.623 | 0.123 | 41 | 0.820 | 0.683 | 0.137 | 44 | 0.774 | 0.558 | 0.216 |
| 2007 | 50 | 0.746 | 0.600 | 0.146 | 43 | 0.830 | 0.695 | 0.135 | 46 | 0.769 | 0.560 | 0.209 |
| 2008 | 50 | 0.753 | 0.610 | 0.144 | 50 | 0.844 | 0.708 | 0.136 | 50 | 0.782 | 0.584 | 0.198 |
| 2009 | 50 | 0.777 | 0.635 | 0.143 | 50 | 0.845 | 0.692 | 0.152 | 50 | 0.783 | 0.585 | 0.198 |
| 2010 | 50 | 0.764 | 0.627 | 0.137 | 50 | 0.818 | 0.688 | 0.130 | 50 | 0.782 | 0.586 | 0.196 |
| 2011 | 50 | 0.778 | 0.637 | 0.141 | 50 | 0.875 | 0.748 | 0.127 | 50 | 0.784 | 0.595 | 0.189 |
| 2012 | 50 | 0.808 | 0.667 | 0.141 | 50 | 0.853 | 0.723 | 0.130 | 50 | 0.779 | 0.597 | 0.182 |
| 2013 | 50 | 0.789 | 0.647 | 0.142 | 50 | 0.841 | 0.703 | 0.138 | 50 | 0.774 | 0.584 | 0.190 |
| General average | 0.753 | 0.610 | 0.144 | 0.833 | 0.691 | 0.142 | 0.783 | 0.582 | 0.201 | |||
| SD general | 0.154 | 0.177 | 0.119 | 0.134 | 0.158 | 0.088 | 0.151 | 0.169 | 0.119 | |||
| CV general | 0.206 | 0.292 | 0.702 | 0.161 | 0.229 | 0.620 | 0.193 | 0.290 | 0.593 | |||
Legend: TC, total costs; COGS, cost of goods sold; SG&A, selling, general and administrative; NSR, net sales revenue.
Source: Research data.
By the data presented in Table 1, it is found that on average 12 years observed in the study, the Brazilian companies use the lowest percentage of net sales to cover the total costs, which is 75.3%, followed by Mexican companies with a mean percentage change of 78.3% and Chilean with 83.3%.
When analyzed separately the average data of relations of the cost of goods sold (COGS) and Selling, general and administrative (SG&A), both compared to the net sales, it is clear that Chilean companies have the highest average COGS and the lowest average SG&A for the period, while the Mexican companies have the lowest average COGS and the highest average SG&A. In the investigated sample, the Brazilian companies have both COGS and SG&A for the middle ground compared to companies from other countries.
The analysis of factors that may explain these differences stimulates new studies. Although is not possible to assess the influence of these relationships, some obvious issues in the economic context of these countries may have influenced these results. Differences in the recognition criteria of cost of goods sold and selling, general and administrative by changes in accounting principles accepted in each country may have influenced such relationships. In this regard, it is noted that recently these countries have adopted the international accounting standards. Another factor that can influence these relationships may be related to differences in the largest companies business segments in each country because this study does not distinguish by segment. In this sense, market characteristics that affect the ratio of cost of sales and selling, general and administrative of the companies in relation to net sales, can also influence these results.
Given the findings in this research, it is also important to analyze the trend of the relationship between total costs with the net sales of the companies studied, as this procedure allows a better comparison of data over the studied years. The results of this analysis are presented in Fig. 1.
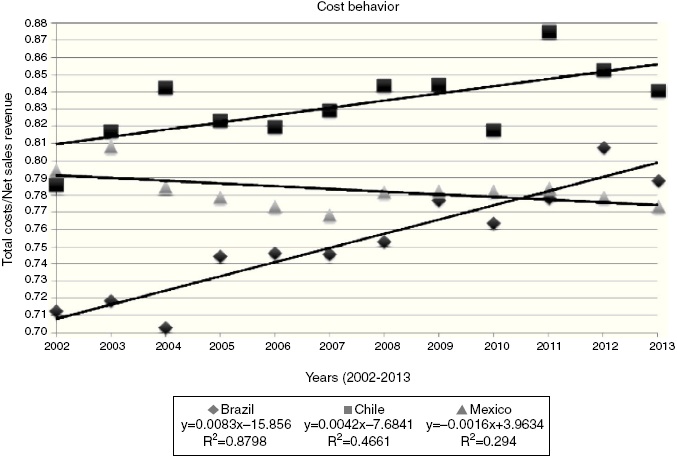
As can be seen in Fig. 1, it is clear that despite the Brazilian companies have shown the best TC/NSR average in two periods, in the past two years, i.e. 2012 and 2013 these had a higher index than Mexican companies. Moreover, the trend line shows over time that such a relationship has been growing in Brazilian companies, which provides decreased operating profit margin of the companies. The trend observed in Brazil has the largest inclination among the countries under analysis, tightening the TC/NSR faster over the years, which in this case is a negative factor because of the rise of the trend line, which still showed high r 2 of 0.8798, strengthening the explanatory power of this relationship, which provides strength analysis of this trend.
As the Chilean companies, note that compared the Brazilian and Mexican companies, only in 2002 was lower TC/NSR than companies of at least one of the other two countries in the sample, in this case, less than Mexican companies. Thus, between 2003 and 2013 the Chilean Companies always had higher TC/NSR, which refers to the fact that the largest Chilean companies work with lower operating profit margin. As the trend line, noted, as well as Brazilian companies, growth of the relationship, however, lower pitch of Chilean companies compared to Brazilian companies. This trend showed moderate r2 of 0.4661.
Finally, it appears that in Mexican companies investigated in the study, different from that observed in Brazilian and Chilean companies, TC/NSR relationship is aiming for a reduction, which tends to provide greater operating profit margin for these companies over the coming years. So it turns out that the Mexican companies are presenting evolution of operational efficiency. Even with the lowest coefficient of determination for the analysis of such relationships (r2 of 0.294), the results indicate the evolutionary analysis of this relationship in Mexican companies.
Additionally, in order to verify the extent of association between the main variables of the study, total costs (TC) and Net Sales (NSR), proceeded to analyze the correlations between such relationships. The results are shown in Table 2, using the Pearson correlation analysis between TC and NSR.
Table 2 Pearson correlation between total costs and net sales by country.
| Brasil Net sales (NSR) |
Chile Net sales (NSR) |
Mexico Net sales (NSR) |
|
|---|---|---|---|
| Total costs (TC) | 0.983* | 0.996* | 0.983* |
Source: Research data.
* The correlation is significant at 1%.
The results presented in Table 2 demonstrate the existence of significance at the 1% level of correlation between TC and NSR with high association and positive sign, as expected, because the net sales revenue affects the total cost. However, it is worth noting that the correlation only infers the association between variables, not necessarily suggesting a relationship of cause and effect.
Analysis of sticky costs
In front of the parameters defined in the methodology for analysis of sticky costs, it presents initially results of applied models by country. Table 3 shows the results for the data on which the net operating revenues increased considering the period t to t − 1.
Table 3 Asymmetry analysis: model for a 1% increase in NSR.
| Variables | Brazilian companies | Chilean companies | Mexican companies | ||||||
|---|---|---|---|---|---|---|---|---|---|
| POLS (A) | POLS (A) | POLS (A) | |||||||
| Coefic. | Test t | Sig. | Coefic. | Test t | Sig. | Coefic. | Test t | Sig. | |
| β 1 - NSR | 1036 | 42.40 | 0.000* | 0.905 | 47.97 | 0.000* | 0.973 | 27.94 | 0.000* |
| _CONS - TC | −0.005 | −1.11 | 0.266 | 0.009 | 2.44 | 0.015* | −0.0001 | −0.04 | 0.967 |
| R 2 within | - | - | - | ||||||
| R 2 between | 0.8335 | 0.8654 | 0.6978 | ||||||
| R 2 overall | - | - | - | ||||||
| Model of Sig. | 0.0000* | 0.0000* | 0.0000* | ||||||
| Observation # | 361 | 360 | 340 | ||||||
| LM Breusch-Pagan | 1.0000 | 1.0000 | 1.0000 | ||||||
| F Chow | 1.0000 | 0.9738 | 0.9999 | ||||||
| Hausman Test | - | - | - | ||||||
Legend: TC, total costs; NSR, net sales revenue.
Source: Research data.
* Significance at 1%.
The panel modeling used was POLS, once the Breusch-Pagan test and Chow test were not significant at the 5% level. Thus, the regression model was applied presenting significance at 1% in all three countries and the explanatory power of the models reached R 2 83.35% in Brazil, 86.54% in Chile and 69.78% in Mexico. The results presented in Table 3 show through NSR independent variable that each 1% increase in the total costs increase NSR 1.036% to Brazilian companies, 0.905% to Chilean companies and 0.973% Mexican companies.
Presented the results, the net sales (NSR) experienced positive growth (Table 3), Table 4 shows the results obtained by data analyzing that the NSR reduced considering the t period for period t − 1.
Table 4 Asymmetry analysis: model for reduction of 1% of NSR.
| Variables | Brasilian companies | Chilen companies | Mexican companies | ||||||
|---|---|---|---|---|---|---|---|---|---|
| POLS (B) | POLS (B) | Fixed effects (B) | |||||||
| Coefic. | Test t | Sig. | Coefic. | Test t | Sig. | Coefic. | Test t | Sig. | |
| β 1 - NSR | 0.963 | 24.82 | 0.000* | 0.698 | 8.91 | 0.000* | 0.857 | 15.66 | 0.000* |
| _CONS - TC | 0.005 | 1.31 | 0.190 | −0.008 | −1.39 | 0.166 | −0.007 | −1.83 | 0.069* |
| R 2 Within | - | - | 0.6128 | ||||||
| R 2 Between | 0.7568 | 0.3330 | - | ||||||
| R 2 Overall | - | - | - | ||||||
| Model of Sig. | 0.0000* | 0.0000* | 0.0000* | ||||||
| Observation # | 200 | 161 | 205 | ||||||
| LM Breusch-Pagan | 0.1697 | 1.0000 | 0.4361 | ||||||
| F Chow | 0.1821 | 0.9993 | 0.0001* | ||||||
| Hausman Test | - | - | - | ||||||
Legend: TC, total costs; NSR, net sales revenue.
Source: Research data.
* Significance at 1%.
As can be seen in Table 4, to analyze the reductions in NSR, the modeling panel used for Brazil and Chile was the POLS because of the Breusch-Pagan test and the Chow test are not significant at 5%. In Mexico the modeling used was fixed effects, since the Breusch-Pagan test was not significant at the 5% level, but the Chow test showed such a level of significance, which defines the model of using fixed effects.
In this context, was applied the appropriate models for each of the three countries, all presenting significance at 1% and the explanatory power determined is checked through R 2, which is of 75.68% for Brazilian companies, 33.30% for Chilean companies and 61.28% for Mexican companies. The NSR independent variable proved to be significant in three models, allowing the analysis that every 1% reduction in NSR the total costs falls by 0.963% in Brazilian companies, 0.698% in Chilean companies and 0.857% in Mexican companies.
Can observe also from the results shown in Tables 3 and 4, the total number of observations per country are respectively 561 in Brazil, 521 in Chile and 545 in Mexico. In this context, it appears that in Brazil NSR increased in t period compared to t − 1 at 360 observations, representing 64.17% of all observations. In Chile, 361 cases show such variation, representing 69.29% of the observations made in this country. Now in Mexico in 340 cases the NSR increased during this period (62.39%).
Relative to the total of observations carried in the research, even though the companies in Chile present percentage more often positive change in net sales revenue from one period to the next, followed by positive growth achieved by companies in Brazil and then Mexico, it is clear that the number of cases in the three countries are very close, and on average, overall, approximately two thirds (2/3) of observations carried indicate that net sales suffered increase of one year to another, whereas in only one third (1/3) of the cases occurred a negative variation. Is worth mentioning that, to make it possible to promote a better comparative analysis between the information analyzed with companies from different countries, the data used were adjusted by the inflation rate, if the consumer price index - CPI as indicator available each country, which softens the temporal distances that can influence such analysis, logic also used by Banker et al. (2012a,b) for the realization of their study.
Table 5 shows the summary of findings regarding the behavior of the total costs (TC), comparing the 1% increase of net sales and decreases by 1%, results achieved with statistical significance at the 1% level in all cases observed in Brazil, Chile and Mexico.
Table 5 Summary analysis of asymmetry by country.
| Cause and effect | Brazil | Chile | México |
|---|---|---|---|
| NSR increases 1%, CT increases | 1.036% | 0.905% | 0.973% |
| NSR decreases 1%, CT decreases | 0.963% | 0.698% | 0.857% |
| Asymmetry | 0.073% | 0.207% | 0.116% |
Legend: TC, total costs; NSR, net sales revenue.
Data: Search Fountain.
It is observed in Table 5 that, in the analyzed period of 12 years, corresponding to the years 2002 through 2013, there is asymmetry in costs for larger Brazilian, Chilean and Mexican companies, once the revenue increases by 1%, the total costs increase in different ratios than they decrease when reduction occurs in 1% of revenues. This fact reveals that the traditional model view of cost behavior not really reflect the reality of the same, since in such a model, it is assumed that the costs change proportionally through changes in the volume of activity, regardless of whether these changes be reduced or increased level of activity.
So it can be seen that there is in this case evidence to corroborate the theoretical approach of sticky costs, suggesting that the largest publicly traded companies in Brazil, Chile and Mexico in the period 2002-2013, the behavior of costs was asymmetrical. The results found in this study converge with the findings of previous studies conducted in other contexts under this theoretical perspective research, supporting the theory of sticky costs proposed by Noreen and Soderstrom (1997) and Anderson et al. (2003). However, it is essential to note that compared to study by Richartz and Borgert (2014) in the Brazilian context, our findings converge partly because the authors (2014) accepted in divided doses addressing the sticky costs by analyzing companies listed by business sector of Brazil's economy.
In Brazil, the largest companies have total costs of 0.073% higher than when the net sales increased by 1%, than when it decreases by 1%. In turn, Chile and Mexico, the results indicate in both cases that the total costs are also proportionately greater the increase in net sales revenue than in the reduction of the same, with this variation, respectively 0.207% and 0.116%. These findings thus corroborate the sticky costs with respect to variations in revenue in one year. Therefore, the hypothesis 1 prepared for this research, it is understood that this can be confirmed regarding the major companies operating in the three emerging markets analyzed in the study.
As for the comparison of results found in the three countries, it is clear that when the increase in net sales by 1%, Brazil is the country with the highest increase in costs from year to year, being 1.036%, against 0.973% from Mexico and 0.905% from Chile. It appears in this case that in the following period, on average, when there is revenue increase of the largest Brazilian companies, the cost in the short term of a year tends to increase at higher levels than the revenue itself.
These results can be explained according to Balakrishnan et al. (2004), by the fact that certain companies operating at maximum capacity are impacted at some point by the significant increase in the volume of activities, needing to cover the new demand make new investments, unlike companies that have idle capacity, which can often use this time off to cover increased demand needs, not requiring, in this case investments. Such evidence suggests, therefore, that when there is an elevation of NSR by increasing the activity level in companies that are operating at full capacity, this increase in revenue, if not significant, is not enough to cover investments, making the costs increases more than the net sales, mainly in the short term, as noted.
Besides, in relation to the behavior of costs in Brazilian companies listed on the BM&FBovespa, the results found in the study by Richartz and Borgert (2014) suggested that organizations from different sectors tend to have different asymmetry in the behavior of costs, results also identified in other studies internationally (Subramaniam & Weidenmier, 2003). In this regard, one can infer from this evidence that the cost asymmetry level may change due to market sector companies, which may point to a larger or smaller variation in certain companies. Such findings open new perspectives for future studies.
It is also possible as well seen from the results found, that the countries that had a higher increase in costs when the addition of 1% of revenue, are sequentially Brazil, Mexico and Chile, they are also in the same order when the cost reduction before a decrease of 1% of net sales. Therefore, Brazilian companies can reduce further their costs (in this case, in 0.963%) than Mexican companies (0.857%) and Chilean (0.698%) when the net sales reduces 1%. It appears so in the larger Brazilian companies costs are less rigid compared to the costs of Mexican companies and Chilean companies.
Analysis of the macroeconomic determinants of sticky costs
Prior to presentation of the analysis of macroeconomic determinants of sticky costs, it is necessary to demonstrate the descriptive information of inflation and GDP growth of the countries, and these data will be later used as variables that will make up the model to determine the behavior of costs. Table 6 shows the results of this analysis.
Table 6 Macroeconomic indicators (2002-2013) by country.
| Year | Brazil | Chile | Mexico | |||
|---|---|---|---|---|---|---|
| Inflation (%) |
GDP growth (%) |
Inflation (%) |
GDP growth (%) |
Inflation (%) |
GDP growth (%) |
|
| 2002 | 12.53% | 3.10% | 2.82% | 2.20% | 5.70% | 0.10% |
| 2003 | 9.30% | 1.20% | 1.07% | 4.00% | 3.98% | 1.40% |
| 2004 | 7.60% | 5.70% | 2.43% | 6.00% | 5.19% | 4.30% |
| 2005 | 5.69% | 3.10% | 3.66% | 5.60% | 3.33% | 3.00% |
| 2006 | 3.14% | 4.00% | 2.57% | 4.40% | 4.05% | 5.00% |
| 2007 | 4.46% | 6.00% | 7.82% | 5.20% | 3.76% | 3.10% |
| 2008 | 5.90% | 5.00% | 7.09% | 3.30% | 6.53% | 1.40% |
| 2009 | 4.31% | −0.20% | −1.40% | −1.00% | 3.57% | −4.70% |
| 2010 | 5.91% | 7.60% | 2.98% | 5.80% | 4.40% | 5.10% |
| 2011 | 6.50% | 3.90% | 4.44% | 5.80% | 3.82% | 4.00% |
| 2012 | 5.84% | 1.80% | 1.48% | 5.50% | 3.57% | 4.00% |
| 2013 | 5.91% | 2.70% | 3.03% | 4.20% | 3.97% | 1.40% |
| General Average | 6.42% | 3.66% | 3.17% | 4.25% | 4.32% | 2.34% |
| SD General | 2.48% | 2.20% | 2.49% | 2.02% | 0.98% | 2.74% |
Legend: SD, standard deviation.
Source: World Bank (2015).
As shown in Table 6, it appears that the studied emerging countries have at times periods of economic recession, either in higher or smaller scale. In Mexico, for example, a country that had the lowest average growth in the period, Benachenhou (2013) points out that from 1992 to 2002, after the new economic policy of integration to the US set, the country's performance evolved positively over the period. However, since the beginning of the present century, under the new globalization, the Mexican growth is quite unstable.
The author points out that Brazil and Chile have shown better performances nowadays compared to Mexico. However, they were also affected by the global crisis, but the resumption of growth was faster because the diversifying their exports on products and markets, especially in the Brazilian case (Benachenhou, 2013).
About inflation, it is noted that Brazil is the country with the highest average, and when analyzing the year 2002 alone, there has been an increase in the price level of 12.53%, the highest in the study period. According to Luque and Vasconcellos (2002), the stage of economic development of a country has association with the occurrence of the phenomenon of inflation. The authors note that developing countries seeking to reach higher stages of economic development (defined as emerging nations, in this case) tend to have elevations in the general level of prices, especially when compared to countries with sound economies.
Based on the above, it is inferred that the GDP inflation and growth factors have great importance in the economy of the countries, directly affecting organizations, especially in emerging countries with favorable characteristics for macroeconomic instability, when analyzing longitudinal periods. Table 7 shows the behavior of consolidated costs of the three analytical focus countries, taking into account the variables inflation and GDP growth, macroeconomic factors as objects of study.
Table 7 Asymmetry analysis: consolidated model considering macroeconomic factors.
| Variables | Companies in Brazil, Chile and Mexico | ||
|---|---|---|---|
| Coefic. | Test t | Sig | |
| β 1 - NSR | 0.958 | 80.84 | 0.000* |
| β 1 - DD_NSR | −0.091 | −2.23 | 0.026** |
| β 1 - Inflation | −0.163 | −2.21 | 0.027** |
| β 1 - GDP growth | 0.106 | 1.14 | 0.256 |
| _CONS - TC | 0.003 | 1.60 | 0.111 |
| R 2 within | - | ||
| R 2 between | 0.8636 | ||
| R 2 overall | - | ||
| Model of Sig. | 0.0000* | ||
| Observations # | 1.627 | ||
| LM Breusch-Pagan | 1.0000 | ||
| F Chow | 1.0000 | ||
| Hausman test | - | ||
Legend: DD NSR, dummy decrease net sales revenue.
Source: Research data.
* Significance level 1%.
** Significance at 5%.
As can be seen in the results presented in Table 7, the costs have asymmetric behavior in the consolidated analysis of countries, confirming the individual findings for Brazil, Chile and Mexico. More specifically, it appears that in general, every 1% increase in revenue, costs go up 0.958%, while reducing 0.867% when the drop in revenues as well by 1%.
Inflation variable, in turn, is negatively related to the behavior of costs, being significant at level of 5%. Thus, one can determine that this has the capacity to explain the differences in behavior taking into account the time and cost countries analysis. This result corroborates the assertion by Sorros and Karagiorgos (2013), which highlight the diversity of macroeconomic aspects over time and between nations has been of crucial importance to the understanding of cost behavior. Thus, the variable inflation can be considered a decisive effect on the behavior of macro-economic costs of these countries.
As for GDP growth, it notes that this is positively related to the behavior of costs. However, this variable does not have statistical significance, thus requiring better explanation to enable concrete inferences. It should be noted that although not significant, the coefficient has a positive sign, similar to the statistically significant findings in He et al. (2010) studies in the Japanese context and Abu-Serdaneh (2014) in the Jordanian context. These results suggest that in the countries analyzed, considering the macroeconomic effects studied in this period, economic growth influenced differently the companies surveyed.
Therefore, the hypothesis 2 elaborated for this research, based on the two tested macroeconomic variables, it is understood that this can be accepted, because the macroeconomic aspects proved to be important in determining the differences in business costs behavior in Brazil, Chile and Mexico studied in the 2002-2013 period.
Conclusions and recommendations
This study evaluated, based on the data of the 50 largest publicly traded companies in Brazil, Chile and Mexico, listed respectively on the BM&FBovespa, the Santiago Stock Exchange and Mexican Stock Exchange, the 12-year period (2002-2013), the behavior of costs emphasis on analysis of sticky costs. In this context, with respect to the behavior of costs, it was found that over the 12 years studied, on average, Brazilian companies have the lowest percentage ratio of Total Costs and Net Revenue (CT/NSR). It was found that 75.3% of net sales revenue is used by Brazilian companies to cover the full costs. In Mexican companies the percentage found in such ratio is 78.3%, and 83.3% of Chilean companies.
Considering the results seen in more recent periods (2012 and 2013), it is noted that Mexican companies reported ratio of TC/NSR lower than Brazilian companies. Over the 12 years of study, the trend line observed in the study shows that CT/NSR list of Brazilian companies pointed to the growth, with sharp upward trend and R2 high of 87.98%, which indicates high explanatory power to the growth trend of this relationship. In contrast, Mexican companies showed over time a downward trend, despite having low downward slope (R2 of 29.4%).
Regarding the Chilean companies, it was found that these have mostly over the period investigated a greater relationship between CT/NSR, i.e. the largest Chilean companies tend to operate on average with the lowest operating profit margin compared to Brazilian and Mexican companies. During this period, that relationship shows an upward tendency (R2 of 46.61%), which has provided further narrowing of the TC/NSR in Chilean companies. Given the above, it appears that only the Mexican companies present evolution in operational efficiency, while in Brazilian and Chilean companies operating efficiency is reducing over the years studied.
As regards the analysis of sticky costs, the results showed that for the largest companies in Brazil, Chile and Mexico costs have asymmetric behavior, and in this asymmetry the increase in total costs by increase of net sales by 1%is superior compared to lower total cost of reduced net sales by 1%, which confirmed the hypothesis tested in this study in all three countries surveyed, corroborating the findings of Noreen and Soderstrom (1997) and Anderson et al. (2003) regarding the theoretical approach of sticky costs.
It was found during this period that in Brazil the costs amount to an average of 1.036-1% increase in net sales, versus reduction of 0.963% when the reduction in net sales was as well of 1%, resulting in an asymmetry of 0.073%. In Chilean companies, the asymmetry is higher (0.207%). In this case, when changes in the net sales revenue are positive or negative of 1%, respectively, costs go up at 0.905% and fall in 0.698%. Finally, the Mexican companies, on average, the costs rise in 0.973% when the increase in revenues of 1% and reduce to 0.857% when the revenue decline of 1%, presenting therefore asymmetric 0.116%.
Faced with such evidence, it becomes possible to accept the hypothesis 1 developed for this research, which indicates that the behavior of costs in the largest publicly traded companies in Brazil, Chile and Mexico are asymmetrical and rising costs by the revenue increase net sales is higher when compared with the cost reduction due to a proportional reduction in net sales. These results converge with findings from previous studies, such as Anderson et al. (2003), Subramaniam and Weidenmier (2003) and Calleja et al. (2006), being that these last ones also analyzed a number of companies of different countries such as Germany, USA, France and UK.
Analyzing the effects of macroeconomic variables (inflation and GDP growth) and the behavior of costs, it was found initially that the costs behave asymmetrically, consolidating the results of individual countries. Inflation has negative relationship with the behavior of costs, while the GDP growth influences positively the same, being the first significant finding at 5%, which did not occur in the second case. From these results, it can infer that macroeconomic factors are essential to explain differences in behavior of the costs of companies located in different countries, making it possible to accept the second research hypothesis. These results are convergent to highlighted affirmative by Sorros and Karagiorgos (2013) to explain the macroeconomic effects in the economy. Likewise, findings converge to the empirical investigations carried out by He et al. (2010) and Abu-Serdaneh (2014) in the Asian setting.
The findings provide a basis for further studies. This research has the differential the use of Cost of Goods Sold (COGS) as well contemplating the sum of Selling, General and Administrative SG&A for the formation of the variable total costs, and the use of macroeconomic variables as determinants of sticky costs. The findings provide evidence that contribute to the understanding of existing knowledge about the cost behavior and stickiness in a context not yet investigated in the configuration proposed in this study. Besides, emerging countries represent an important research context. The representation that companies have in the economy of their respective countries can be evidenced by the sum total of its revenues. The 50 Brazilian companies studied, only in 2013, had a total turnover close to US$505 billion, while the Chilean revenues of US$148 billion and the Mexican US$246 billion, which indicates that these are responsible for high generate wealth for their country.
In this regard, it is opportune to make further studies of companies operating in different countries, such as the emerging studied here, especially considering macroeconomic factors, so one can understand similarities and differences between the sticky cost behavior in these markets. Additionally, it was found from the review of the elaborate literature for this research that other factors may influence the behavior of costs, such as the contracts signed by the companies, the decision of managers in keeping the cost structure, differences attributed to corporate governance systems and management oversight (Calleja et al., 2006); specific characteristics of the companies such as the utilization level (limit) of installed operating capacity (Balakrishnan et al., 2004); the optimism of managers (Banker et al., 2008); the long-term decisions (Balakrishnan et al., 2011); as well as the interference of the country's legislation on protection of employees (Banker et al., 2012a,b). Therefore, from the realization of new longitudinal studies with a larger number of companies, it becomes possible to use other variables, to evaluate its influence among such relationships not yet investigated environments.
In addition, as suggestions for future work, it is recommended to check the behavior of costs and sticky costs using the concept of total costs, which corresponds to the sum of cost of goods sold and selling, general and administrative in other countries in Latin America that have economic similarities as well as the emerging used in this study, or, considering the formation of economic blocs. Studies with samples with larger companies provide evidence of behavior and cost stickiness considering an important sample of given context, however, the analysis of a larger set of information, like all public companies in each country, allows the inference observations more robust, given this context. The use of smaller samples may prevent the longitudinal studies, as observed in this study, by reducing the number of companies each receded period. Similarly, enough to stratify samples by economic sectors, regarding the analysis of sticky costs, which can also contribute to a better understanding of asymmetry by activity and country.

