


 nova página do texto(beta)
 Inglês (pdf)
 Artigo em XML
 Referências do artigo
 Enviar este artigo por email
 Citado por SciELO
  Similares em
SciELO
Similares em
SciELO 
 Permalink
JEL classification: E22; M21
Introduction
Budgeting has been considered one of the main management tools to guide organizations, measure their performance and motivate people. In addition, it serves as an imperative tool in the stages of planning, execution and control. One of the stages of the budgeting process includes preparation and analysis of capital budgeting, which is the focus of this study.
For Koch, Mayper and Wilner (2009) and Bennouna, Meredith and Marchant (2010), the decisions inherent to capital budgeting are fundamental to the survival and success of the company in the long run. In view of this, the decisions of the investment budget are conceptualized as a difficult type (Carmona, Iyer & Reckers, 2011). The complexity is justified because capital expenditures require significant resources. In addition, companies should determine the best way to get and return these resources. And yet, most of the capital budgeting decisions require a long-term commitment (Chan, 2004; Olawale, Olumuyiwa & George, 2010).
The relevance of the capital budgeting process for the company lies in the fact that a significant amount of money is committed for a long period. This implies that, after the decision to start a project has been made, its reversal would probably culminate in partial or total loss of the amount invested (Hall & Millard, 2010).
In addition, long-term decisions require an assessment of the value of money over time, and a behavior analysis and relevance of costs. In this context, capital budgeting practices are tools that assist managers in making long-term decisions. Such practices that make up the budget are commonly divided into: investment analysis, discount rate setting and risk analysis.
Additionally, Kalhoefer (2010) states that the discussion about the best set of practices to be used in capital budgeting has been extensive and dull. That is because the existence of a single and comprehensive method to be used is questioned.
It turns out that, in fact, the decision maker must often choose among various practices, based on numerous criteria, not always having a dominant option. The manager must not only assess each option and discretion. They must also distinguish the importance related to each option and discretion to make the final assessment (Carmona, Iyer & Reckers, 2011).
The existence of various practices available for analysis of the investment budget has prompted researchers to check which are the most adopted by organizations in the analysis of this budget step. Studies on the subject have had so much simpler goals to identify which practice is used - the more detailed the best -, seeking to explain what discount rates are used, how the cash flows are measured and also which factors are important in capital budgeting decision.
Capital budgeting practices are generally classified in the literature as: investment analysis, discount rate setting and risk analysis. The more sophisticated practices for analysis of investments are the ones of discounted cash flows and comprise Net Present Value (NPV), Internal Rate of Return (IRR), the Modified Internal Rate of Return (MIRR) and Profitability Index (PI). In turn, traditional practices include the Payback Period (PP) and the Accounting Rate of Return (ARR).
Regarding the definition of the discount rate, the Weighted Average Cost of Capital (WACC) stands as the most suitable practice to use, compared to the Cost of Capital (CC) and the Debt Cost (DC). With regard to risk analysis, the simplest practices comprise setting discount rates. As for the most sophisticated ones, they include sensitivity analysis, scenario analysis, decision tree, Monte Carlo simulation.
Despite the existence of sophisticated practices, many companies still rely on the simplest ones (Brealey & Myers, 2005; Hermes, Smid & Yao, 2007; Peel & Bridge, 1998, 1999; Ross, Westerfield & Jaffe, 2004). It is believed that the justification for the use of traditional practices is attributable to some factors, which are: (i) ease of calculation (Pike, 1996); (ii) lack of financial resources and limited use of computer technology (Hall & Millard, 2010; Ryan & Ryan, 2002); (iii) lack of sophistication from the management (Graham & Harvey, 2001); and (iv) a demand for a lot of human resources (Lam, Wang & Lam, 2007).
From this context, the following research question guides this work: how does the use of capital budgeting practices by large Brazilian companies take place? In order to answer the question-problem, this paper presents a general objective, which is: to analyze the use of capital budgeting practices by large Brazilian companies.
Due to the existence of more elaborate practices than others, researchers conducted several studies to see which ones are being used in relation to the size of the company, as well as longitudinal studies to identify if there is a change in the choice of managers over the years.
Note the lack of studies linked to the capital budgeting practices used by Brazilian companies, deserving a thorough assault on the topic.
Therefore, this study is justified by the theoretical, scientific and academic contribution, to obtain inputs from leaders of Brazilian companies listed, information and features on the adoption of the budgeting practices used in the investment budget assessment.
This work also contributes in the business and economic sector, by enabling the identification of the current situation of the surveyed companies, compared to other countries and the disclosure in which aspects you can improve.
The relevance of the research is the importance of making an allocation based way of resources and planned, given that the decisions made during the capital budget, among other factors, determine the growth and future productivity of the company (Olawale et al., 2010).
Theoretical review - capital budgeting
Capital budgeting is the process of investment opportunities analysis in long-term assets, which are expected to produce benefits for more than a year (Peterson & Fabozzi, 2002).
Thus, one sees that a way of avoiding the execution of compromising investments is to use practices that reduce future risks and errors. To conceptualize such tools, this literature review presents the main capital budgeting practices identified in the literature, previous studies examining its adoption and theoretical assumptions of the research.
Practices for investment analysis
The decision to make an equity investment makes up a process which comprises the analysis and assessment of the various alternatives that meet the company's specifications. After the verification of viable alternatives, there will be an examination of which investment analysis methodologies will be employed.
For Souza and Clemente (2008), practices for investment analysis can be divided into two major groups: (i) for screening; and (ii) to select projects.
In the first category are the so-called classification or cutting methods such as, for example, the Payback Period (PP) and the Accounting Rate of Return (ARR). In the second category are the so- called robust methods, which take into account the time value of money, namely: Net Present Value (NPV), Internal Rate of Return (IRR), the Modified Internal Rate of Return (MIRR) and Profitability Index (PI) (Brigham & Ehrhardt, 2002).
NPV is the most known and used robust technique of investment analysis (Bennouna et al., 2010; Correia & Cramer, 2008; Hermes and Smid; Maquieira, Preve & Sarria-Allende, 2012; Souza & Clemente, 2008; Truong, Partington & Peat, 2008; Viviers & Cohen, 2011; Hermes, Smid & Yao, 2007). NPV, as its name suggests, is the concentration of all the values expected from a cash flow on date zero.
IRR differs from the NPV method because it determines the potential return on investment. IRR is the rate that will make the present value of the proposed capital expenditure equal to the present value of cash inflows (Gitman, 2010; Jackson & Sawyers, 2008).
A proposal to simultaneously eliminate the problem of reinvestment assumption by IRR and the problem of having multiple IRRs is the methodology of the modified IRR (MIRR) (Brom & Balian, 2007).
MIRR is the discount rate that makes the investment equal to the future value of the investment cash flows, resulting in an NPV equal to zero (Jackson & Sawyers, 2008; Kierulff, 2008).
The Profitability Index (IR) is the expression of the ratio between the present value of future cash flows and their initial cost (Ross, 2000). In other words, it represents the quotient of the NPV related to the initial cost of the investment (Brealey, Myers & Marcus, 2002; Viviers & Cohen, 2011).
Practices in capital investment that recognize the value of money over time and use discounted cash flow techniques are preferred by most decision makers (Jackson & Sawyers, 2008). However, these non-discounted methods are not yet used by some managers in practice. Among the most commons are the Payback Period (PP) and the Accounting Rate of Return (ARR) (Hermes et al., 2007; Ross et al., 2004; Ross, 2000).
An indicator widely used in the screening process is PP. In it, the amount of time needed for a long-term project to recover or pay the initial investment is assessed. In other words, it measures how long a project takes to pay itself (Jackson & Sawyers, 2008).
The two main weaknesses of PP lie in the fact of not taking into account the value of money over time and disregarding everything that happens after the recovery period. This last restriction penalizes all of those projects that have small initial revenues but grow throughout their lives (Souza & Clemente, 2008).
Discounted Payback (DP) concerns the time required for the project to recover the investment made, including the minimum return set by the investor, that is, investments and returns are considered in present value (Brom & Balian, 2007).
The Accounting Rate of Return (ARR) is the accounting measure of profit divided by the accounting amount of the investment (Horngren, Foster & Datar, 2000). Galesne, Fensterseifer and Lamb (1999) claim that the investment analysis that has as ARR a parameter is usually employed by leaders of companies concerned with balance sheet results. In this method, the average projected profits after depreciation and taxes are divided by the investment in the project or the corresponding net worth and are then compared with the same measure for the company as a whole or with a pattern of its choice.
In turn, the analysis of Real Options (RO) is a practice for assessment of investments in real assets that considers the value of embedded options and the flexibility of the dynamic process of decision-making (Brealey et al., 2002).
According to Bennouna et al. (2010), one of the main developments in the literature of capital budgeting over the last decade has been the RO. That is because much of the capital investment projects have options that have value (e.g., the option to expand or abandon).
Still, the empirical literature points out that only a relatively small number of companies employs RO (Graham & Harvey, 2001; Block, 2007; Brounen, Jong & Koedijk, 2004; Hermes et al., 2007; Ryan & Ryan, 2002; Truong et al., 2008).
Practices for setting the discount rate
The discount rate or cost of capital is the percentage that companies use to calculate, discounting or composing the value of money of cash flows over time (Brom & Balian, 2007).
To calculate the discount rates, companies can use, among other practices, Debt Cost (DC), Cost of Equity (CE) or Weighted Average Cost of Capital (WACC).
Indeed, it appears that the DC - third parties debt cost - is the discount rate that measures the current cost for the company to take funds for project financing (Damodaran, 2002).
In turn, the CSP - cost of shareholder capital - is the return expected by the investor of their capital invested in a given investment, and this return would be likely to be obtained in other applications of the same market risk (Damodaran, 2002).
WACC may be understood as the most sophisticated required rate of return on any investment proposal which have the same level of risk, such as the assets of a company (Bennouna et al., 2010). In this stage, Block (2011) claims that WACC is the required rate of return on investment suggestions that directs to a balanced capital structure, in which the Debt Cost and the Cost of Equity are used in a pre-set percentage.
With respect to discount rates, Brigham and Ehrhardt (2002) assert that the companies should preferably use the weighted average cost of various funds and sources, including debt, preferred stocks and joint assets.
In general, it is recommended that companies employ differential rates for investment projects, units or divisions. When analyzing the market return, the company can develop different rates for different and new investments, including projects outside its core business (Damodaran, 2002).
Practices for risk analysis
Investment decisions are and should be taken under conditions of uncertainty. For this reason, the company director must take risks. The risk of failure of the investment is one in which the company manager will focus efforts to mitigate it, trying to predict the future evolution of the profitability of their investment (Galesne et al., 1999).
The simplest practices of risk analysis for investments comprise setting discount rates. Otherwise, the sophisticated practices include probabilistic risk analyses, such as sensitivity analysis, scenario analysis, decision tree, Monte Carlo simulation, among others.
In the sensitivity analysis, the effect that the variation of the input data may have on the organization's results is studied (Gitman, 2010). For this reason, when a variation in a parameter dramatically changes the profitability of a project, it is said that this one is very sensitive to the parameter (Casarotto Filho & Kopittke, 2010).
It is found, therefore, that the scenario analysis is used to assess the impact on the organization's return, due to simultaneous changes in several variables (Gitman, 2010).
As for the decision tree, it is a practice applied in the identification of uncertain cash flows (Ross et al., 2004). It is formed by a diagram of sequential decisions and possible results (Brealey et al., 2002).
As for the decision tree, it is a practice applied in the identification of uncertain cash flows (Ross et al., 2004). It is formed by a diagram of sequential decisions and possible results (Brealey et al., 2002).
Casarotto Filho and Kopittke (2010) define decision tree as a graphical way to view the consequences of current decisions and related random events.
Another sophisticated practice is the Monte Carlo simulation. It takes place in stochastic simulations with various applications and areas (Hromkovic, 2001). Moore and Weatherford (2006) complement, stating that it is one of several ways to analyze the propagation of uncertainty, where its advantage is to determine how an already known random variation, or an error, affects the performance or viability of the project being modeled.
Studies on capital budgeting practices
Studies on capital budgeting practices have been made in recent decades in different continents, countries and regions. The methodology used by the authors to question the companies, namely, respondent managers, involves the use of questionnaires and/or interviews.
Initially, it is noted that there is a peculiarity of time when each search was performed, as well as the location. Such factors may influence the perception of the results, given the diversity of socio- economic scenarios, globalization, opening new markets, crises and technological changes, among others.
Table 1 shows studies of capital budgeting that were conducted from 1978 to 2012, covering some of the practices addressed, namely, for Investment Analysis, Discount Rate Setting and Risk Analysis.
Table 1 Use of capital budgeting practices in percentage.
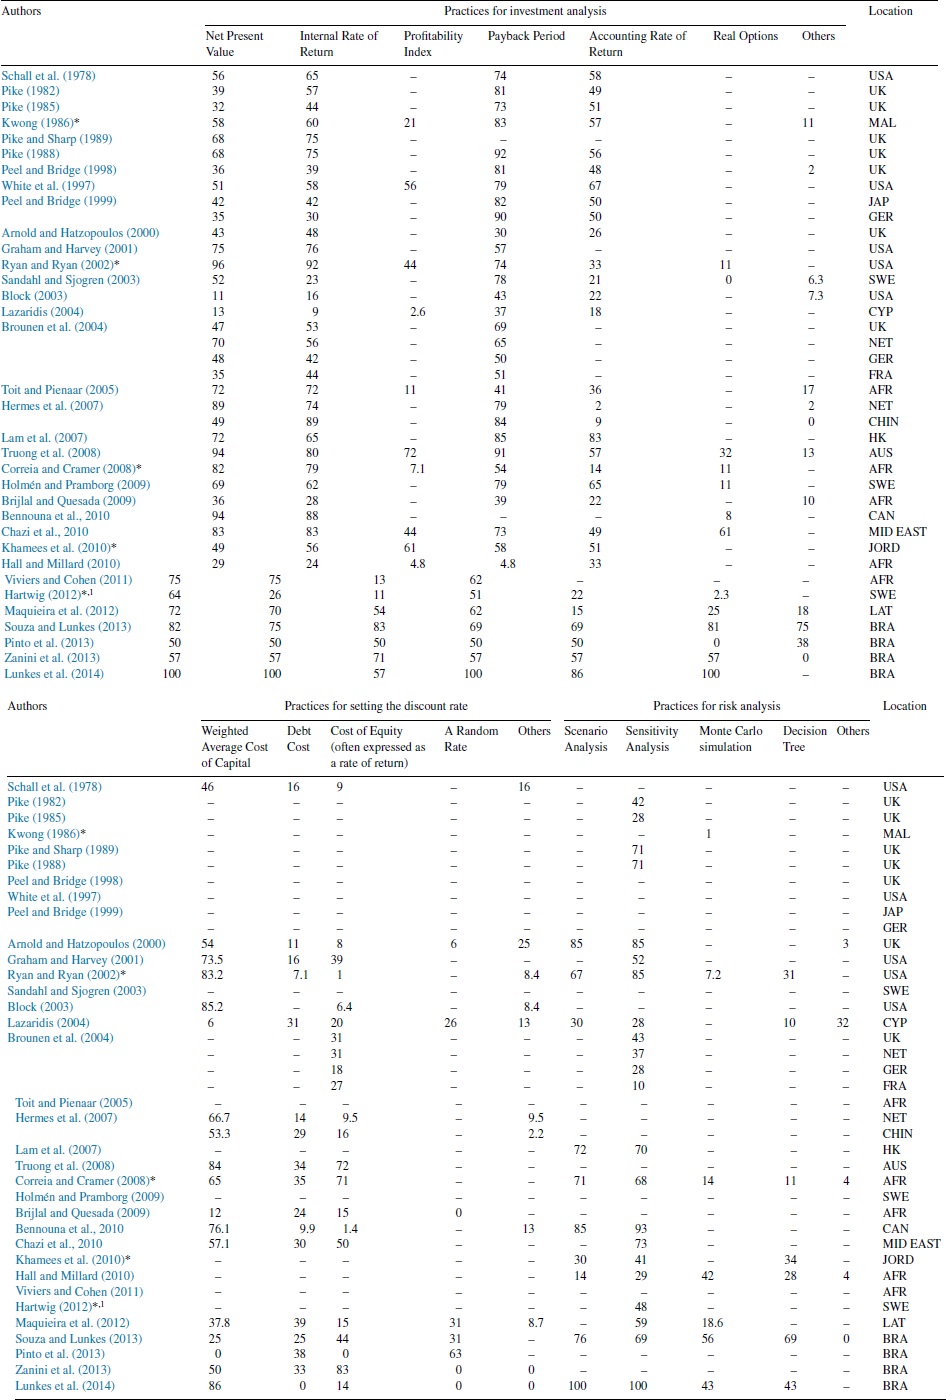
Source: Adapted from Souza and Lunkes (2013, p.34).
-Not applicable/* Always, often or sometimes.
IND - National independent - RU/SUB - National subsidiary - RU
LAT - Argentina, Chile, Colombia, Ecuador, Peru, Uruguay, Venezuela and others (Bolivia, Brazil, Costa Rica, El Salvador and Mexico).
1 The result by size of enterprises in 2008 is considered (Hartwig, 2012).
With regard to practices for investment analysis found in the studies, the Payback Period is noticed as the most used (Block, 2003; Brijlal & Quesada, 2009; Brounen et al., 2004; Holmén & Pramborg, 2009; Kwong, 1986; Lam et al., 2007; Lazaridis, 2004; Peel & Bridge, 1998, 1999; Pike, 1982, 1985, 1988; Sandahl & Sjogren, 2003; Schall, Sundem & Geijsbeek, 1978; White, Miles & Munilla, 1997).
Also, it can be seen that the methodology of the Net Present Value (NPV) is quite usual from the year 2002, being predominant until the year 2012 (Bennouna et al., 2010; Brounen et al., 2004; Correia & Cramer, 2008; Hartwig, 2012; Hermes et al., 2007; Maquieira et al., 2012; Ryan & Ryan, 2002; Truong et al., 2008).
On the other hand, the Real Options (Real Options Valuation, also often termed real options analysis (ROV or ROA)) are among the least practiced in US organizations (Ryan & Ryan, 2002), in Sweden (Holmén & Pramborg, 2009; Sandahl & Sjogren, 2003), in Australia (Truong et al., 2008) and in Canada (Bennouna et al., 2010).
Research previously carried out indicates that there is a preponderance of the WACC methodology (weighted average cost of capital) used in different countries, such as in the United States (Block, 2003; Graham & Harvey, 2001; Ryan & Ryan, 2002; Schall et al., 1978), United Kingdom (Arnold & Hatzopoulos, 2000), The Netherlands and China (Hermes et al., 2007), Australia (Truong et al., 2008), Middle East (Chazi, Terra & Zanella, 2010; Khamees, Al-Fayoumi & Al-Thuneibat, 2010) and Canada (Bennouna et al., 2010).
As for the practices for risk analysis of investment, it is assessed that the analysis of scenarios and sensitivity are the most exploited in companies (Arnold & Hatzopoulos, 2000; Bennouna et al., 2010; Correia & Cramer, 2008; Lam et al., 2007; Ryan & Ryan, 2002).
It can be seen that the main practices in analysis of investments employed are the Payback Period, with a strong preponderance from 1978 to 1999 and the Net Present Value (NPV), especially in the years 2002 to 2012. On the other hand, the Net Present Value (NPV) was the used less technique during the period from 1978 to 1999. The Weighted Average Cost of Capital is the most used discount rate in enterprises (12 surveys), while the Cost of Equity (often expressed as a rate of return) appears in 7 of the surveys as the least used. The sensitivity analysis is the most chosen methodology by managers for the risk analysis and the decision tree is the least chosen.
These findings represent a clue that, over the years, companies have adopted practices that consider the value of money over time (Discounted Cash Flow, DCF). In other words, it means that the level of sophistication of capital budgeting practices is increasing.
Theoretical assumptions of the research
Several times the researcher has some idea, presumption or thinking about the behavior of a variable or of a possible association between variables. In such cases, theoretical assumptions of research should be developed in a way that allows, from the sample data, to test the validity of ideas about the study population (Barbetta, Reis & Bornia, 2010).
Indeed, the theoretical assumptions of this study are developed from a review of the literature and empirical work described in the subsection of similar studies.
Finding that companies repeatedly choose methods outside the Discounted Cash Flow (DCF), many researchers have sought justifications for the use of traditional practices. In this line, Graham and Harvey (2001) claim that this can be attributed to the lack of sophistication from the management. Therefore, the following assumption is established: high adherence to sophisticated practices is positively associated to the level of education of the person in charge of the budget (A1).
The studies by Graham and Harvey (2001), Brounen et al. (2004) corroborate the ones by Maquieira et al. (2012) when they indicate that the company's size significantly affects the adoption of capital budgeting practices. They have concluded that large companies tend to use more sophisticated methodologies for project assessment, while the small companies tend to employ the more traditional methodologies. Thus, it is suggested that the increased use of sophisticated practices is positively associated with the company's size (A2).
Finally, Pike and Sharp (1989) point out a relationship between the use of discounted cash flow practices and a computer-based capital investment package, suggesting that much of this growth stems from the development of end-user computing. Therefore, it is pointed out that the higher the level of the information system, in order to provide more information related to the decision-making about the capital budgeting, the more the managers tend to use sophisticated practices. Thus, the following assumption is established: the information system level is positively associated with the use of sophisticated capital budgeting practices (A3).
Table 2 shows the theoretical assumptions of research and the sources that underlie.
Table 2 Theoretical assumptions of research.
| Assumptions | References |
|---|---|
| A1: increased use of sophisticated practices is positively associated with the level of education of the person in charge of capital budgeting | Graham and Harvey (2001) |
| A2: the increased use of sophisticated practices is positively associated with the company's size | Graham and Harvey (2001) |
| Brounen et al. (2004) | |
| Maquieira et al. (2012) | |
| A3: the information system level is positively associated with the use of sophisticated capital budgeting practices | Pike and Sharp (1989) |
Source: Developed by the author.
Methodological procedures
This section is intended to show the procedures adopted for the preparation of this research. First, it presents its framework. Following, is directed to the explanation about the intervention instrument, population and sample, the questionnaire was applied, and finally, the correlation.
Development and implementation of the questionnaire
In Table 1 can be seen the practices relating to investment analysis and discount rate and risk analysis definitions, in addition to best practices in capital budgeting, covering the items presented in the literature review.
It is noteworthy that such an instrument was originally structured and applied by Souza and Lunkes (2013) in hotels in year 2012 and adjustments have been made over years 2013 and 2014.
Other studies were published in events and magazines as initial studies (Lunkes, Belli, Andruchechen & Suave, 2014; Pinto, Ventura, Lunkes & Petri, 2013; Silva, Suave & Codesso, 2013; Zanini, Souza & Lunkes, 2013), aiming at improvements suggested by participants and evaluators. Therefore, it must be clarified that the present work is part of a longitudinal study.
Studies in Brazil applied questionnaires to find out which practices managers use in the analysis of investment projects. Unlike these, this study goes further, since it identifies assumptions in the literature and checks are valid for Brazilian companies. Such assumptions are verified by statistical correlations between the variables, in this case, the practices. Other tests are applied when there is a correlation.
In the investment analysis practices, the Discounted Payback (DP) was added and the Payback is used as the first or second method. Both additions were suggested at conferences and by evaluators of articles submitted to journals.
In addition to the practices, the questionnaire comprises aspects relating to management and investment expenditures audit, besides the information available by the company information systems.
Population and sample
In order to achieve the goal of this study, the companies traded at the BM&F BOVESPA (in full, Bolsa de Valores, Mercadorias & Futuros de São Paulo; São Paulo Stock Exchange) (Bovespa) were selected.
On September 23, 2014, the population was composed of 491 Brazilian companies traded at BM&F BOVESPA, distributed in 10 different economic sectors, except real estate funds and stocks.
To obtain survey responses, the company was first contacted by telephone, in order to reach the person in charge of capital budgeting. In a second step, the questionnaire was presented and sent by e- mail to the person who would be the respondent. Google form was adopted as a tool. But when inaccessible, an editable text file was sent to the participant.
Thus, the questionnaires were sent during the period from 03/20/2013 to 07/30/2014. After this period, it was found that 28 companies belonged to a group and therefore capital budgeting was done by the same management. Therefore, the final sample consisted of 463 companies.
On 08/01/2014, it was found that 51 companies had answered to the survey questionnaire, according to Table 3. These companies are part of the analysis of the results.
Table 3 Respondent companies.
| Sector | Number of respondent companies |
BM&F BOVESPA |
|---|---|---|
| Industrial goods | 13 | 37 |
| Basic materials | 13 | 39 |
| Financial and others | 8 | 70 |
| Construction and transport | 7 | 61 |
| For public use | 7 | 61 |
| Consumer cyclicals | 2 | 74 |
| Oil, gas and biofuels | 1 | 13 |
Source: Developed by the author.
As seen in Table 3, the sample included companies with different characteristics. As for the total assets in the balance sheet of 12/31/2013 published by the companies, 21.57% ended 2013 with less than 1.0 billion reais, 31.37% amounted to 1-5 billion reais, 43.13% 5-350 billion reais and 3.92% from 750 billion to 1.3 trillion reais. Regarding the results, 16 companies lost money, one lost less than 1 million reais in profits, 24 between 1 and 500 million reais and 10 between 500 million and 25 billion reais.
Correlation (statistical analyzes)
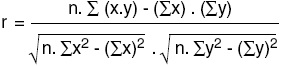
The correlation is the numeric association between variables with strength or degree of relationship, not necessarily implying cause and effect (Barbetta et al., 2010).
In statistics, the variables are associated when they have similarities in the distribution of the scores, that is, they are related by means of the frequency distribution or the link of variance sharing. The Pearson correlation uses such sharing between two variables in which the increase or decrease of a variable "A" creates the same effect in variable "B" (Fippgueiredo Filho & Silva Filho, 2009).
In analyzing the results, it is considered that the Pearson correlation coefficient (r ) varies from −1 to 1. The positive or negative directions suggest the strength of the relationship between the variables. A correlation of −1 or 1 demonstrates that the score of a variable can be determined by knowing the other. Moreover, a correlation of zero indicates no linear relationship between the variables (Fippgueiredo Filho & Silva Filho, 2009).
The present study assesses the correlation between the variables of the theoretical assumptions of the research described in the section "Practices for risk analysis". Indeed, in assumption 1 (A1) the variables are sophisticated education and practices. In assumption 2 (A2), the variables are net worth and sophisticated practices. And in assumption 3 (A3) the variables are level of information system and sophisticated practices.
The variable education is obtained from the answer to question 4 of the questionnaire, transformed into a scale of 1-5: average level (1), graduation (2), postgraduation (3), master's degree (4) and doctorate degree (5).
As for the variable of sophisticated practice, it is transformed in the same way as the variable level of the information system and subsequently the average of such practices is obtained.
Otherwise, the variable net worth is obtained at the São Paulo Stock Exchange website. The figure published in the 2013 Balance Sheet is used.
The variable level of the information system is obtained by the answers to question 15. As in the question mentioned there are six items assessed by a Likert scale of five levels, it was transformed to a scale of 1-5: never (1), rarely (2), possibly (3), often (4) and always (5). Then, the average of the responses is obtained from each company so that the items are transformed in a single variable.
For the interpretation of the magnitude of the correlations, the classification of the correlation coefficients was adopted, according to Hair et al. (2005): greater than 0.91 (strong), from 0.71 to 0.90 (high), from 0.41 to 0.70 (moderate), from 0.21 to 0.40 and from 0.01 to 0.20 (mild). The correlation is calculated using the equation shown in Fig. 1:
Data presentation and discussion of results
These companies were asked about the profile of the director responsible for the investment budget process. It was noted that the majority of managers (49%) is in the age group 50-59 years old. With regard to the time as an office manager, 41% of the directors said they had been working with the company for over 9 years, while 31.5% said they had been working for at least 4 years.
In relation to schooling, 68.5% of the directors reported being postgraduates in a given area. Moreover, it was observed that 10% of the sample companies surveyed are managed by a director who has a master's degree and 4% have a doctorate degree. The results suggest that few budget managers of the companies surveyed have a training in master's or doctoral levels, indicating that the professionals that are selected to work in this area in public companies tend to be postgraduates.
Practices for investment analysis
The first theme of the questionnaire related to capital budgeting refers to the practices used in the investment analysis. These companies have answered about the frequency with which various practices discussed in the literature are used, as shown in Table 4.
Table 4 Results of investment analysis practices.
| How often does the company use one of these practices in investment analysis? | |||||
|---|---|---|---|---|---|
| Practices | Always (%) | Often (%) | Possibly (%) | Rarely (%) | Never (%) |
| Net Present Value (NPV) | 35.29 | 29.41 | 19.61 | 3.92 | 5.88 |
| Internal Rate of Return | 33.33 | 27.45 | 21.57 | 1.96 | 7.84 |
| Modified Internal Rate Of Return | 3.92 | 7.84 | 27.45 | 11.76 | 29.41 |
| Profitability Index | 23.53 | 11.76 | 21.57 | 1.96 | 21.57 |
| Payback Period | 33.33 | 37.25 | 13.73 | - | 7.84 |
| Discounted Payback | - | 1.96 | 3.92 | - | 5.88 |
| Accounting Rate of Return | 7.84 | 25.49 | 15.69 | 5.88 | 27.45 |
| Real Options | 11.76 | 13.73 | 23.53 | 5.88 | 35.29 |
| Others | - | - | 5.88 | - | 94.12 |
Source: Survey data.
From the results presented in Table 4, it can be seen that most respondent companies (70.5%) ensure that they always or often use the Payback Period (PP) on assessing investments. Also often used are the Net Present Value (64.5%) and the Internal Rate of Return (61%).
This finding suggests that some companies ignore the weaknesses pointed out by Payback in literature and continue to employ a method that does not consider the value of money over time.
Explanations for this may be that the managers traditionally or culturally use the practice of PP, which involves lower cost, more flexibility and ease of calculation and the lower cognitive effort that it requires compared to other practices.
The high utilization can be as an investment screening method. There is even a question in the questionnaire on the use of PP as the first or second method, but it was little answered, endangering the analysis of the use of the practice that is being mentioned. This is because 6% said they use it as a first method and other 6% as the second one.
In addition, Table 3 shows that the Modified Internal Rate of Return (MIRR) is not always used in the analysis of the investment budget and is never used by 29.5% of the companies. The Real Options (RO) are unusual practices in the researched companies, since 41% rarely or never employ them.
Of the 51 respondent companies, 6% reported that occasionally they adopt other practices. Of these different practices were cited: assessment of demands and strategies, business plan return and market study.
Our results show that the surveyed companies use cash flow discounted practices in investment analysis, which includes the NPV and IRT (Internal Rate of Return). However, many are still making use of traditional practices such as Payback and the Accounting Rate of Return, even with the flaws recurrently shown in the literature.
Practices for setting the discount rate
The next stage of the research deals with the discount rates used in setting the minimum rate of return acceptable for a new investment. It is inferred from the results that the more frequently practice used in setting the minimum rate of return is the Weighted Average Cost of Capital, with approximately 63% or 32 companies surveyed. A Random Rate is used by only 15.5% of the sample investigated. Furthermore, it is seen that 6% of the survey participant companies have answered that they employ other practices. Of these 6%, 4% adopt the Brazilian rate system Sistema Especial de Liquidação e Custódia (SELIC) (Special Clearance and Escrow System) and 2% adopt the average return rate of similar projects.
In the academic literature, it is argued that WACC is among the most sophisticated rates for determining the cost of capital. The results indicate that the WACC was predominantly chosen among those responsible for the capital budgeting, showing that the respondent companies tend to use more sophisticated rates for setting the minimum rate of return.
Practices for risk analysis
The third group of capital budgeting practices investigated in the research concerns the risk analysis of investments. Table 5 shows the responses obtained by the participating companies.
Table 5 Result of the risk analysis of investments.
| How often does the company use the practice to do risk analyses of investments? | |||||
|---|---|---|---|---|---|
| Practices | Always (%) | Often (%) | Possibly (%) | Rarely (%) | Never (%) |
| Scenario analysis | 52.94 | 15.69 | 13.73 | 3.92 | 5.88 |
| Sensitivity analysis | 35.29 | 19.61 | 17.65 | 9.80 | 9.80 |
| Monte Carlo simulation | 11.76 | 11.76 | 5.88 | 13.73 | 49.02 |
| Decision tree | 3.92 | 19.61 | 15.69 | 11.76 | 39.22 |
| Others | - | - | 3.92 | - | - |
Source: Survey data.
As for the risk analysis practices often used by the companies examined, it is possible to see the predominance of a continuous use of scenario analysis and sensitivity analysis. Table 5 also shows that approximately 63% of this study sample rarely or never employ the stochastic Monte Carlo simulation, and 51% do not use the decision tree in investment analysis. Also, it is seen that 49% of the companies do not use a formal practice for risk analysis of the capital budgeting. It is assumed that this occurs in the assessment of smaller investments made by the organizations.
It does not go unnoticed that 96% of the participating companies do not seek to adopt another methodology to effect risk analysis. One company has reported using the ratio between the value at risk and the stress test.
It is important to note that the practices in risk analysis are not mutually exclusive and can be adopted to encourage investment decisions. Additionally, the literature itself advises that the investment decision should be grounded in several methods and criteria, without having a dominant one (Carmona et al. , 2011).
The results found in this phase of the research show that the companies give more emphasis to the scenario to do the risk analysis.
In concluding this topic, it is observed that the companies often use sophisticated practices consisting of probabilistic risk analysis, such as analysis of scenarios and sensitivity.
Comparison with similar studies
The managers of Brazilian companies have said that they use mainly the Payback Period, followed by the Net Present Value and the Internal Rate of Return. Less frequently, they employ the Real Options and the Modified Internal Rate of Return.
In similar studies, the Payback Period is shown as a very usual method (Brijlal & Quesada, 2009; Brounen et al., 2004; Holmén & Pramborg, 2009; Kwong, 1986; Lam et al., 2007; Lazaridis, 2004; Peel & Bridge, 1998, 1999; Pike, 1982, 1985, 1988; Sandahl & Sjogren, 2003; Schall et al., 1978; White et al., 1997). Thus, it appears that the Payback is still commonly used, even with its weaknesses. Being a traditional method, it must be employed as a secondary practice of cutting and not as one that will define whether or not the investment will be done.
Moreover, at least in theory, it can be inferred that the Payback has begun to be used in a complementary way, as the practices of the Net Present Value and Internal Rate of Return are also usual in companies of this study and of the participants in research carried out in the United Kingdom, in the United States, in The Netherlands, in Australia, in South Africa, in Canada in Sweden and in certain companies in Latin America.
The low adoption of the practice of Real Options (RO) was already expected. In fact, the empirical literature shows that only a relatively small number of companies employ the RO. This finding corroborates the studies done by Ryan and Ryan (2002), Sandahl and Sjogren (2003), Truong et al. (2008), Holmén and Pramborg (2009), Bennouna et al. (2010), Hartwig (2012), and Pinto et al. (2013).
The practice considered as the most sophisticated in the literature for discount rate setting is the Weighted Average Cost of Capital (WACC). The managers of the participating Brazilian companies have reported using more often the WACC.
Likewise, research previously carried out indicates that there is a preponderance of the WACC methodology (weighted average cost of capital) used in different countries, such as in the United States, United Kingdom, The Netherlands and China, Australia, Middle East and Canada.
Brazilian companies participating in the research use a scenario and sensitivity analysis for risk analysis. By the way, these results reinforce other studies that have looked at the prevalence of the use of methods of analysis of scenarios and sensitivity in companies (Arnold & Hatzopoulos, 2000; Bennouna et al., 2010; Correia & Cramer, 2008; Lam et al., 2007; Ryan & Ryan, 2002).
The stochastic Monte Carlo simulation has a very low percentage of adoption by both the respondent companies as the companies participating in the research by Ryan and Ryan (2002), Maquieira et al. (2012) and Souza and Lunkes (2013). It is suggested that the low percentage of use is due to the complexity of the method that, in some cases, can be the cause for the managers' lack of knowledge.
Table 6 summarizes the comparisons of the most common practices among the surveyed companies and similar studies.
Table 6 Most used practices in companies.
| Practices | Companies surveyed | Companies of similar studies |
|---|---|---|
| Investment analysis | Payback Period | Payback Period (up to 2002) |
| Net Present Value (NPV) | Net Present Value (after 2002) | |
| Setting the discount rate | Weighted Average Cost of Capital | Weighted Average Cost of Capital |
| Risk analysis | Scenario analysis | Scenario Analysis |
| Sensitivity analysis | Sensitivity Analysis |
Source: Developed by the author.
Finally, it is considered that the majority of the Brazilian publicly traded companies in the sample have shown results converging with research from various countries. Indeed, a large part of both uses sophisticated practices to develop capital budgeting, but still often uses traditional practices.
Thus, it is recommended that companies adopt more sophisticated practices to do the analysis of investment projects or that the adoption be related to the relevance of the investment. In this course, it is essential that they use traditional practices as an additional measure and for smaller investments, trying to avoid that disastrous investments be done, based on fragile practices.
Verification of theoretical assumptions
The theoretical assumptions are verified by analyzing the correlation among the variables. For this step, the sample comprised only the practices considered sophisticated in the literature. The responses of the participating companies are processed in Gretl software.
Firstly, the sophisticated practices are studied, which are variables from the three theoretical assumptions, as shown in Table 7.
Table 7 Data from the sophisticated practices.
| Sophisticated practices | Average | Median | Standard deviation |
|---|---|---|---|
| NPV | 38.958 | 4.00 | 11.530 |
| IRT | 38.298 | 4.00 | 12.036 |
| MIRR | 22.927 | 2.00 | 11.671 |
| PI (Profitability Index) | 31.707 | 3.00 | 15.637 |
| RO | 25.652 | 3.00 | 14.705 |
| WACC | 35.098 | 5.00 | 19.532 |
| Scenario analysis | 41.489 | 5.00 | 12.155 |
| Sensitivity analysis | 36.596 | 4.00 | 13.717 |
| Monte Carlo simulation | 21.087 | 1.00 | 14.641 |
| Decision tree | 23.043 | 2.00 | 23.043 |
Source: Developed by the author.
In Table 7 it can be seen that the scenario analysis is a sophisticated practice that has the highest average of responses (4.1489). For this reason, it has a greater adhesion in comparison to other practices in the table.
On the other hand, WACC is the practice that has a higher standard deviation of responses, that is, a greater variation around its average responses (3.5098).
Also noteworthy is that the Monte Carlo simulation shows the lowest median and average of 1.0 and 2.1087, respectively. Certainly, it is the sophisticated practice with the lowest adhesion, never or rarely used by most of the respondents.
Theoretical assumption 1 (A1) established that there is a weak correlation between the use of sophisticated practices and the level of education, ranging from −0.2172 in WACC to 0.1977 in RO. Such weighting implies that the choice of the manager, when employing a sophisticated practice, is not related to their education.
In turn, theoretical assumption 2 (A2) presented that the investment analysis practices have a low positive correlation; WACC has the lowest negative correlation and risk analysis practices. The positive relationship indicates that the higher the net worth of the company, the greater the use of sophisticated practices. However, this happens in a few cases.
Finally in theoretical assumption 3 (A3) showed that there are more positive correlations compared to other assumptions. Under a general spectrum, the variables are unrelated. That is, as a rule, the level of the information system does not influence directly and positively the use of more sophisticated practices.
The cross-correlation among the practices allows additional deductions on the use of practices by means of the participants' responses. That is, it can be seen when using a practice is associated with the use of another (strong positive correlation) and when it is not (strong negative correlation). This analysis is done for most companies' responses, given that many workers in charge of the capital budgeting have answered about various practices.
In this sense, four strong correlations in correlation matrices are observed, namely: those who use NPV also use IRT; those who use PI also use MIRR; those who use sensitivity analysis also do the scenario analysis; and those who use the decision tree also use the Monte Carlo simulation.
In the correlation of simple practices, two strong correlations are seen: those who use DP also use PP and those using ARR also use DP.
Finally, it should be noted that another statistical tool was not used because there is no evidence of a mathematical correlation between the use of sophisticated practices and the level of education of those responsible for the budget and between the company's size and the level of information system of the companies searched. In other words, there is no relation of cause and effect among the variables.
Conclusions and recommendations
Review of the literature and studies on capital budgeting practices have shown an improvement of investment management processes over the years. Sophisticated practices have become increasingly accepted and prevalent in the assessment of capital investment projects.
Comparison among studies indicate an increasing sophistication, but traditional practices such as Payback Period and Accounting Rate of Return continue to be employed by the companies participating in this research and in similar studies.
Possible reasons for this may be because such practices are used to screen the projects. Also, because the managers traditionally or culturally use the most simple practices, they involve a lower cost, are more agile and easy to calculate, and require less effort when compared to other practices.
Verification of theoretical assumptions has shown a non-existent correlation between the education of the professional in charge of the budget, the size of the company and the level of information system with the use of sophisticated practices. This means that there is no relationship of cause and effect among the variables to explain the use of sophisticated practices.
The chronological analysis of studies on practices allows for the conclusion that there is a general trend toward sophistication in the use of capital budgeting practices of the companies surveyed. However, it is noticed that there are still managers who adopt practices that do not consider the amount of money over time in the assessment of investment projects, which encourages further studies.
In conclusion, it appears that executives use the mainline practices that business schools have encouraged for years, NPV and CAPM, the value of projects and to estimate the cost of equity. On the other hand, executives are not likely to follow the proscribed factors in academic theories to determine the capital structure.
If academics are responsible for checking the best methodologies to be employed in the practices of companies, why executives do not use? The non-use, improper or incorrect use of capital budgeting practices can cause disastrous financial results for companies, since this budget involves a high amount of resources. This finding raises possibilities that require reflection and further research.
Among the limitations of the work is the absence of justification for the managers to continue using less advanced capital budgeting practices in capital budgeting. The fact that the research is related to the research sample object of study, which can distort the results for the other publicly traded companies.
Another limitation concerns the budgeting practices in the questionnaire, because in the reality of organizations other practices can be employed. It must be highlighted that the result of this research, previous research studies and also the correlation of theoretical assumptions are done from questionnaires answered about confidential information of companies and do not always reflect the truth.
Because of the scarcity of studies on capital budgeting, it is recommended that a broader set of data is taken into account when carrying out further studies, in terms of the number of companies and budgeting practices. Also, an evolvement of this study is suggested, done with other variables such as sector of the economy, year of conducting the search, country, economic times, etc.
Developing a model of capital budgeting that allows the company to verify its scenario in relation to the practices used, allowing the identification of strengths and deficits, is also proposed.

