


 text new page (beta)
 English (pdf)
 Article in xml format
 Article references
 Send this article by e-mail
 Cited by SciELO
  Similars in
SciELO
Similars in
SciELO 
 Permalink
JEL classification: M10, O30
Introduction
In this moment, are considered as important key factors to develop competitiveness in business: Innovation (INNOV, Chesbrough, Vanhaverbeke, & West, 2006) and the Customer Knowledge Management (CKM, Garcia-Murillo & Annabi, 2002). So, this study is aimed to identify the CKM variables, factors and indicators that are influenced by INNOV of the 500 Chief Executive Officer (CEO) from the Small & Media Enterprises (SME) belonging to the Software Sector in Guadalajara, Mexico (SSG) considered as one of the most successful industrial sectors in the creation of innovation. This work is presented for explanation in: (1) contextual reference, problem, research questions, hypotheses and rationale for the study; (2) the theoretical framework, which is a collection of concepts about INNOV and CKM, closing with the design of the questionnaire; (3) Methodology; (4) Results; (5) Analysis of Results, Discussion and finally; (6) Conclusions. One sector, that is considered successful, fast-growing and highly dependent on value creation and innovation generation is the SSG. According to INEGI (2014), in Guadalajara City located in Jalisco state, there are around 500 firms that are directly or indirectly related with SSG, which have opportunities to develop them into the Digital Creative City program. This program, was officially announced on January 30, 2012 by President Felipe Calderon to enable 1000 acres, with an investment close to 1000 million USD looking for create 20,000 jobs in 10 years. Disney, Pixar Studios and Disney already have shown interest in joining to the Jaliwood concept of Mexico. The Global Innovation Index Report (INSEAD, 2013) ranked our country on site 63/142, with direct consequence on its competitiveness level, which is located on site 55/144 according to The Global Competitiveness Report 2013-2014 (WEF, 2014). Hence, the importance for identifying and promoting in a systematic way, the major factors such as the relation between CKM influenced by INNOV to get more and new competitive advantage.
Problem, research questions, rationale for the study
So, our problem is described in a General Question (GQ), as: Which are the latent factors in CKM influenced by INNOV relationship? The rationale of the study is due the interest of SSG companies to identify such latent factors, to be more competitive. The Specific Questions (SQ), were: SQ1.- Which are the factors, variables and indicators of the general conceptual model? ; SQ2.- Which are the relationships of the CKM latent factors influenced by INNOV? ; SQ3.- Which are the most relevant CKM latent indicators influenced by INNOV model ?
Literature review
The Innovation and Customer Knowledge Management as leverage of competitive advantage
The competitiveness recognizes the potential of the CKM influenced by INNOV (Laudon & Laudon, 2012). Many authors have tried to identify different senses of CKM information, like: for, from, about and to co-create customer (Desouza et al., 2007; Nambisan, 2002; Nicolai, Keld, & Pedersen, 2011). Even more, there are efforts to determine the negative side effects of Customer Integration (Gassmann, Kausch, & Enkel, 2012) in CKM. The importance of how the knowledge can be supported by means of the human resources, the exchange amongst them, the rewards (Gebert, Geib, Kolbe, & Riempp, 2013; Gloet & Samson, 2013; Nicolai et al., 2011; OECD, 2003) and the influence of the Information and Communication Technologies (ICT, Laudon & Laudon, 2012) is evident to boost the innovation stages. The Firm must keep special care about the internal and external sources of information and how to extract them for CKM process (Chiu & Fogel, 2014; Garcia-Murillo & Annabi, 2002; Gebert et al., 2013). The results of all these information sources are very remarkable around the terms of satisfaction, experience and performance, being representatives as principal indicators of the CKM (Garcia-Murillo & Annabi, 2002).
Innovation (INNOV) and their components
The competitiveness recognizes the potential of the INNOV (Chesbrough et al., 2006; Laudon & Laudon, 2012; Mckinsey, 2008; OECD, 2005) and their different stages (Rogers, 1983; Rothwell, 1994). According to DRAE (2014), the word innovation comes from the latin innovatio,-ōnis and means: 1. f. Action and effect to innovate, and 2. f. Creating or modifying a product. For the Oslo Manual (OECD, 2005) innovation is: the introduction of a new or significantly improved product (good/service), process, a new marketing method, or a new organizational method in the internal business practices, the workplace organization or external relations, so it is not just limited to the field of technology, product or services. Also, OECD (2005) recognizes the process of creative destruction, enunciated by Schumpeter, whom classifies two types of innovations: the radicals that contribute to major changes in the world and, the incremental , happening on an ongoing change process. In this sense, we quote The Rogers Innovation Bell (1984), that divides the innovation market in: a.-the innovators (they are very careful to use the latest in technology, and very important to communicate and spread); b.- early adopters (people considered as opinion leaders and influence their environment but are very careful to suggest and/or use the latest innovations); c.-early majority (conservative people, but open to technological change with some level of careful to adopt it); d.-late majority (consumers particularly skeptical to the use of innovations until a large number of his acquaintances, has adopted it); 5.-the laggards (very traditional people maintaining the old forms; they hardly accept any changes and adapt to them until they become a habit even.). Other effort to define different innovation stages, is the proposal of Rothwell (1994), determining different Innovation Models , such as: (a) First Generation: Technology-Push; (b) Second Generation: Market-Pull; (c) Third Generation: Coupling Model; (d) Fourth Generation: Integrated Innovation Process; (e) Fifth Generation: System Integration and Networking.
The innovation model
The other one additional attempt to explain and predict how works the innovation in the industrial sectors such as the SSG, is the model of Innovation Stages (INNOV), proposed by Mejía-Trejo, Sánchez-Gutiérrez, and Ortiz-Barrera (2013); briefly the conceptual model involves 6 variables:
A.- (IVADD).- Innovation Value Added or the real proposal of intention, where several agents, beside the customer are in interaction, such as: the shareholder, the Firm, the sector, the society, cost & risk of decisions (Bonel, Bonel, & Fontaneda, 2003). An attempt to get the relation value-price (Pica, 2014), we consider models which relate: the customer emotions and desires to identify the attributes of products and services (Chaudhuri, 2006; Mejía-Trejo & Sánchez-Gutiérrez, 2013). One of the latest model, that involves clearly the value added aimed to the client, is the Business Model Generation created by Osterwalder & Pigneur (2010), with 9 stages to identify: customer segment; value proposition; channels; customer relationships; revenue streams; key resources; key activities; key partnerships and cost structure.
B.- (IIIT).-Innovation Income Items , or the igniting process, where is considered the early innovation, describing: opportunities, analysis, idea generation, idea selection and the concept definition (Gassmann et al., 2012). By the hand of the facilities for innovation we have: Shipp (2008) and Mckinsey (2008) defining the scope of Research & Development (R&D) staff and tangibles to support the innovation. As an intangible asset to the process of innovation we take the efforts to use and generate patents, create and improve databases, to improve the organizational processes through the knowledge and skills to increase their risk capabilities (Canibano et al., 1999; Howells, 2000; Lev, 2001; Shipp, 2008). The efforts to discover new market knowledge (Popadiuk & Wei-choo, 2006), is considered too.
C.- (INPROC).-Innovation Process or motor of the model. Take in account the concepts around actions to improve the existing processes of Research & Development + Innovation (Mckinsey, 2008; OECD, 2005; Shipp, 2008), studies about product lifecycle (Pica, 2014). The design is a special issue, and includes actions to improve the existing design (OECD, 2005) and the employee influence based on its own autonomy to make opinions and decisions (Nicolai et al., 2011). The open innovation concept is considered (Chesbrough et al., 2006) due to the chances to discover at the same time R&D and new markets. The results of innovation are around on prototypes and conceptual models that tend to improve the actual production process (Chesbrough et al., 2006; Mckinsey, 2008; OECD, 2005).
The diffusion of innovation (and very related with lifecycle products, Pica, 2014) is important for marketing due the prevision of obsolete products, the changes in the market, the early adopters, the early majority, the late majority and the laggards, described all above by mean of Rogers's Diffusion Innovation Model (1983). The onset and end of a technology is included as a market study that influences the innovation (Chesbrough et al., 2006).
D.- (IOIT).-Innovation Outcome Items , or qualification stage of innovation, which makes a revision of products and services obtained. It detects the projected level of revenues generated by innovation (Shipp, 2008), the projected customer satisfaction level generated by innovation (Mckinsey, 2008), the projected sales percentages levels generated by innovation (Lev, 2001), the level of the number of launches of new products/services in a period and the net present value of its portfolio of products/services in the market generated by the innovation (Mckinsey, 2008).
E.- (IPERF).-Innovation Performance or the quantification stage of innovation, makes different weightings about the results to determine different levels, such as Bermúdez-García (2010), proposes:
-. Triple Helix Politics = The relationship among university-government-industry (Smith & Leydesdorff, 2010), to develop a policy of innovation.
-. Generation Ideas Rate = Generated Ideas/Market Knowledge Opportunities × Total Contributors in the Process;
-. Opportunities Index for Collaborative Innovation = Innovation Identified Opportunities/Total Contributors in the Process
-. Effectiveness of Idea Generation = Number of Approved Ideas/Number of Generated Ideas
-. Implementing Effective Prototyping = Number of Correct and Timely Prototype Terminated/Total Prototyping Approved;
-. Cost-Benefit of Innovation = Innovation income/Investment in Innovation;
-. Innovation Generation Rate = Number of Generated Innovations/Identified Innovation Opportunities.
-. Index not Successful Innovations = Number of Unsuccessful Innovations Implemented/Total Innovation, or other similar to quantify the final results. And,
F.- (IFEED).- Innovation Feedback Items or alarm set of innovation stage, makes different analyses aimed to improve a particular subject versus their marginal profits. It involves: the intellectual capital dedicated to innovation (Lev, 2001; Nicolai et al., 2011; Shipp, 2008); the processes, the product/service, marketing, technology, organization: structure and functions, type of innovation (radical, incremental), (OECD, 2005), value added (Bonel et al., 2003; Osterwalder & Pigneur, 2010; Pica, 2014), and type of leadership (Gloet & Samson, 2013; Mejía-Trejo et al., 2013).
The Customer Knowledge Management (CKM)
CKM creates new knowledge sharing platforms and processes between companies and their customers (Garcia-Murillo & Annabi, 2002) The evidence indicates that is a potentially powerful competitive tool, contributing to improved success in both senses: companies and their customers. It is a continuous strategic process by which companies enable their customers to move from passive information sources and recipients of products and services to empowered knowledge partners (Gassmann et al., 2012). It incorporates principles of knowledge management and customer relationship management, but moves decisively beyond it to a higher level of mutual value creation and performance (Gibbert & Probst, 2002). Customer input has become a valuable component of the innovation process. The integration of customer knowledge into the early innovation phase requires special types of customers and methods and entails specific risks according to each stage (Gassmann et al., 2012). The notion that firms can improve their innovativeness involving users and customers for knowledge has become prominent in innovation studies. Specifically, Firms that attempt to leverage user and customer knowledge in the context of innovation must design an internal organization appropriate to support it (Nicolai et al., 2011).
To complement our proposed model with INNOV, we did a revision and analysis of literature review about authors and their works about CKM. Briefly, the results (by previous EFA or Exploratory Factorial Analysis ) are described in 4 variables:
G.- (CKMADI).- CKM as a Driver of Innovation (Gassmann et al., 2012), or how to handle the innovation where is considered the sense of information: for, from, about customer (Desouza et al., 2007; Garcia-Murillo & Annabi, 2002; Gibbert & Probst, 2002; Nambisan, 2002) and customer as a co-creator (Desouza et al., 2007; Gibbert & Probst, 2002; Nicolai et al., 2011) all of them, making prosumerism to get more interaction with the customer knowledge. Even more, the negative side effects of Customer Integration such as the warning of the Firm, respect of: customer's personality, experience, points of view, the likelihood to choose a wrong customer, and the risk to incorporate him into the relationship to the Firm (Gassmann et al., 2012; Nicolai et al., 2011) takes it at all into the model.
H.- (CKMS).-CKM as a Support , or basis of knowledge consists in knowledge incentives, respect of: the salary associated with the ability and willingness to share knowledge (Nicolai et al., 2011; OECD, 2003); it includes the salary determined by willingness to improve skills and upgrade knowledge; the tolerance to failure, rewards and recognition (Campeanu-Sonea, Sonea, & Mitra-Crisan, 2014; Gloet & Samson, 2013). By other hand, we considered the fact of how the knowledge flows, through exchange it between employees across departments, communication among employees and management.
I.- (CKMOSK).- CKM other Sources of Knowledge , or different sources of knowledge is a strategic tool, in the ICT as an infrastructure to support. CKM, is a powerful driver to boost the internal sources of knowledge from the environment (Laudon & Laudon, 2012; Mejía-Trejo & Sánchez-Gutiérrez, 2013), such as: technical services, engineering, R&D, production, marketing and sales and purchasing and supply, belonging to the Firm's departments (Garcia-Murillo & Annabi, 2002) and other employees. As a complement, we decided the introduction of the external sources of knowledge, that involves: suppliers, scientists, universities, patents, technology exhibitions, distributor agents, consultants (Garcia-Murillo & Annabi, 2002) and competitors.
J.- (CKMSEP).-CKM, Satisfaction, Experience And Performance or satisfaction with knowledge; one important issue that we considered essential to be determined, is the type of paradigm practiced by the Firm for CKM (Garcia-Murillo & Annabi, 2002). We found 3 paradigms to solve about satisfaction and experience: (a) If Only We Knew What We Know (KM) as a Customer Retention; (b) Retention is Cheaper than Acquisition (CRM) as a Customer Satisfaction; (c) If We Only Knew What Our Customer (CKM) Knows as a Customer Experience and Creativity. About performance, we determined 3 types: (a) Performance against budget and Customer retention rate. (b) Performance in terms of customer satisfaction and loyalty; (c) Performance against competitors in innovation and growth; Contribution to customer success (Garcia-Murillo & Annabi, 2002; Gibbert & Probst, 2002).
Finally, as a result of the documentary analysis we obtained Fig. 1.

Source: Own.
Fig. 1 General conceptual model. Notes: (A) Innovation Value Added (IVADD); (B) Innovation Income Items (IIIT); (C) Innovation Process (INPROC); (D) Innovation Outcome Items (IOIT); (E) Innovation Performance (IPERF); (F) Innovation Feedback Items (IFEED); (G) CKM as a Driver of Innovation (CKMADI); (H) CKM Support (CKMS); (I) CKM other Sources of Knowledge (CKMOSK); (J) CKM, Satisfaction, Experience And Performance (CKMSEP).
About the components belonging to CKM and INNOV our proposed conceptual model is showed through Table 1 (see Appendix) with 10 factors, 45 variables and 110 indicators, with Likert scale of 5 positions: 1 = strongly disagree, 3 = not agree/not disagree and 5 = complete agreement as limits
Table 1 Technical research data.
| Features | Survey |
|---|---|
| Universe | 680 companies in the SMEs from SSG belonging most of them to CANIETI; 500 answered: designers, manufacturers and suppliers |
| Scope | Local |
| Sample unit | SMEs from SSG over 15-20 employees |
| Collection method of data | Emails in collaboration with the CANIETI CEO members based in Guadalajara City |
| Scale | Likert 5 |
| Date of fieldwork | June-November 2014 |
Source: Own.
Hypotheses
As a consequence of the results mentioned above, we proposed the following hypotheses:
H1. A high level of CKMADI generates a high level of INNOV in the SSG.
H2. A high level of CKMS generates a high level of INNOV in the SSG.
H2. A high level of CKMOSK generates a high level of INNOV in the SSG.
H4. A high level of CKMSEP generates a high level of INNOV in the SSG.
Methodology
This is a research based on documentary studies, to design a conceptual model and questionnaire to get several groups of variables, factors and indicators that involves a relationship between CKM and INNOV process (an early model proposed by Mejía-Trejo et al., 2013), with: 6 variables/33 Factors/77 Indicators. The factors and indicators under study, are all from the CKM variable, as such: CKMADI = 9 Indicators in 5 Factors; CKMS = 7 Indicators in 3 Factors; CKMOSK = 11 Indicators in 2 Factors; CKMSEP = 6 Indicators in 2 Factors. The subjects of the study were the managers from 680 SMEs with 15-20 persons in the SME of the SSG; they were interviewed by mean the sending of email where 80 of them were eliminated because they were incomplete, and finally we received 500 questionnaires. Thus, we obtained a response rate of 74% and error rate below of 4%. It is noteworthy the intervention of CANIETI CEO members, based on Guadalajara City, which streamlined all the data collection. The results were analyzed through statistical inference tools like Structural Equations Model (SEM), to determine the underlying relationships amongst the variables in the model. All the items were measured on Likert scale with 5 degrees: 1 absolutely disagree and 5 absolutely agree. Table 1, summarizes the most relevant aspects of the research carried out.
Validity and reliability of the model
Initial conditions. About the validity of the measurement scales, it was used early Exploratory Factor Analysis (EFA) and in this document the Confirmatory Factor Analysis (CFA) by mean of the maximum likelihood method with EQS 6.1 software (Bentler & Wu, 2005; Brown, 2006; Byrne, 2006). Cronbach's Alpha and Composite Reliability Index (CRI) (Bagozzi & Yi, 1988), were used as a techniques to prove the reliability of the measurement scales. All scale values exceeded the recommended value of 0.7 for Cronbach's alpha and the Composite Rate Index (CRI), which indicates that there is evidence and justifies internal reliability of the scales (Hair, Black, & Babin, 2010). It represents the variance extracted from the group of the observed variables and the fundamental construct (Fornell & Larcker, 1981), particularly, values above 0.6 are desirable (Bagozzi & Yi, 1988). The settings used in this study were: the Normed Fit Index (NFI), the Non-Normed Fit Index (NNFI), the Comparative Fit Index (CFI) and the Root Mean Square Error of Approximation (RMSEA, Bentler, 1990; Bentler & Bonnet, 1980; Byrne, 2006; Chau, 1997; Hair et al., 2010; Heck, 1998). Values of NFI, NNFI and CFI between 0.80 and 0.89 represent a reasonable fit (Hair et al., 2010) and a value equal to or greater than 0.90 represents an evidence of a good fit of the theoretical model (Byrne, 2006). RMSEA values below 0.08 are acceptable (Hair et al., 2010).
The Results. The CFA results are presented in Table 2 and suggests that the model provides a good fit to the data [Satorra-Bentler Scaled Statistic (S-BX 2) = 218.061; df = 96; p = 0.000; NFI = 0.907; NNFI = 0.928; CFI = 0.938; RMSEA = 0.060]. Additionally, Cronbach's Alpha and the CRI > 0.70 are recommended by Hair et al. (2010) and the Rate of Variance Extracted (RVE) was calculated for each pair of constructs, resulting in an RVE > 0.50 (Fornell & Larcker, 1981). As evidence of convergent validity, the results pointed out that all of the CFA items factor related are significant (p < 0.001) and the magnitude of all the factorial charges is superior of 0.60 (Bagozzi & Yi, 1988).
Table 2 CFA results or internal consistency and convergent validity of the theoretical model.
| Factors | Item | Indicator | Factorial charge | t value | Cronbach's alpha | CRI | RVE |
|---|---|---|---|---|---|---|---|
| CKMADI | 1 | IFMC | 0.609*** | 1.000a | 0.774 | 0.779 | 0.505 |
| 2 | IABC | 0.710*** | 10.629 | ||||
| 3 | IWIC | 0.709*** | 10.401 | ||||
| 4 | NSEC2 | 0.729*** | 9.264 | ||||
| CKMS | 5 | KI1 | 0.701*** | 1.000a | 0.834 | 0.836 | 0.515 |
| 6 | KI2 | 0.748*** | 14.093 | ||||
| 7 | KF1 | 0.706*** | 10.040 | ||||
| 8 | KF2 | 0.740*** | 12.311 | ||||
| CKMOSK | 9 | ISOK3 | 0.741*** | 1.000a | 0.734 | 0.765 | 0.526 |
| 10 | ISOK5 | 0.678*** | 13.090 | ||||
| 11 | ESOK4 | 0.773*** | 14.048 | ||||
| CKMSEP | 12 | PAR1 | 0.780*** | 1.000a | 0.806 | 0.818 | 0.536 |
| 13 | PAR2 | 0.768*** | 14.250 | ||||
| 14 | PAR3 | 0.694*** | 11.500 | ||||
| 15 | PER2 | 0.710*** | 12.830 | ||||
Source: Own.
S-BX2 (df = 96) = 218.061, p<0.000); NFI= 0.907; NNFI= 0.928; CFI= 0.938; RMSEA= 0.060.
Note: the bold values, are the rate of variance extracted (RVE) and representing the diagonal showed in Table 3.
a Parameters constrained to the value in the identification process.
*** p<0.001.
According with the evidence from Table 2, discriminant measure is provided in two forms as we can see in Table 3. First, with a 95% interval of reliability, none of the individual elements of the latent factors correlation matrix contains 1.0 (Anderson & Gerbing, 1988). Second, extracted variance between the two constructs is greater than its corresponding RVE (Fornell & Larcker, 1981). Based on these criteria, we can conclude that the different measurements with the model show enough evidence of discriminant validity and reliability.
Table 3 Discriminant validity of the theoretical model.
| Factors | CKMADI | CKMS | CKMOSK | CKMSEP | |
|---|---|---|---|---|---|
| CKMADI | 0.505 | 0.137 | 0.181 | 0.141 | Chi square difference test (values < RVE) |
| CKMS | 0.280, 0.440 | 0.515 | 0.213 | 0.207 | |
| CKMOSK | 0.333, 0.521 | 0.366,0.558 | 0.526 | 0.287 | |
| CKMSEP | 0.305, 0.463 | 0.351, 0.539 | 0.431, 0.639 | 0.536 | |
| Interval confidence test (<1.0) | |||||
Source: Own.
Note: The diagonal represents the rate of variance extracted (RVE), while above the diagonal part presents the variance (the correlation squared). Below the diagonal, is an estimate of the correlation of factors with a confidence interval of 95%.
Results
To obtain the statistical results of the research hypotheses, we applied the SEM as a quantitative method with the same variables to check the structure model and to obtain the results that would allow the hypotheses posed, using the software EQS 6.1 (Bentler & Wu, 2005; Byrne, 2006; Brown, 2006). Furthermore, the nomological validity of the theoretical model was tested using the chi square , through which the theoretical model was compared with the adjusted model. The results indicate that no significant differences are good theoretical model in explaining the observed relationships between latent constructs (Anderson & Gerbing, 1988; Hatcher, 1994). Results of the application are presented in Table 4.
Table 4 Results of hypothesis testing of the theoretical model.
| Hypothesis | Structural relation |
β standardized coefficient <0.001 |
t value | The relationship has: |
|---|---|---|---|---|
| H1 - A high level of CKMADI generates a high level of INNOV in the SSG. | CKMADI → INNOV | 0.992*** | 11.552 | Significant positive effect |
| H2 - A high level of CKMS generates a high level of INNOV in the SSG. | CKMS → INNOV | 0.995*** | 13.759 | Significant positive effect |
| H3 - A high level of CKMOSK generates a high level of INNOV in the SSG. | CKMOSK → INNOV | 0.997*** | 14.903 | Significant positive effect |
| H4 - A high level of CKMSEP generates a high level of INNOV in the SSG. | CKMSEP → INNOV | 0.991*** | 11.258 | Significant positive effect |
Source: Own.
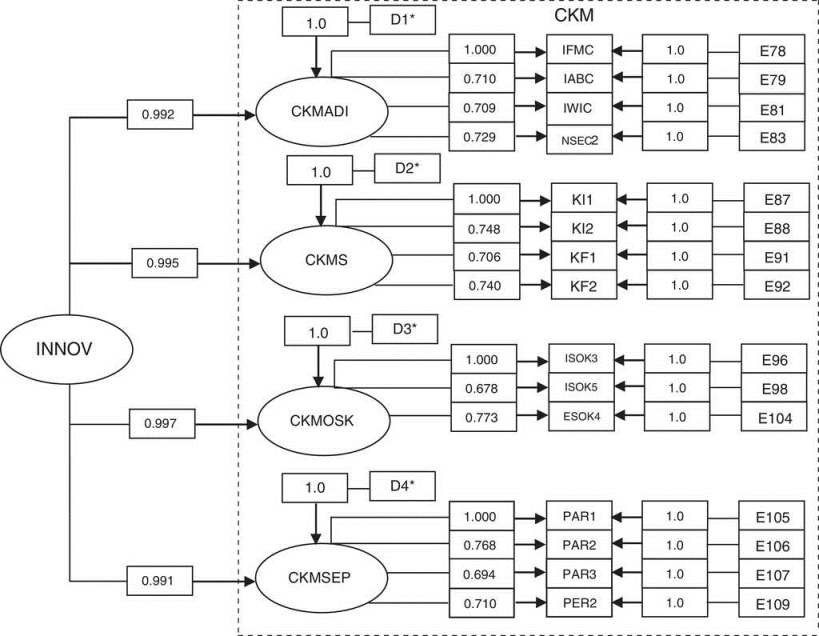
Summarizing, we can conclude that the 4 variables measuring CKM influenced by INNOV, are positive and significant and are very similar in terms of the value that each brings. See Fig. 2.
S-BX2 (df = 94) = 23.6169; p= 0.000; NFI= 0.910; NNFI= 0.921; CFI= 0.938; RMSEA= 0.078.
*** p<0.001.
Discussion and conclusions
This section is divided in 2 parts:
•. Firstly, we propose to solve our GQ, is 100% achieved: Which are the latent factors in CKM influenced by INNOV relationship? With the findings of 4 variables: CKMADI, CKMS, CKMOSK, CKMSEP involved into the CKM as determinant factors influenced by INNOV and showed in Fig. 1. About to solve SQ1, is 100% achieved: Which are the factors, variables and indicators of the general conceptual model? We determined from previous model INNOV: 6 factors/33 variables/77 Indicators related with our CKM: 4 factors/12 variables/33 indicators. Each of them, contained in a Final Questionnaire (located as Appendix). In the case of SQ2 is 100% achieved: Which are the relationships of the CKM latent factors influenced by INNOV? We applied SEM obtaining Tables 2-4 showing basically the significant positive effect of each latent factor: CKMADI, CKMS, CKMOSK, CKMSEP influenced by INNOV and solving at 100% achieved our Hypotheses H1: A high level of CKMADI generates a high level of INNOV in the SSG ; H2: A high level of CKMS generates a high level of INNOV in the SSG ; H3: A high level of CKMOSK generates a high level of INNOV in the SSG ; H4: A high level of CKMSEP generates a high level of INNOV in the SSG. About to solve SQ3, is 100% achieved: Which are the most relevant CKM latent indicators influenced by INNOV model? Since Table 2 we obtained 15 indicators, being PAR1: If Only We Knew What We Know (KM) as a Customer Retention the indicator with most factorial charge (0.780).
•. Secondly, how the latent factors are interacting? To answer this, we applied the SEM as a quantitative technique to obtain a model and analyze how the underlying variables are interacting amongst them, due the property of this technique to do, at the same time, multiple regressions in progress. We found that only 15/33 latent indicators of CKMS are influenced by INNOV process in SSG and we might to be thinking in how they are useful to increment the competitive advantage of all SMEs involved in CANIETI and Digital Creative City program. However, we need to do more studies to leverage the other 18/33 remaining latent indicators of CKMS on INNOV.
Final recommendations
Based on Fig. 2 we proposed 3 groups of recommendations for the SMEs located at the SSG, to increment their competitive advantages, such as:
a.1. Information from Costumer (IFMC) from CKMADI is taken as an important factor because the customer is a resource of new product development ideation; in fact is treated just as a Customer Driven-Innovation (or Innovation from Customers ) or Mutual Innovation (Desouza et al., 2007; Gibbert & Probst, 2002; Nambisan, 2002).
a.2. Information about the Customer (IABC) from CKMADI that means the use of the strategy in close collaboration with customers. It allows new concepts just like the communities of creation (Gibbert & Probst, 2002; Nambisan, 2002), most of them based on the Triple Helix relationship (Smith & Leydesdorff, 2010).
a.3. Information as a Customer Co-creator (with) (IWIC) from CKMADI where the customer is an active agent who helps over new product development design and process. There are several concepts created around it: Customer Centered Innovation (or Innovation with Customers ); Prosumerism (producer and consumer at the same time ); the Team-Based-CoLearning. Joint Intellectual Property (Desouza et al., 2007; Gibbert & Probst, 2002; Nicolai et al., 2011).
a.4. The firm is warned about the dependence on customer 's experience (NSEC2) from negative side effects of Customer Integration (NSEC) from CKMADI. In this case, the managers interviewed are only warned about the direct experience of the customer in new product development. However, they did not consider other additional key factors, such as: personality, point of view, the risk of the integration of the consumer or more than even, if it is a wrong consumer as a choice for the firm (Gassmann et al., 2012).
a.5. Salary associated with the ability and willingness to share knowledge (KI1) and Salary determined by willingness to improve skills and upgrade knowledge (KI2) from Knowledge Incentives (KI) (Nicolai et al., 2011; OECD, 2003). In this case, the managers appreciated these concepts, more than others such as: tolerance of failure (KI3) or rewards and recognition (KI4) (Gloet & Samson, 2013).
a.6. Exchange the knowledge between employees across departments (KF1) and Communication among employees and management (KF2) from Knowledge Fluence (KF) (Nicolai et al., 2011; OECD, 2003), from CKMS. These kind of values into the SSG are the most popular things among the Hitech environment.
a.7. Research and Design Development (ISOK3) and Marketing and Sales (ISOK5) from Internal Sources of Knowledge (ISOK) (Garcia-Murillo & Annabi, 2002), all of them are considered as strategic resources but ignores Technical Services (ISOK1) Engineering Department (ISOK2) Production (ISOK4) Purchasing and Supply (ISOK6) (Garcia-Murillo & Annabi, 2002) and Other Employees (ISOK7). It considers too, and Competitor (ESOK4) from External Sources of Knowledge (ESOK). All of them, from CKM others Sources of Knowledge (CKMOSK).
a.8. There are some statements that are shaping the mind of the customer and supplier: If Only We Know What We Knew (KM) as a Customer Retention (PAR1) by the way, with the most factorial charge in this study (0.780); Retention is Cheaper than Acquisition (CRM) as a Customer Satisfaction (PAR2); If We Only Knew What Our Customer (CKM) Know as a Customer Experience and Creativity (PAR3) from Paradigm (PAR). All of them being a part of CKMSEP (Garcia-Murillo & Annabi, 2002). CKM managers first and foremost focus on knowledge from the customer (i.e. knowledge residing in customers), rather than focusing on knowledge about the customer, as characteristic of customer relationship management. In other words, smart companies realize that corporate customers are more knowledgeable than one might think, and consequently seek knowledge through direct interaction with customers, in addition to seeking knowledge about customers from their sales representatives. Similarly, conventional knowledge managers typically focus only on trying to convert employees from egoistic knowledge hoarders into altruistic knowledge sharers In contrast, with CKM If only we knew what we know turns into if only we also knew what our customers know (Gibbert & Probst, 2002).
a.9. Performance in terms of Customer Satisfaction and Loyalty (PER2) from Performance (PER) of CKMSEP (Garcia-Murillo & Annabi, 2002; Gibbert & Probst, 2002). So, the metrics and tools to measure the implementing are very valuable.
a. Take advantage of the 15/33 latent indicators of CKMS, no matter the order of importance, because all of them are very strategical issues being these:
b. Take advantage of the 18/33 latent indicators of CKMS, but we need to do more studies to determine the scope of the influence of these strategic issues, because their levels, in this study were considered not representative.
c. Further studies in the future, would be determine by SEM each one of the INNOV latent factors that are related with CKMS and propose a tool to measure directly their relationships.
Source: Own.
Fig. 2 Hypothesized second-order factorial model of Customer Knowledge Management influenced by Innovation for SSG. Notes: E(n) - error disturbance; D(n) - variances of the disturbances. Because the estimation of all higher order factor loadings are typically of interest in second-order models, the variance of the single higher order factor (CKMS) has been constrained to 1.0; note also that the variances of the disturbances (the D's) are designated as freely estimated. Relatedly, their paths are automatically constrained to 1.0 by the program (Byrne, 2006).
Principal abbreviations
| Code | Meaning |
|---|---|
| CANIETI | Cámara Nacional de la Industria Electrónica de Telecomunicaciones y Tecnologías de la Información. |
| CEO | Chief Executive Officer. |
| CFA | Confirmatory Factorial Analysis. |
| CFI | Comparative Fit Index. |
| CKM | Customer Knowledge Management. More details, please see Appendix. |
| CKMADI | CKM as a Driver of Innovation. More details, please see Appendix. |
| CKMOSK | CKM other Sources of Knowledge. More details, please see Appendix. |
| CKMS | CKM as a Support. More details, please see Appendix. |
| CKMSEP | CKM, Satisfaction, Experience And Performance. More details, please see Appendix. |
| CRI | Cronbach's alpha and composite reliability index. |
| CRM | Customer Relationship Management |
| ESOK4 | Variable: External Sources of Knowledge (ESOK). Indicator: Competitor ESOK4. More details, please see Appendix. |
| F | Factor |
| GQ | General Question. |
| H(n) | Hypothesis (1), Hypothesis (2)...Hypothesis(n). |
| IABC | Information about the Customer. More details, please see Appendix. |
| ICT | Information and Communication Technologies. |
| IFEED | Innovation Feedback Items. More details, please see Appendix. |
| IFMC | Information from Costumer. More details, please see Appendix. |
| IIIT | Innovation Income Items More details, please see Appendix. |
| INNOV | Innovation. More details, please see Appendix. |
| INPROC | Innovation Process. More details, please see Appendix. |
| IOIT | Innovation Outcome Items. More details, please see Appendix. |
| ISOK3 | Research and Design Development. More details, please see Appendix. |
| ISOK5 | Internal Source of Knowledge: Indicator: Marketing and Sales. More details, please see Appendix. |
| IPERF | Innovation Performance. More details, please see Appendix |
| IVADD | Innovation Value Added. More details, please see Appendix. |
| IWIC | Information as a Customer Co-creator (with). More details, please see Appendix. |
| KF1 | Exchange the knowledge between employees across departments. More details, please see Appendix |
| KF2 | Communication among Employees and Management. More details, please see Appendix. |
| KI1 | Salary associated with the ability and willingness to share knowledge. More details, please see Appendix. |
| KI2 | Salary determined by willingness to improve skills and upgrade knowledge. More details. Please see Appendix. |
| NFI | Normed Fit Index. |
| NNFI | Non-Normed Fit Index. |
| NSEC2 | The firm is warned about the dependence on customer's experience. More details, please see Appendix. |
| PAR1 | If Only We Know What We Knew (KM) as a Customer Retention. More details, please see Appendix. |
| PAR2 | Retention is Cheaper than Acquisition (CRM) as a Customer Satisfaction. More details, please see Appendix. |
| PAR3 | If We Only Knew What Our Customer (CKM) Know as a Customer Experience and Creativity. More details, please see Appendix. |
| PER2 | Performance in terms of customer satisfaction and Loyalty. More details, please see Appendix. |
| RMSEA | Root Mean Square Error of Approximation. |
| RVE | Rate of Variance Extracted. |
| S-BX 2 | Satorra-Bentler Scaled Statistic. |
| SEM | Structural Equation Model. |
| SME | Small & Media Enterprises |
| SQ(n) | Specific Question1...Specific Question2...Specific Question. |
| SSG | Software Sector Guadalajara, Mexico. |
| t | t Value. |
Source: Own.


