text new page (beta)
 English (pdf)
 Article in xml format
 Article references
 Send this article by e-mail
 Cited by SciELO
  Similars in
SciELO
Similars in
SciELO 
 Permalink
Introduction
Precedents and theory have reaffirmed what has now become well established as the 'resource curse' a pattern that has seen resource-endowed countries becoming less wealthy and less governed than their resource-scarce counterparts. According to Auty (1993), the resource curse refers to the paradox that countries and regions with an abundance of natural resources, specifically point-source non-re-newable resources like minerals and oil tend to have less economic growth and worse political development outcomes than countries with fewer natural resources. The critical question that comes to the fore then is, why is this the case? Why have resource rents fail to sustain economies? Is it a question of poor macroeconomic policies or misdirected policies and incentives? Or is it because of rent-seeking due to weak state institutions.
To answer these questions, the empirical analysis that natural resources are negatively correlated with economic growth, has been reconciled with the observation that there have been varying outcomes across countries (Auty, 1986; 1993; 2001, Sachs and Warner, 1995a; 1997 a, b; 2001). The other group of scholars argue that the effect of resources is not determined by resource endowment alone, but instead hinge upon the quality of a country's institutions (Iimi, 2006; Soto and Haouas, 2012; Erling, 2006; Rosser, 2007). Yet, other scholars have suggested that, it may result due to sensitivity of sample period chosen, methodology used and definition of natural resources (Stijns, 2005) or by a spurious regression led by omitting a variable (Ross, 2003).
Botswana is among the countries that have defied the resource curse (Iimi, 2006), and have experienced economic growth which is strongly influenced by mineral resources, particularly diamonds, as they experienced a significant growth in terms of quantity and value (Figure 1 and Figure 2). The country graduated from being among the poorest in Africa at the time of independence in 1966 to an upper middle-income country within a period of three decades with an annual growth of 8.4% (Siphambe et al., 2005). On the contrary, other natural resource endowed countries (Venezuela, Mexico, Nigeria, to name just a few) are experiencing lower economic growth performance. Recent evidence by Satti et al. (2014) suggested that, resource abundance hinders economic growth of Venezuela. Their study employed autoregressive distributed lag (ARDL) bounds testing approach for a sample period of 1971 to 2011 and found that financial development stimulates economic growth rather than the resource abundance. Similarly, Usui (1997) compared Dutch disease problem between Mexico and Indonesia, discussing policy options adopted during the course of oil boom in both countries. The study found that Indonesia implemented sound economic policies (fiscal, external borrowing and exchange-rate) to avoid the outcomes of Dutch disease and prosper in its economic growth, while Mexico failed to benefit from its resources. In the context of Nigeria Dutch disease was diagnosed, albeit, as a delayed occurrence (Olusi and Olagunju, 2005). Hamdi and Sbia (2013) investigated the dynamic relationship between oil revenue, government spending and economic growth in Bahrain and found out that oil revenues remain the main source for economic growth and financing government spending. Sahoo et al. (2014) analysed the dynamic relationship among mineral export, economic growth and industrial production in India using VAR approach and showed that mining export has less contribution to industrial production in the short-run while contributing a significant share in the long-run. Most significant, literature shows the direct and indirect impacts of natural resources endowments on economic growth, and this recognises the need for more research.
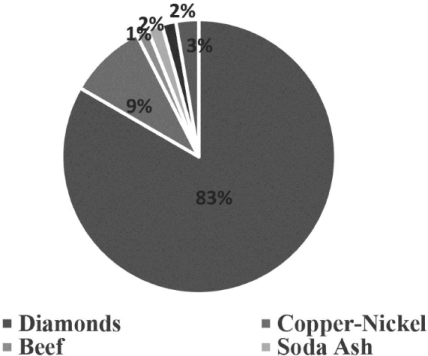
Source: Bank of Botswana Statistics annual report (2004, 2012).
Fig. 1 Composition of mineral export, 2012.
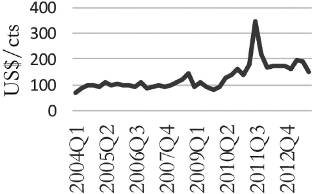
Source: http://kimberleyprocessstatistics.org (2014).
Fig. 2 Rough diamond price in US$ per carat for Botswana.
Although Botswana is hailed as an African miracle (Samatar, 1999) and a significant exception of how the natural resource curse must not be the fate of resource endowed economies (Sarraf and Jiwanji, 2001), the debate is not settled. Iimi (2006) has empirically analysed the impact of mineral resources in Botswana economic growth and suggested that the country benefitted from coexistence of good governance and abundant diamonds to materialise economic growth and deviate from the curse. Furthermore, Auty (2001) pointed out that Botswana has experienced success due to coherent economic policy that resulted in a rise in social welfare and concluded that despite the success it is still premature to judge Botswana wholly successful. On the contrary, other studies have proposed that Botswana had as suffered from a mild form of the Dutch disease because of high unemployment at the start of its diamonds boom (Mogotsi, 2002). The study found a positive relationship between government recurrent spending and real effective exchange rate appreciation during the boom but not during the pre- and post-boom periods and concluded that this causes difficulties in reducing government recurrent expenditure post-boom. This suggestion correlates with Love (1994) observation that mineral abundance, particularly diamonds, affected agriculture through a rise in the local currency (Pula) against South African currency (Rand) because of mineral boom and rapid growth of government spending. Moving somewhat away from the debate, the 2008/09 global financial turmoil resulted in a slowdown of economic activities in Botswana, indicating the vulnerability of the economy to global economy tremor. Real GDP plummeted 6%, employment in mining and quarrying fell by 9.3%, diamond mines closed their operation for three months in the course of 2009 and these measures were unprecedented in the history of Botswana economy (Magang, 2015).
These observations raised some questions with concern to the key role played by the mining revenue in financing government consumption and improving lives of Botswana society, hence it necessitates an empirical investigation. As a result we applied unrestricted autoregressive model technique to investigate the dynamic relationship between mining revenue, government consumption, exchange rate and economic growth of Botswana. Overall and consistent with the literature, the mining sector has an important role in the Botswana economy with much influence on government consumption and economic growth.
The rest of this paper is organized as follows: Section 2 introduces methodology and model specification. Section 3 presents empirical results. Section 4 presents the discussion. The paper is concluded in section 5.
Methodology and model specification
Data
The quarterly time series data on mining revenue, real GDP, exchange rate and government consumption have been used in this study (Figure 3). Data were drawn from Bank of Botswana Statistics annual reports (2004 and 2012) with an observation span from 1994-2012. Mining revenue, government consumption and real GDP are at a constant 2006 base price and exchange-rate is the nominal effective exchange rate of the local currency (Pula) against the US dollar. The first variable is mining revenues which are rents from diamonds (making up 83% percent of the exports), copper-nickel (9%), and soda ash (2%) in real terms. These rents are a primary source of government income. Therefore, there is a likelihood of the government consumption to increase as the mining revenue increases because government plays a central role in the absorption of the rents. This scenario can result in budget deficit once mining revenue declines.
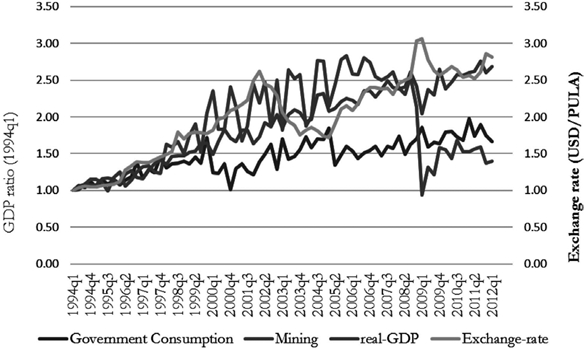
Source: Bank of Botswana Statistics annual reports (2004, 2012).
Fig. 3 The trajectory of mining revenue, government consumption, exchange rate and GDP growth from 1994-2012.
The second variable is government final consumption constituting of local and central government consumption in GDP by type of expenditure in 2006 base price. The government consumption includes all government expenditures for purchases of goods and services including compensation of employees. The Botswana government's total consumption doubled every 6 years over the 1973-1997 period (Auty, 2001). Therefore, it is important to examine its relationship with mining revenue and economic growth. The third variable is nominal effective exchange rate of pula against the US dollar. The fourth variable is economic growth and it is proxied by real gross domestic product. All the variables are in real local currency, seasonally adjusted and converted into natural logarithms for the present analysis. The variable specifications are as follows:
Test of stationarity
Checking the data properties is the prerequisite for any empirical analysis in time series data. Augmented Dickey and Fuller (ADF) (1981) and Phillips and Perron (PP) (1988) procedures were used to check the properties of the data. ADF corrects for higher order serial correlation by using lagged differenced term as an explanatory variable. While PP is used to confirm the stationarity of the variables hence an alternative to ADF procedure. Moreover PP procedure controls for heteroskedasticity and serial correlation of the error term. Following is cointegration test based on the Johansen approach (1988), consisting of two statistical tests, namely the trace test and the Max-Eigen value test. The purpose of this is to test for the long-term and short-term relationship among variables.
VAR model specification
We applied unrestricted vector autoregressive (VAR) model to examine the relationship between mining revenue, government consumption, exchange rate and real GDP growth. This technique was popularized by Sims (1980). The VAR model provides a multivariate framework where changes in a particular variable are related to changes in its own lags and the lags of other variables. This is a reduced-form of VAR since the dependent variable is expressed in terms of predetermined lagged variables. The advantage of VAR approach is that unknown relationships between variables are considered as endogenous in the system as the variables relationship is simultaneously determined. The VAR model could be simplified as follows:

Where yt is a vector of endogenous variables, β is an intercept, z is a vector of exogenous variables, A1 and B are coefficient matrices, P is the lag length and ¿1 is an unobservable zero-mean white noise. For an unrestricted VAR model, vectors of endogenous variables are arranged according to Cholesky decomposition. In this sequence, the variables that appear first are considered more exogenous while those appearing last are considered endogenous. In this context, mining revenue is the most exogenous variable, with the global markets largely determining the production and the prices. The mining revenue is followed by exchange rate, government consumption and real-GDP.
Impulse response function (IRF) and variance decomposition (VD)
In a VAR model, coefficients cannot be interpreted directly but rather innovation accounting techniques are adopted to interpret the results and these are impulse response function (IRF) and variance decomposition (VD). These techniques examine the impact of each variable on other variables in the system. The IRF determines the dynamic effect of each variable to shocks of others in the system, while the VD show the contribution of the variance in the forecast error for each variable to shocks to all variables in the system (Enders, 1995). This was followed by VAR Granger causality, both pairwise and multivariate to check the direction of causality (Granger, 1969).
Empirical results
In time series analysis verification of the time series properties of data is necessary before any further analysis. The results of the stationarity test using Augmented Dickey Fuller (ADF) and Phillips and Perron (PP) are presented in Table 1. The null hypothesis of both tests (ADF and PP) is non-stationary against the alternative hypothesis of a stationary variable except for government consumption (LGov-Con). However, the results of ADF and PP tests are stationary at their first difference. Hence, variables are concluded to be integrate of order 1, technically known as I (1) process.
Table 1 Unit root results.
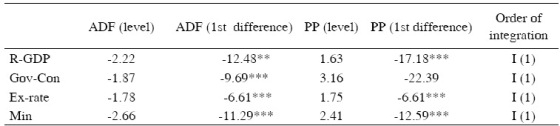
***Indicate rejection of the null hypothesis of non-station<ry of the variables at 5% significance level.
Proper lag selection is important for VAR specified type of analysis. Therefore, lag order selection criteria such as sequential modified LR test statistic (LR), Akaike information criterion (AIC), Hannan-Quinn information criterion (HQC), Final prediction error (FPE) and Schwarz information criterion (SC) were used. The results details are presented in Table 2 and majority of lag selection criteria identified the optimum lag of 3. Although LR, FPE and AIC suggest the optimum lag to be 3, SC and HQ criteria suggest lag 1. Based on majority view we have selected lag 3 for further analysis.
Table 2 Lag selection for Johansen cointegration test.

*Indicates lag order selected by the criterion at 5% significance level.
Johansen cointegration test consisting of trace and maximum-eigenvalue statistical tests was used to examine cointegrating relationship for economic growth, government consumption, exchange rate and mining. The results from both tests show that there is no cointegrating relationship among variables (Table 3). The absence of cointegration enables us to use vector autoregressive approach to investigate impulse response function, variance decomposition and granger causality relationship among variables.
Table 3 Johansen Cointegration test results.

Trace test and Maximum-Eigenvalue statistics indicate no cointegration at 5% level.
**Denotes rejection of the hypothesis at the 5% level.
**MacKinnon-Haug-Michelis (1999) p-values.
Cointegration test is followed by lag length selection for VAR analysis, a procedure necessary to estimate the appropriate VAR model. The lag length selection has been based upon the Akaike information criterion (AIC), Hannan-Quinn information criterion (HQC) and Final prediction error (FPE) and the results are presented in Table 4. AIC, HQC and FPE suggest for lag 2, whereas sequential modified LR test suggests for lag 4 and Schwarz information criterion (SIC) suggests for lag 0. Therefore, based on the results lag 2 has been selected to further estimate impulse response function, variance decomposition and VAR Granger Causality.

Discussion
Impulse Response Function test results
Impulse response functions results are presented in Figure A1 (see Appendix). The first row shows the response of mining revenue to shocks in exchange-rate, government consumption and real-GDP. Mining revenue was found to respond negatively to a shock in exchange rate from the first to the second quarter and positively in the third quarter, then the impact disappears. However, government consumption responds negatively in the first quarter and positively in the third quarter to shocks in mining revenue for the same period. The second row of Figure A1 (see Appendix) shows the responses of exchange rate to shocks in mining revenue, government consumption, and real-GDP. The exchange rate responds positively from the first to the third quarter to shocks in mining revenue and the impact disappears. These test results suggests that mining revenue resulted in appreciation of currency even though it is for a short run, while for government consumption and real-GDP the impact is negatively small and disappears after the fourth quarter. The third row in the same figure shows the response of government consumption to shocks in exchange rate, mining revenue and economic growth. Government consumption respond negatively in the first quarter, positively in the second and third quarter and the positive, negative pattern continues until the tenth quarter. The fourth row shows the response of economic growth to shocks in mining revenue, government consumption and exchange rate. The impulse response function suggests that mining revenue shock leads to positive response in the first quarter and negative in the second quarter, the pattern continues until the tenth quarter. The impact of government consumption on economic growth is positive in the first quarter, negative in the second quarter and the pattern continues until the last quarter.
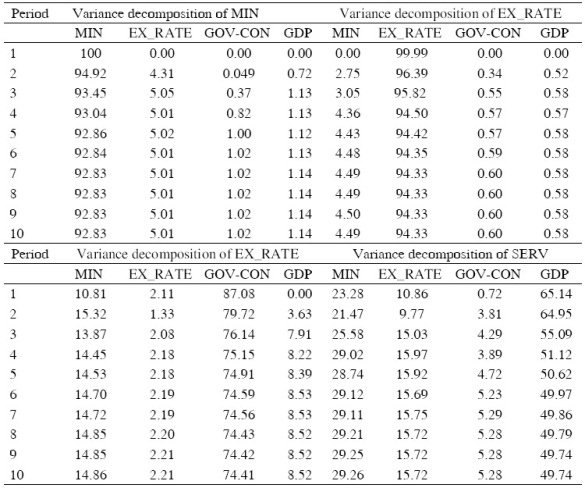
Variance decomposition
The results of variance decompositions are presented in Table A1 (see Appendix). The variance decomposition of mining revenue shows that mining revenue is largely explained by its own shock followed by exchange rate and very less by government consumption and real-GDP. In the initial period mining revenue 100% explains its variation, the explanatory power decline until the 10 steps ahead of time horizon, in which 92.8% of variance is explained by its own shock followed by 5.0% of exchange rate and 1.0% and 1.14% of government consumption and economic growth respectively. Exchange-rate also largely explains its own variation with 94.3% at the 10 steps ahead of time horizon, whereas mining revenue holds 4.5% of the variation and government consumption and economic growth explain as little as 0.6% and 0.58% respectively.
The results of variance decomposition of government consumption suggest that in 1 step ahead of time horizon, it is largely explained by itself and mining revenue by 87.1% and 10.8% respectively. The explanatory power of government consumption decline to 74.4% by the 10 steps ahead of time horizon while that of mining revenue increase to 14.9%. The variance decomposition of economic growth is largely explained by itself with 65.1%, followed by mining revenue with 23.3%, exchange-rate with 10.9% and government consumption with 0.72% in the 1 step ahead of time horizon. The explanatory power of economic growth on itself goes on declining while other variables gain more explanatory power, with mining revenue explaining 29.2% of economic growth variation by the 10 step ahead of time horizon and exchange-rate explaining 15.7%. This suggests that mining revenue contributes significantly to the economic growth in the long run as compared to the short run.
VAR Granger Causality
VAR Granger causality results are presented in Table 5. The VAR Granger Causality indicates that mining revenue and real-GDP granger causes government consumption and this is consistent with the findings for variance decomposition. Moreover, mining revenue and exchange rate granger cause real-GDP and this is also consistent with the findings for variance decomposition. Pairwise Granger Causality tests showed that mining revenue granger cause real-GDP thus a unidirectional causality running from mining revenue to real-GDP (Table B) in the appendix.

The test results indicate that mining revenue plays an important role in the economic growth and government consumption in Botswana. The results are supported by Auty (2001) and World Bank (2000b) mentioning that the government of Botswana used much of mineral rents on total consumption, which doubled in every 6 years from 1976-97. This shows how the economic well-being of the country is exposed to global economic tremors. To note, this is what happened in the 2008/09 global economic melt-down that began in the West and cascaded down to the rest of the world. The turmoil raised serious concerns among policy makers because of its adverse impacts. Decline in mining revenue impacts on the macroeconomic of government spending and economic growth resulting in low economic growth and budget deficit. Similar observations were made in the case of Bahrain, an oil rich economy exposed to oil shocks since its government expenditure and oil revenue have a significant long-run relationship (Hamdi and Sbia, 2013). Our study indicates that monoculture economies are open to the challenges of global economic shocks. Nevertheless, the present study results also indicate that mining revenue did not result in appreciation of Botswana currency (Pula) in the long-run and this is supported by (Auty, 2001) that even when the country's terms of trade improved during the 1990's, the exchange rate remained stable. This is a lesson for other resource-dependent economies to avoid exchange rate appreciation as it may harm other sectors in the economy. Hence this study highlights that economies can depend on the mining industry but it is necessary to diversify the economy to cushion tremor during global economic shock.
Conclusion
This study presented the empirical investigation of the dynamic relationship between mining revenue, economic growth, government consumption and exchange rate in the economy of Botswana. We applied unrestricted vector autoregressive approach consisting of impulse response functions, variance decomposition and VAR granger causality approach to examine the direction of causal relationship. The results indicates that mining revenue has an impact on economic growth and government consumption, hence, its importance to Botswana economy and well-being. It is important to note that reliance on mineral revenue may trigger macro-economic imbalances marked by abrupt demand cuts and sheer falls in output and growth leading to stagnation of the economy. Therefore 2008/09 global financial crisis should be taken as an alarm to remind the government of Botswana to focus on facilitating export diversification to ensure long-term sustainability of economic growth and development. Until this will have been realised there will be no guarantee that Botswana has truly defied the curse.
Acknowledgement: We would like to thank anonymous reviewers of this journal for their constructive comments and appreciated suggestions. Moreover, we are much thankful to Akita University for financial support.