text new page (beta)
 English (pdf)
 Article in xml format
 Article references
 Send this article by e-mail
 Cited by SciELO
  Similars in
SciELO
Similars in
SciELO 
 Permalink
Introduction
The aim of this paper is to examine the patterns of knowledge flow from industrialized economies to a selection of emerging countries from Latin America and Asia in the pharmaceutical industry, using patent citation as an indicator of technological flow. The flow of technological knowledge in the pharmaceutical industry from the United States, the European Union and Japan to China, India, Korea, Argentina, Brazil and Mexico was specifically studied.1 The study was based on the patent citation analysis made by the United States Patent and Trademark Office (USPTO) regarding patents granted to these emerging countries from Latin America and Asia. The second section outlines the theoretical approach and existing empirical evidence. The third section discusses information sources, while the fourth section presents the model and outcomes, as well as the main conclusions.
The analysis of patent citations as an indicator of technological diffusion
Recent studies on patent citation have veered towards two reflection and evaluation linchpins: the first is concerned with measuring the quality of innovation, whereas the second one is geared toward diffusion, spillover and the geographic localization of technological knowledge. The influence of one patent on another has been used as a proxy for its value and importance.
Regarding the diffusion of technological information contained in patents and their respective externalities, a growing output of economic and business research was found, based on the analysis of patent citations (Hall, Jaffe and Trajtenberg, 2001b; Duguet and MacGarvie, 2003). Likewise, other studies have used patent citation as an indicator of knowledge flow from technologically advanced economies to developing countries (Hall. et al., 2001a; Hu and Jaffe, 2003). Patent citation represents a link with previous innovations or pre-existing knowledge. In this sense, patent citation indicates that an inventor or inventor team has made use of knowledge contained in the cited patent for the development of a new patent (Criscuolo, Narula and Verspagen, 2001).2 The phenomenon of the influence of a patent on another patent has drawn attention to the study of knowledge flow. This analytical approach of backward and forward citations has been used as a measure of knowledge flow. On the one hand, backward citations have been used to measure the technological knowledge acquired by the patented entities studied (Hall, Jaffe and Trajtenberg, 2001b; Jaffe and Trajtenberg, 2002). On the other, forward citations refer to the citations that a patent obtains from other patents, which have been interpreted as a measure of the diffused knowledge from other countries to the patented entity (Ibid.).
Because not all the inventions are patented and not all knowledge flows are captured by citations, backward patent citation has been broadly discussed by Jaffe (1986) as an indicator of knowledge flow. Indeed, the measurement of technological flow through the analysis of patent citation has certain limitations due to the fact that the inclusion of a given citation in a patent application does not necessarily assure that the inventor possesses knowledge about the technology included in the cited patent. That is to say, the codified knowledge that is reported as a source of new knowledge, through patent citation, does not allow for inferences regarding the learning of tacit knowledge, neither by imitation nor by inverse engineering, or by another knowledge transfer (Duguet and MacGarvie, 2003). Besides, not all knowledge flows are necessarily captured by inventor citations since examiners add citations, too.3 Examiner-added citations are not a precise reflection of knowledge flow.4 In this sense, the analysis of geographic sources of knowledge spillovers becomes a source of noise. Nevertheless, since 2001 USPTO patent data make it possible to identify the citation patent made by the inventor or added by the examiner (Thompson, 2006).5 It is thus possible for the citation path of inventors and examiners to differ. So, although patent citations are an imperfect measurement of knowledge flow, they do have an abundance of useful information characterized by high internationalization, which is indicative of the way knowledge is spread among geographic and technological regions in time.
In order to find evidence concerning communication among the inventors of both new patents and the cited patent, Jaffe, Trajtenberg and Fogarty (2000) carried out a survey on these two segments of inventors and found that communication was not significant. Nevertheless, there exists a significant correlation among citations received for patents and the perception of inventors concerning the importance of the patents.
A very novel aspect in the analysis of patent citation is geographic localization, which implies that a region or country uses knowledge created in other regions or countries (Jaffe, Henderson and Trajtenberg, 1993). Studies of this type allow for the identification of the participation of countries in technological flow, overcoming the tendency to study knowledge spillovers among the agents in the local environment. Criscuolo (2002) outlined that filial companies can represent a source of technological knowledge for their headquarters whenever their activities are directed to knowledge generation and enjoy access to these innovations. Transnational corporations have advantages in learning when acting as a channel for knowledge transmission developed thoroughly in the country of origin. Technological knowledge can be spread more easily and quickly in the country of origin, where the multinational is at the center of a dense network of consumers, competitors, research institutes and universities, etc. From the same research approach, Globerman, Kokko and Sjoholm (2000) analyze this type of knowledge spillover among multinational corporations, using data from patent citations.
In spite of skepticism regarding the capacity to measure this phenomenon,6 in a pioneering study Jaffe, Trajtenberg and Henderson (2000) demonstrated the statistical importance of the geographic localization of technological dissemination through the study of information from patent citations. Likewise, these authors lay the foundations for knowledge spillovers, which can be empirically traced in the geographic environment and in other dimensions such as time. Coe and Helpman (1995) interpreted the positive effects of high intensity trade on research and development (R&D) goods among countries experiencing an increase in productivity as evidence of dissemination of international knowledge. Nevertheless, in this kind of study differences between knowledge diffusion and technology diffusion are not clear and, accordingly, there is no clarity regarding the effects of pure knowledge flow and the effects of technology flow incorporated in advanced capital goods from one country to another (Jaffe and Trajtenberg, 2002).
It is interesting to observe how technological influence remains in the same geographic area when there are similarities in time and technological trends. Localization tends to vanish as time advances, and as geographic differences in the citation rate diminish.7 Geographic proximity may be an initial advantage in terms of knowledge transmission and may be an incentive to developing new knowledge. But such an advantage disappears with time. Other aspects related to geographic patterns of localization are the differences in technological dissemination flow among countries, as well as the trends in certain countries to only cite recent patents (Jaffe and Trajtenberg, 2002).
According to these authors, localization and its disappearance are phenomena derived from the relationship between two inventions or inventors. This relative phenomenon is linked to: i) an inventor's (or an inventor group's) abilities to learn and to implement other ideas with agility, and ii) another inventor's or inventors' abilities to disseminate the implications of their research which can produce more profitable research which systematically stimulates others; iii) the probability that a particular group can benefit from another group (and from changes over time) is determined jointly by the properties of each group and the relationship properties between both groups; and iv) the obsolescence of technology.
Although the probability that a given inventor can know a given antecedent augments as backward citation increases, on average the probability that the antecedent can be useful decreases. The combination of the processes of diffusion and obsolescence may be the cause of the probability of initially using a given antecedent and for it to fall into disuse as time goes by.
Knowledge flow through patent citations
In this piece of research, we seek to verify the validity of the hypothesis outlined by Jaffe and Trajtenberg (2002) in the sense that technology follows a diffusion process in geographic, institutional and technological environments. Therefore, researchers who are close to these dimensions could probably benefit in the short term from the innovation of the antecedent. In this context, the question is posed regarding the probability that certain researchers or scientists from emerging countries in Latin America (Argentina, Brazil, Mexico) and Asia (Korea, China, India) actually benefit from previous innovative research originating in industrialized countries (United States, Japan and countries of the European Union), affected by time, geographic localization, institutional frameworks and technological nature of each one and by the mutual relationship among each one of these dimensions. However, the localization effect will tend to vanish with time, in such a way that the probability that a preceding patent benefit from a remote patent is lower than the probability that it will benefit from a more recent patent. The USPTO patent database also recognizes a search through the WIPO International Patent Classification. Although there is an equivalence code between both, if a piece of research is based on a USPTO database, the USPTO classification is used.
Data Source
The USPTO patent database was used with the purpose of facilitating comparison and removing any internal bias in the citations made by inventors. The patents consulted in this piece of research come from USPTO class 514 and/or 424 for the period 1978-2004. Class 514 corresponds to Medication and compounds for the treatment of biological and corporal infections , while class 424 belongs to Drugs, bioaffecting and body treating composition .
The countries considered to be emerging economies, receivers of technological flows are: China, India, Korea, Argentina, Brazil and Mexico. The industrialized countries, the source of technological knowledge, are the United States and Japan, as well as France, Germany and the United Kingdom, from the European Union. Among the emerging countries, there are important contrasts regarding economic growth and, particularly, the dynamism of the pharmaceutical sector. The selected industrialized countries are characterized as the main generators of new molecules and pharmaceutical processes.
Methodology and Results
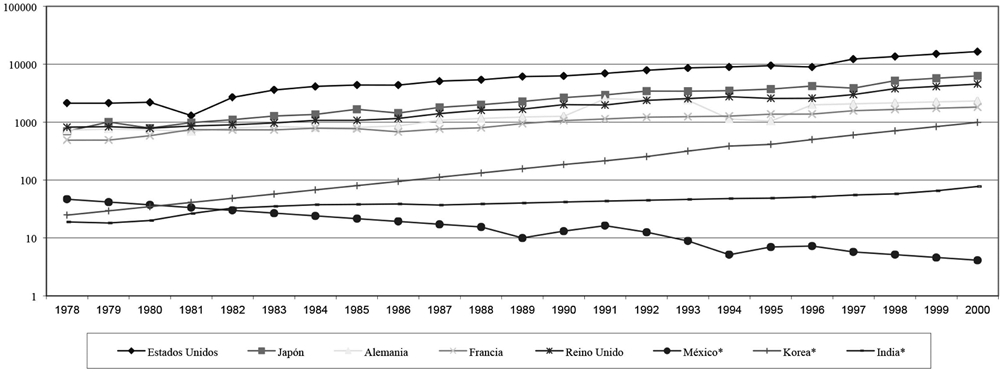
Patents are an expression of the capacity to create new "molecules" or "salts" as well as new pharmaceutical processes. In addition, there is an enormous gap between patents generated by industrialized countries and those generated in developing countries. The number of patents substantially increased after 1987 due to reforms made on patent laws of the GATT/WTO member countries. The United States maintained extensive leadership in pharmaceutical inventive activity over other industrialized countries during the whole period studied. In a second tier, significantly distant from the United States but with significance regarding their level of patents, are some European countries (Germany, France, United Kingdom) considered in this study, as well as Japan. The GDP generated by the American industry considerably surpasses that of other industrialized countries and more so the GDP generated by emerging countries such as Korea, India, Argentina, Brazil and Mexico.
Among developing countries and the so-called emerging nations, there are some that also have patents and have witnessed growth, especially after 1987. Nonetheless, some of these countries only reported patents to the USPTO during the nineties, particularly during the second half of that decade. In Latin American countries, such as Mexico, Brazil and Argentina, their inventive activity takes place prior to that of East Asian countries, such as Korea, India and China. However, in the latter, inventive activity was more dynamic and was expressed in an important increase in the number of patents between 1987 and 2003. Korea's patents grew exponentially, especially as of 1995, achieving around 60 patents in 2003. India also registered an exponential growth, surpassing the number of yearly patents registered by Korea, reaching 74 patents in 2003. China also showed a sudden and significant increase in its inventive activity within the pharmaceutical sector, especially since the beginning of the 21st century. The increasing inventive activity of the three Asian countries contrasts with that of the three Latin American countries, which registered a much lower inventive activity.
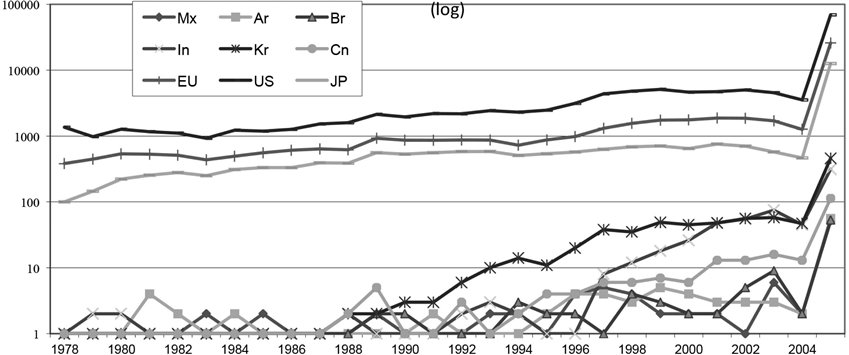
Source: USPTO classification 514 and/or 424.
Fig. 1 Patents of Industrialized and Asian and Latin American Emerging Countries in Pharmaceutical, Granted by USPTO 1978-2004 (log).
Patent citations reveal the sources of technological knowledge. A greater number of consulted citations show the ability of inventors to access a vast field of technological knowledge. The number of patent citations is considerably greater in Korea and tends to grow as the number of patents increases, particularly since the beginning of the 90s. The patent citation average in Korea varies from 4 to 6 citations, although for some years this average has been higher. India also reports a significant number of patent citations, but it is lower than in Korea. In India, patent citation has acquired importance, especially after 1998. The patent citation average per patent is 5.3 and resembles more the Korean average (5.5). In China, although it has less inventive activity and fewer patent citations than Korea and India, its average patent citation is higher (7.9). The reference to other patents for the development of new knowledge in China did not gain relevance until the end of the 90s, yet it underwent steady development. With respect to Latin American countries, Argentina and Mexico can be seen to report a citation average per patent very similar to that of Korea and India, and, in the case of Brazil, it exceeds that of China. The performance of this indicator is very erratic, which is related to a lower increase in its patents. Out of these three Latin American countries, Argentina showed a more stable average during the observed period.
Table 1 Patents Assigned to Emerging Countries in the Pharmaceutical Sector and their Backward Patent Citation.

Source: USPTO classes 514 and/or 424.
In the case of the three Latin American countries, technological knowledge to generate patented novelties in the pharmaceutical sector comes essentially from the United States (See Table 2 in the case of pharmaceutical firms holders patents cited). In a secondary way, the European Union has technological influence on Brazil and Mexico, and it is Japan that has technological influence on Argentina. Particularly, in the case of Mexico, if the geographic origin of cited patents is analyzed yearly, the participation index can be seen to be 62.96 percent, denoting the high degree in which the United States is a source of technological knowledge, except for a few years.
Table 2 Firms Holders of USPTO Patents Most Cited by Emerging Countries.

Source: USPTO classification 514 and/or 424.
For its part, Korea has shown greater diversification in the geographic origin of its sources of technological knowledge. The influence of the United States is represented by 38.60 percent, whereas the European Union and Japan together account for a third of the cited patents. Other countries account for a fifth. As a result, the indexes of participation of Triad countries are more diversified and do not tend towards 100 percent. Furthermore, China also demonstrates a diversification of sources of knowledge, but, contrary to Korea, 11 percent comes from its own country and 22.51 percent from Japan. In the case of India, there are a greater number of patent citations that come from the United States and Europe than from Korea. In the three cases, the United States has greater influence on knowledge used as a basis for generating patents.
Results of Measuring Citation Frequency 8
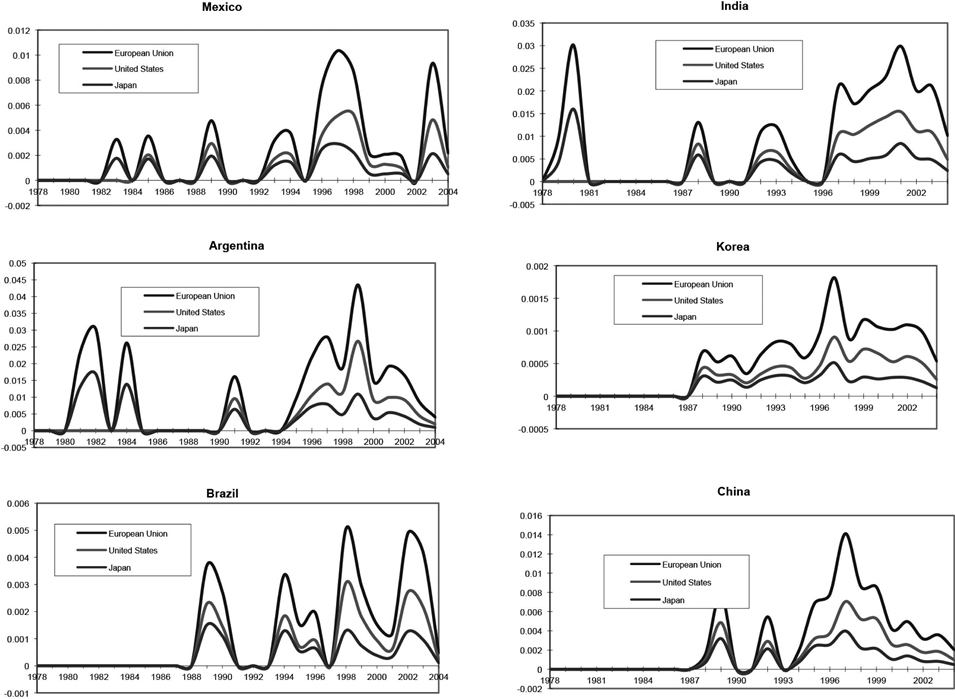
With regard to the measurement of the intensity of knowledge flows from industrialized countries toward the selected emerging countries, expressed as the probability that any inventor in an emerging country cite an invention created in industrialized countries, three situations can be observed: i) when citation probability does not exist because the country did not register a patent that year; ii) citation probability is 0 when the emerging country patented but it did not cite the patent of the industrialized country; and iii) a citation probability greater than 0 indicates that there are knowledge flows that come from the selected industrialized countries.
As aforementioned, most countries did not have patent registration or citation until 1987. This year was particularly important since it marks the adoption of the Agreement on Trade-Related Aspects of Intellectual Property Rights (TRIPs), including a 20-year period in the validity of patents in the General Agreement on Tariffs and Trade (GATT) member countries (later World Trade Organization -WTO- member countries). The new institutional framework proposed by TRIPs in developing countries has had a gradual influence on the new intellectual property culture, which exceeded the absent or lax patent systems in these countries within the pharmaceutical sector. It seems to have had an influence on the need to increase the systematic consultation of registered patents in order to create new molecules and processes, dependent on the development of technological abilities and the technological proximity of emerging countries to the industrialized ones.
The outcomes suggest that the probability of citing patents of the industrialized countries is associated in some cases to the beginning of patent reforms in emerging countries. Such is the case of Korea, where the patent laws reform took place in 1987 and, in Mexico in 1991. In India, reforms were not carried out until 2005 and China has not yet made its reform. Both countries, however, register a probability to cite patents especially from Japan. Mexico shows a greater tendency toward knowledge fl coming from the United States than from other countries. The importance of the infl of the European Union and Japan can be seen after 2001, the year in which a strong system of intellectual property was adopted. It must be emphasized that in such a scenario, the outcome depends not only on emerging country patent citation, but also on the whole universe of citable patents from industrialized countries. Figure 2 shows that Japanese patent citations are higher in several countries taking into account that the universe of citable patents from the United States increased at a greater rate than the sample of citable patents in Japan and the European Union.

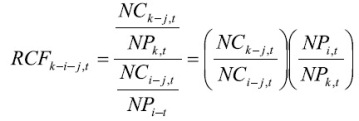
Results of Measuring the Relative Frequency of Patent Citations 9
Citation frequency ignores both the relative relevance of citation among countries, and geographic proximity, one of the reasons why a relative measure may be proposed. The relative frequency of patent citations was estimated in order to know the relative probability that country k cite more patents from country j than country i cite j .
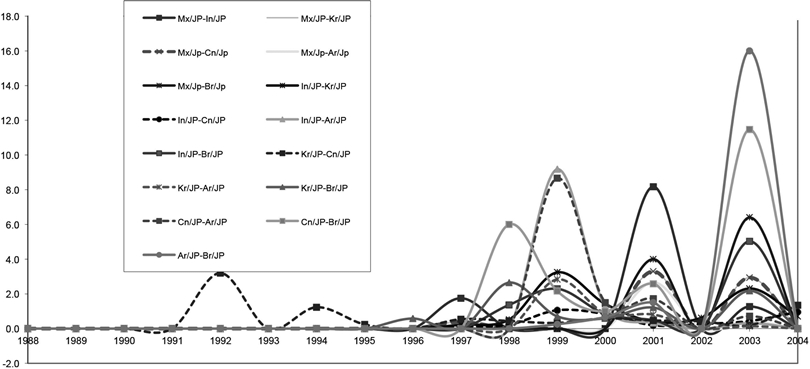
Figures 3, 4 and 5 show the outcome of the relative citation frequency estimates, taking into account the three geographic sources of technological knowledge, namely, the United Status, the European Union and Japan. In all three cases, it was found that pathways were not clearly defined, whereas performance was rather cyclical, which is probably related to differences in technological development and industrial policies toward the sector in each country. Likewise, the erratic performance of patents and patent citation in Latin American countries affects the way this indicator behaves.

Source: Authors’ elaboration from USPTO classification 514 and/or 424.
Fig. 3 Mexico, Relative Citation Frequency from United States Patents by Emerging Countries.
Source: Authors’ elaboration from USPTO classification 514 and/or 424.
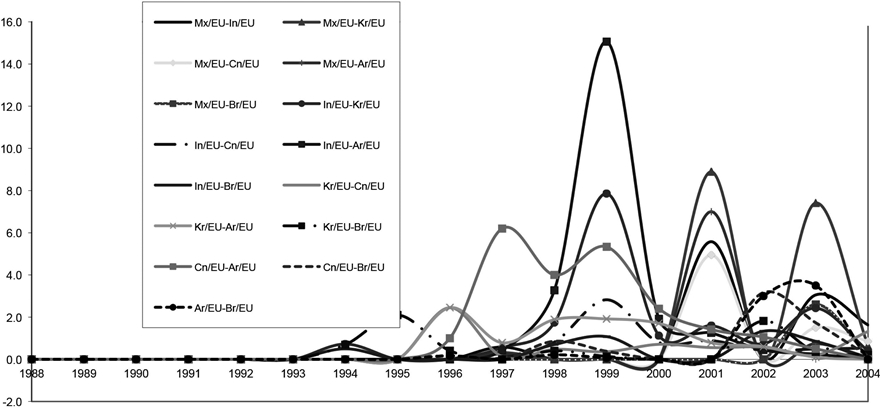
Fig. 4 Relative Citation Frequency from European Union (EU) by Asian and Latin-American Emerging Countries.
Source: Authors’ elaboration from USPTO classification 514 and/or 424.
Fig. 5 Relative Citation Frequency from Japan patentes (JP) by Asian and Latin-American Emerging Countries, 1988-2004.
With regard to a comparison of patent citations made by emerging countries of American patents, it was found that Mexico is more likely to cite American patents than India, Korea and China, although this gap has been reduced since the end of the 90s. Regarding the other two Latin American countries, Mexico claimed to have a greater supply of technological knowledge than Argentina and Brazil, but this has also been diminishing since the end of the 90s. As far as Asian countries are concerned, China cites relatively more US patents than Argentina, and Korea acts in a similar way with regard to Brazil.
Relative measurement of patent citation of European Union patents on the part of emerging countries shows that India and China tend to have a higher relative citation frequency than Argentina, while the advantage Korea once had over Brazil was reduced in the 90s. At the turn of the century, ten years after the establishment of patent reforms, Mexico was more likely to cite European patents than Korea, India, China and Argentina. In recent years, from 2000 to 2004, Mexico cited more Japanese patents than the other countries, with the exception of Korea. It made more Japanese patent citations than India, Brazil and China, although the gap between Korea and China has been gradually closing. Argentina, China, Korea and India relatively surpassed the Japanese citation frequency of Brazil, and India is closer to Japan, relatively surpassing Korea in citation frequency.
Outcomes of Measuring Technology Proximity 10
Technological proximity was estimated through the orthogonality between two vectors, where these are formed by the patents granted to class 514 or 424, in t =27 periods. There are thus two vectors with 27 elements each. They are orthogonal if their internal product is zero. That is to say, when the multiplication produces 0, proximity is nil. That is, the closer to 0, the smaller the proximity. As a result, technological proximity is almost nil. When the indicator is country i (an emerging country) patents are in close proportion to that of country j (an industrialized country). There is then technological proximity regarding innovation efforts and institutional structure. Therefore, it is more probable that i cite j , although they may not necessarily be in geographic proximity.
Technological proximity from emerging countries to the United States is lower due to the fact that the universe of citable patents is much greater than that from the European Union and Japan. Even though Mexico is the country with greater geographic proximity, there is not necessarily greater technological closeness. On the other hand, technological proximity of East Asian countries to industrialized ones, particularly from the European Union, can be explained by several reasons, including the direct foreign investment of industrialized countries in emerging countries, technology transfer, and their corresponding externalities.
A crucial aspect in analyzing technological proximity is R&D expenditure together with other technological strategies. Considering their technological lag, firms from developing country can hardly rely on their in-house R&D efforts for knowledge acquisition. They must also seek to import non-incorporated or soft technologies (license and technical assistance agreements, tacit knowledge transfer).11 The complementarity between R&D and external technology purchase should, in theory, generate a virtuous cycle for local companies. On the one hand, internal R&D capacity can favor absorption of external knowledge (Cohen and Levinthal, 1989; Kamien and Zang, 2000). In addition, it can facilitate adaptation of imported technologies to local markets (Caves and Ukesa, 1976; Katrak, 1997; and Arora, 1997). On the other hand, acquisition of external technologies can contribute in such a way that companies optimize their R&D efforts and thereby increase their technological capabilities and eventually their endogenous innovation (Kamien and Zang, 2000; Kaiser, 2002). When, firms find themselves in an environment of weak inventive activity, the purchase of external technology with the purpose of increasing productivity, substitutes for missing R&D, the cost of which may be quite high and therefore inaccessible. However, substitution of R&D by technology transfer may produce an increase in technological dependence, eventually stunting a company's innovative capacity.12
At this stage of the analysis, R&D expenditure can be observed to have grown even faster in Korea throughout the whole period than all the industrialized countries together (18.3%). The growth rate of R&D expenditure in India has been similar to that of France (more than 4%). Finally, Mexico is experiencing a most challenging situation, which, far from registering an increase, presents an alarming decrease in R&D expenditure in the pharmaceutical industry, which is not associated with GDP growth. There is no available data on pharmaceutical R&D expenditure in Brazil, Argentina and China. Nevertheless, in the case of Brazil, it can be assumed that such expenditure might be higher than that of Mexico, given that in recent years Brazil has allocated 1 percent of its GDP to science and technology, while Mexico earmarks only 0.4 percent to the same sector. In addition, the Brazilian government has supported a policy aimed at encouraging generic drugs, which demands an initial research and development infrastructure.
In comparison, China has deployed a very dynamic technological development policy in order to encourage a favorable environment for imitation and innovation in this industry. In addition to promoting overall technology transfer, China has increased its expenditure in R&D from 0.70 percent of its GDP in 1991 to 1.10 percent in 2002; from 1996 to 2001 published medical research went from a world share of 0.7 percent to 1.0 percent; the impact of the publication index increased from 0.49 to 0.58. China's strength in developing technological abilities and the growing potential of the Chinese market has been added to the initial advantage of multinational corporations in producing low-cost drugs. Likewise, in spite of the strong presence of multinational corporations, Chinese domestic firms control almost the whole market (65%) (Festel et. al., 2005).
Source: OCDE 2000; CONACYT and Indian and Korean Ministries of Science & Technology.
Fig. 7 Research and Development Expenditure in Pharmaceutical Industry, 1978 - 2004. Millions of dollars of 1990 (log).
Although the Mexican holders of patents that cite patents are mostly companies, there are also patent citations from institutes and individuals. In Korea, businessmen's ownership of cited patents prevails, although an insignifi number corresponds to individuals and institutes. India shows a behavior similar to that of Korea.
With regard to lapsed time, the USPTO has requested cited patents in relation to the application year for the patents of the country that cites them. This is the case of Korea. Supposedly, it is more common to cite the oldest patents, particularly when geographic distance is greater. So, in fact, 35 percent of the cited patents present a gap of between 5 and 9 years with regard to the patents that cite them; 26 percent from 2 to 4 years; 19 percent from 10 to 15 years; 4.6 percent a gap of 1 year and 2.4 percent less than one year. This highlights the fact that in recent years there have been a greater number of cited patents with a year's difference in relation to the cited patent. This means that the speed of knowledge diffusion is more dynamic but, at the same time, the fact that patents that go back many years continue to be cited suggests that, in some areas, there have not been very significant changes in knowledge or that there is a continuation of basic principles.
In the case of India, a third of the cited patents also originate between 5 and 9 years prior to the patent citing them. Likewise, there are older cited patents; so, slightly over a fifth have a differential of between 10 and 15 years and 15 percent, of more than 15 years. Only 3 percent of the patents originated 1 year earlier and 0.9 less than one year before being requested.
In Mexico, companies carry out low inventive activity, which has been overcome, in some years, by institutes and individuals. Especially in the case of the latter two, there is no guarantee that inventions will reach an industrial scale and commercialization. In Korea, although individuals and institutes do carry out inventive activity, companies have greater importance. Argentina demonstrates a similar pattern. In India, although inventive activity of companies has grown in recent years, the activity of institutes is more relevant, which suggests important financial support from the government. Pharmaceutical firms in Brazil initially engaged more extensively in patenting activity, but, given that since 1995 institutions have begun to patent, they now hold the leadership. Concerning China, institutions initially held the leadership in inventive activity, but as of 2001, enterprises have strongly increased the number of patents.
The number of inventors for patents reveal the size of R&D laboratories and suggest the existence of organized research teams. In Mexico, the inventive activity of individuals in patents is small in relation to the number of inventors. It could be 1, 2 or 3, but they are not big teams and are very probably associated with graduate research. Neither companies nor Mexican institutes incorporate a large number of inventors. In Korea, inventors' participation in each patent is quite extensive. Patents that have been the outcome of the joint work of 5 to 10 inventors and of more then 10 inventors prevail. This suggests the existence of consolidated work teams. In India, essentially work teams of between 2 and 4 inventors and between 5 and 10 inventors have generated patents.
In the three countries, inventors mostly are citizens of the country, although there are three cases of foreign researchers.
A Model for Knowledge Diffusion
When knowledge begins to be obsolete in relation to an invention, it is less likely to be cited, and depending on language, geography, trade and other barriers, accessibility to the new invention increases.
Measurement of citation frequency and of relative citation frequency has allowed for an identification of the influence of geographic knowledge, which is decisive for inventive activity in the pharmaceutical industry in each country. In a comparable way, it has also enabled the determination of pathways followed by knowledge transfer among the selected countries. Similarly, we have set up the importance of technological proximity, which includes an increase in R&D, technology transfer, joint ventures, fusion and acquisition processes, etcetera. Geographic proximity, language, and trade, are all factors that help to increase the odds of patent citation, although the obsolescence of patents may reduce their probability of being cited. Within this approach, we established a model for knowledge diffusion, reintroducing the proposal made by Jaffe and Trajtenberg (1996):

where:
CF iT, jt is the frequency of country i 's patents in year T , citing country j 's patents in year t .
Tprox iT, jt is the technology proximity index measuring the technological proximity of the citing country i 's patents in year T , and the cited country j 's patents in year t .
β 1 is the rate at which a piece of knowledge embodied in a patent becomes obsolete, which is allowed to vary across pairs of countries.
β 2 measures the rate of diffusion, i.e., all else being equal, how fast a piece of knowledge travels across geographic and technological areas.
The various indexes take on the following values: i = Mexico, India, Korea, China, Brazil, Argentina; j = industrialized countries (the European Union, the United States, and Japan); T = 1978, ..., 2004; t = 1966, ..., 2003. In addition to these three basic parameters, we also examined the way citation differs over both geographic areas and time by including a number of shift parameters, which are collectively denoted by:

where all α's enter in multiplicative form. For example, for ij, there are eighteen parameters for the eighteen pair combinations of countries: Mx-IC (industrialized countries), In-IC, Kr-IC, Cn-IC, Ar-IC, Br-IC. If αMx-U.S. is estimated to be 0.5, it means a Mexican patent is only half as likely to cite a US patent as a Mexican patent is to cite all Industrialized Countries. We also allowed the rate of decay, 1, to differ across country pairs by including ij, which is similar to ij by construction. The ij and ij parameters help us to break down this aggregate difference: how much more likely on average is it that Mexico will cite all industrialized countries (EU, US and Japan) and how much faster (slower) will Mexico cite all industrialized countries. αij and βij have offsetting effects on the cumulative citation frequency: higher α means a higher probability of citation across all lags, while higher 1 means the rate of citation becomes obsolete more quickly, which (holding other parameters constant) reduces the cumulative total of any given lag.
The lack of observation is an element that does not favor the development of this model, which, in this case, is expressed by the fact that countries do not report the patents that are granted or cited over many years. Because knowledge diffusion cannot be estimated, we tried to explain it qualitatively.
This is the case of Mexico, where the indicator of technological proximity reveals that, with regard to the three industrialized countries, Mexico has virtually zero proximity, even though it registered a slight recovery in patent citations between 1997 and 2003, which enhances technological proximity, although it remains below 0.2.
The remaining Latin American countries do not show a very different pattern. Although the patenting level in Argentina is low, similar to that of Mexico, since 1995 it has exhibited a steady increase. The patent citations are higher than in Mexico and more than half of them correspond to industrialized countries. However, these citations do not necessarily refer to the countries under study. Therefore, the technological proximity index suggests that Argentina's technological gap with regard to Triad countries increased from 1995 to 2004. The case of Brazil is very similar to that of Argentina.
India registered an important increase in its number of patents between 1997 and 2004, a period that reduced the sample to 7 years. More than half of its citation patents are from industrialized countries. India tends to cite more US patents than patents from the European Union or Japan. Although the technological proximity index tends to be zero, the highest index of technological proximity is linked to the European Union rather than the United States.
The situation in Korea is paradoxical. Since 1988, the growth in the number of patents has been dynamic and constant and, consequently, the same has happened with patent citation. However, the patent growth rate in class 514 and/or 424 (of the pharmaceutical industry) is lower than the overall growth rate for patents of all classes, which explains why its share with regard to the proportion of these same classes has been decreasing in industrialized countries. It is undeniable that knowledge spillover has already taken place, but, at the same time, a greater technological gap is becoming evident with regard to the industrialized countries.
In China, inventive activity is more recent.13 This country began its trajectory in patent generation in 1997. It is worth noting that the patent citation growth rate highly exceeds the patent growth rate. More than half the patent citations correspond to industrialized countries. Nevertheless, as in the aforementioned cases, technological proximity tends towards zero. That is to say, technological proximity to industrialized countries is virtually non-existent.

Source: Authors’ elaboration from USPTO classification 514 and/or 424.
Fig. 8 Citation Frequency Lag from Industrialized Countries by Emergent Countries.
As mentioned earlier, although we have a broad sample period of 26 years, the latter is reduced (ten years on average) because several of these countries were delayed in initiating their inventive and patenting activity and there is no systematic and increasing activity in others.
Finally, technological proximity tends towards zero in all cases (0.2 or 0.3).
Therefore:
Given that there is no continuous patenting activity, there is no continuous patent citation. In such a situation, the speed rate of spillover cannot be determined and even less the rate of backward spillover.
More than half the patent citations refer to the industrialized countries under study. This suggests that an important source of knowledge has been assimilated in order to create new knowledge, but the spillover process is very low, particularly in Latin American countries (Argentina, Brazil and Mexico).
Conclusions
The new knowledge generated by the pharmaceutical industry has a high propensity to be imitated. Hence, its protection through patents is of paramount importance in order to stimulate innovation. In spite of the enormous differences that exist in size and innovative activity between industrialized and developing countries, some of the latter have not only developed a local industry based on imitation, but have also generated some new molecules or pharmaceutical processes.
Although patents grant the holder a monopoly over the exploitation of new knowledge, its diffusion is not prevented as long as the patent's basic information is published. Some emerging countries have profited from this knowledge spillover in order to generate endogenous knowledge. Korea, India, China, Argentina, Brazil and Mexico have developed inventive activity with different dynamics, which are associated to the development of their social (institutional) and technological capacities (human capital training, investment in R&D, technology transfer).
The inventive activity of Latin American countries in the pharmaceutical sector registered in patents of the USPTO dates back to the 70s, especially in Argentina and Mexico. However, it has not grown nor has it been systematic. The importance of pharmaceutical and biotechnological innovation in Brazil is more recent and is still weak. On the contrary, India and Korea have achieved an important level of innovation that translates into an increasing number of patents granted under the USPTO, especially in the 90s. China has started an innovative pathway in the pharmaceutical sector and has a promising future. In all these countries there are differences in the nature of innovation, i.e., the relative importance of the assignee's patent. In Korea, fi undertake inventive activity. In India, institutions play an important role in the generation of patents. And, fi in China, there is a contribution of individuals, institutions and fi with a growing importance of the latter.
The six emerging countries have profited from the diffusion of new knowledge patented by industrialized countries. Nevertheless, geographic proximity has not necessarily favored knowledge spillover. Although Mexico is geographically located close to the world's leading country in the pharmaceutical sector, it has not benefited from probable technological knowledge spillover. This is associated with scarce managerial and institutional participation in innovation, including R&D. Argentina and Brazil have a similar pattern to Mexico, even though technological influence has been more diversified. In recent years, Brazil has had a tendency towards increasing the probability to cite American patents as innovation activity grows. On the other hand, both China and India, in spite of the distance, have built technological capacities that have allowed them to profit from new knowledge, increasingly tending towards what can be considered to be in the vanguard.