


Servicios Personalizados
Revista
Articulo
 Inglés (pdf)
 Artículo en XML
 Referencias del artículo
 Enviar artículo por email
Indicadores
-
 Citado por SciELO
 -
 Accesos
Links relacionados
-
 Similares en
SciELO
Similares en
SciELO
Compartir

 Permalink
Contaduría y administración
versión impresa ISSN 0186-1042
Contad. Adm vol.59 no.4 Ciudad de México oct./dic. 2014
Risk disclosure and cost of equity. The Spanish case
Divulgación de riesgos y costo de capital de los recursos propios. El caso español
David Cabedo Semper*, José Miguel Tirado Beltrán**
* Universidad Jaume I, cabedo@uji.es.
** Universidad Jaume I, tirado@uji.es.
Fecha de recepción: 24.02.2014
Fecha de aceptación: 28.05.2014
Abstract
In this paper we make an empirical study of the relationship between risk disclosure and the cost of equity. In particular, the objective being pursued is to contrast whether or not the cost of equity for the company is related to its financial and non-financial risk disclosure. Our results show no statistically significant relationship between the latter and the cost of equity; and a statistically significant relationship, with a positive sign, between this cost and financial risk disclosure. This suggests that company risk disclosures appear to introduce unknown contingencies and risk factors rather than only update information about known risks.
Keywords: cost of equity, risk, risk reporting, risk disclosure.
Classification JEL: M41
Resumen
En este trabajo se hace un estudio empírico de la relación entre la divulgación de riesgos por parte de las empresas y el costo de capital de los recursos propios. En particular, el objetivo que se persigue es contrastar si el costo de capital de los recursos propios está relacionado con la divulgación de riesgos financiero y no financiero. Nuestros resultados no muestran relación estadísticamente significativa entre el riesgo no financiero y el costo de capital de los recursos propios; y una relación estadísticamente significativa positiva entre este costo y la divulgación de riesgos financieros. Esto sugiere que las divulgaciones de riesgo de la empresa parecen presentar contingencias desconocidas y factores de riesgo en vez de sólo actualizar la información sobre los riesgos conocidos.
Palabras clave: costo de los recursos propios, riesgo, información sobre riesgos.
Clasificación JEL: M41
Introduction
There are numerous studies on the economic consequences of divulging accounting information. From a theoretical perspective, greater disclosure is mainly associated with a reduction in information asymmetry (Diamond and Verrecchia, 1991 and Kim and Verrecchia, 1994) and a reduction in investor uncertainty (Botosan, 1997), which indirectly reduces the cost of equity. However, empirical studies have not provided any conclusive findings on whether more information results in a lower cost of equity (Verrecchia, 1999). In any case, it is worth noting that almost all these studies focus on analysing the relationship between the cost of equity and disclosure, considering the information as a whole, without distinguishing between the different types of information companies disclose. Obviously not all published information is equally relevant. Furthermore, the publication of additional information will probably be more influential in areas where obligatory and standardised accounting information has the greatest gaps. For that reason, study of the impact on the cost of equity of publishing different types of information may be especially important.
Risks are one of the categories with particular shortfalls in the accounting information that is currently published. For several years now, professional accounting organisations and various authors have stressed the need for risk disclosure. In this regard, the Institute of Chartered Accountants in England & Wales (ICAEW, 1997) denounces the limitation of having to make profit forecasts based exclusively on past data and encourages firms to disclose risk information so that users can take into account factors that may affect results or future cash flows. Similarly, Kwok (2003) shows that firms' risk disclosure under the Financial Reporting Release (FRR No. 48) promulgated by the Securities and Exchange Commission (SEC, 1997), helps to improve the accuracy of profit forecasts.
Risk disclosure has been studied in many works through content analysis (Lajili and Zéghal, 2003; Mohobbot, 2005; Linsey and Shrives, 2006; Abraham and Cox, 2007), determining the amount of risk disclosure firms engage in.
One advantage of risk disclosure is its impact on reducing the cost of equity. Investors' risk perceptions are a major factor in determining the cost of equity a firm has to assume. Risk disclosure can therefore help to reduce investor uncertainty, thereby reducing the risk premium required from the company. However, very few studies have dealt with the relationship between risk disclosure and the cost of equity. In this line, possibly the only study that can be cited is that by Guo (2003) which analyses the impact of risk disclosure on the cost of debt.
This study adopts a different perspective, making an empirical study of the relationship between risk disclosure and the cost of equity, understood as the profitability investors expect. In particular, the objective being pursued is to contrast whether or not the cost of equity for the company is related to its risk disclosure. The rest of the work is structured as follows: Section 2 analyses the antecedents in the literature on the object of study. Section 3 presents the hypotheses. Section 4 details the data used and the methodology chosen to analyse it. Section 5 presents the findings. And the last section summarises the main conclusions.
Background
There is abundant literature on the relationship between disclosure and the cost of equity. A first line of investigation in the literature is based on the idea that disclosure reduces the cost of equity by reducing investor uncertainty over risk estimation. In this regard, a higher amount of (published) information reduces uncertainty for investors when forming their optimum portfolio and determining the optimum price for the values in it (Clarkson et al., 1996). This reduced uncertainty leads to higher prices and therefore lower required profitability or cost of equity. Thus, if it can be shown that a higher amount of published information reduces risk, indirectly this should, in theory at least, also be showing that it reduces the cost of equity. On these lines, Dahliwal et al. (1979) analyse the impact on non-diversifiable risk (market Beta) and on total risk, of the obligation imposed by the Securities and Exchange Commission (SEC) to publish segmented information. Although the authors find that total risk decreases when companies publish that information for the first time, the results of publication on non-diversifiable risk are not conclusive. However, Prodhan and Harris (1989), who carried out a similar study on Statement of Financial Accounting Standard No.14 (SFAS No. 14), detect that non-diversifiable risk (market beta) decreases in companies that publish segmented geographical information for the first time. If the beta were an appropriate indicator for non-diversifiable risk that can be reduced by publishing information, the results reported by Prodhan and Harris (1989) would show that more publication of information would generate a lower cost of equity for the company. However, the theory suggests that the beta does not reflect risk estimation1, and so the above authors' results cannot be considered definitive in relation to their last conclusion.
A second line of research is based on the contribution that disclosure makes towards reducing transaction costs (Amihud and Mendelson, 1986). Investors place a lower valuation on securities subject to higher transaction costs and so the cost of equity for these securities is higher. Usually, higher transaction costs are associated with greater information asymmetry (Diamond and Verrecchia, 1991 and Verrecchia, 2001) and lower liquidity (Diamond and Verrecchia, 1991 and Kim and Verrecchia, 1994). This is the reason why studies in this line of research resort to proxies or indicators for these magnitudes like relative spread, trading turnover or standard deviation of yields. In this line, Greenstein and Sami (1994), who also focus their analysis on SEC's promulgation of the obligation to publish segmented information, show that relative spreads reduce in companies that begin to publish this type of information. Welker (1995) and Healy et al. (1999) obtain similar results after analysing the disclosure quality ratings published by the Association for Investment Management and Research (AIMR). Healy et al. find increases in share prices, monitoring by analysts and public funding for companies that improve disclosure, thus reaffirming the relationship between improved disclosure quality and reduced information asymmetry and improved liquidity. Leuz and Verrechia (2000) study German companies that voluntarily submit to greater disclosure requirements established by International Accounting Standard (IAS) or by generally accepted accounting principles and criteria in the USA (US GAAP), and they conclude that relative spreads fall and the trading volume increases in companies that voluntarily publish information. Mohd (2005) reaches similar conclusions in a study related to the capitalisation of software development costs.
Studies show that relative spreads decrease when disclosure increases and information asymmetry decreases. Hence, in accordance with the above, greater disclosure leads to a lower cost of equity. However, this conclusion can still be qualified. Firstly, not all the margin or spread between supply and demand obeys information costs. In fact, some empirical studies situate this component at only 50% of the total spread (George et al., 1991), in spite of the difficulties and biases that can occur when attempting to isolate the informative component of the total spread to analyse its relationship with information asymmetry. Secondly, bearing in mind that relative spread is the quotient between absolute spread and share price, there is no guarantee that a reduction in that relative spread is necessarily due to less information asymmetry. In fact, according to Berk (1995) shares from higher risk companies have lower valuations as their future flows are discounted at a lower rate. In these companies, if disclosure reduces the estimation risk, the valuation and share price will increase (reduced discount rate) with a consequent reduction in relative spread, even when there has been no change in information asymmetry. Although it is true that in this case the cost of equity falls, the situation can also occur where there is a reduction in relative spread but information asymmetry and estimation risk remain constant. This may occur when the share price increases as a consequence of increased expectations over the future cash flows the company will generate (Botosan, 2006).
Regardless of the impact or otherwise on estimation risk, information asymmetry or transaction costs, various studies show that company managers behave as if greater disclosure reduces the cost of equity. In fact, these works find that prior to an increase in capital or entry into new markets, managers increase disclosure and there is an increase in share price (reduction in the cost of equity; see Frankel et al., 1995 and Lang and Lundholm, 2000). For this reason a third line of research is of interest which provides direct empirical analysis of the relationship between disclosure and the cost of equity.
The seminal work in this line (Botosan, 1997, using data from a sample of 122 American industrial companies) shows that companies with higher levels of voluntary disclosure benefit from lower costs of capital. However, this result only holds for companies with a low level of monitoring by analysts. Subsequently, Botosan and Plumlee (2002) extend the scope to various sectors and years, analysing the relationship between the cost of equity and three types of information, annual accounts, periodic reports (quarterly) and other reports for investors. The results are surprising; while there is a negative relationship between the cost of equity and the degree of annual accounts disclosure, that relationship becomes positive for quarterly information (timely information) giving results that contradict the theoretical predictions. Botosan and Plumlee (2002) argue that this positive relationship may be due to increased price volatility caused by such disclosures motivated, as Bushee and Noe (2000) point out, by institutional investors which, temporarily, trade aggressively in the face of new short-term profits, causing an increase in price volatility in the short term.
Gietzman and Trombetta (2003) argue that this positive relationship between periodic disclosure and the cost of equity obtained by Botosan and Plumlee (2002) may be due to model specification problems and they point out that the model estimation does not take into account the possible effects of the company's accounting policy (aggressive versus conservative). In this regard, Gietzman and Trombetta (2003) speak of an "interaction equilibrium" in which the cost of equity is simultaneously influenced by the accounting policy (aggressive versus conservative) and disclosure quality. Thus, aggressive companies can reduce their cost of equity by increasing the quality of the disclosed information whereas companies classified as conservative are not influenced by the degree of disclosure. The studies by Espinosa and Trombetta (2007) for Spanish companies and Gietzaman and Ireland (2005) for companies in the United Kingdom provide empirical support for Gietzman and Trombetta's (2003) theoretical proposal of an "interaction equilibrium".
Other works such as those by Hail (2002), Richardson and Welker (2001) and Francis et al. (2005) have also investigated the relationship between the cost of equity and voluntary disclosure of information. In a sample of Swiss companies Hail (2002) finds a strong negative relationship, regardless of the level of monitoring by analysts, contrary to the results reported by Botosan (1997). Richardson and Welker (2001) study the relationship between financial and corporate disclosure and the cost of equity for a sample of Canadian firms. Quantitative and qualitative financial disclosure is negatively related to the cost of equity for companies with low monitoring by analysts whereas the relationship turns positive for corporate disclosure. These findings, contrary to the theoretical assumptions may be due to a different vision between those in favour of corporate social responsibility, supporting projects with current negative values but with future cost savings and strategic advantages, and the market that values such projects as increased risk.
The study by Francis et al. (2005) analyses the relationship between voluntary disclosure, and not only the cost of equity but also the cost of debt. The study is based on a sample of industrial companies from 34 countries, and finds that companies with a greater need for external financing show higher levels of voluntary disclosure and this greater disclosure is negatively related to the cost of equity and debt, in keeping with the studies by Sengupta (1998) and Nikolev and Van Lent (2005). These works show a negative relationship between disclosure quality and the cost of debt, consistent with theoretical arguments which postulate that a detailed, opportune disclosure policy reduces perceived non-payment risk for lenders, thereby reducing the cost of financing.
The works mentioned so far analyse, directly or indirectly, the relationship between the voluntary disclosure of accounting information and the cost of equity. The analysis, however, focuses on the information from a global perspective, without distinguishing categories or composition, although theoretically not all the information companies publish is equally relevant and therefore nor does it have the same potential impact on the cost of equity. A recent line of investigation has proposed the study of certain attributes of this disclosure and their relationship with the cost of equity. This group includes the works by Francis et al. (2004), Hribar and Jenkins (2004) and Mikhail et al. (2004), who focus on one of those attributes, the quality of the results. Another group of works such as those by Botosan et al. (2004), Easley and O'Hara (2004) and Lambert et al. (2009) deal with other attributes: composition (public-private), accuracy (forecast dispersion) and the degree of dissemination of the published accounting information. In general, greater quality, accuracy and dissemination lead to a lower cost of equity.
Risk information is a key part of the information that companies voluntarily disclose. Proof of this is the concern shown by regulatory accounting bodies and the accounting literature over risk disclosure. This interest has given rise to a line of research directed at:
a) Understanding the degree of risk disclosure and the corporate characteristics that influence such disclosure (Beretta and Brozzolan, 2004; Linsley and Shrives, 2006; Mohobbot, 2005; Abraham and Cox, 2007) and
b) The information content of risk disclosure: Papers like the ones of Jorion (2002), Rajgopal (1999), Woods et al. (2008), Linsmeier et al. (2002), Liu et al. (2004), and Kravet and Muslu (2013) can be incorporated into this research line. The conclusions of the latter are especially interesting. Kravet and Muslu (2013) find that annual changes in risk disclosures are significantly and positively associated with changes in daily stock return volatility, changes in relative volatility of negative daily returns, filing volume, changes in trading volume, and changes in volatility of forecast revisions. Therefore they conclude that company risk disclosures appear to introduce unknown contingencies and risk factors rather than only update information about known risks.
However, no study has attempted to verify specifically whether or not disclosure of this type of information is related to an increase or decrease in the cost of equity borne by companies. The present study deals with that issue and is based on a sample of companies listed on the Spanish capital market.
Hypothesis
Increased disclosure by companies can reduce information asymmetry between suppliers and users of the information and directly lead to an increase in the liquidity of shares and a reduction in the cost of equity. As the literature review has made clear, voluntary disclosure in general terms can reduce the cost of equity, although some studies such as those by Botosan and Plumlee (2002) and Richardson and Welker (2001) evidence a positive relationship (in contrast to what was expected) between periodic and corporate information and the cost of equity.
For several years now, accounting bodies (American Institute of Certified Public Accountants, AICPA, 1994; Institute of Chartered Accountants in England & Wales, ICAEW, 1997) and the accounting literature (Solomon et al. 2000; Cabedo and Tirado, 2004) have been interested in the benefits of greater risk disclosure. In this regard, according to ICAEW (1997) risk disclosure helps to reduce the cost of equity for companies. Greater risk disclosure will enable potential providers of capital to forecast future cash flows with less uncertainty; with less risk information investors should demand a higher risk premium because the data that would enable them to adequately assess the risks the company is exposed to is missing. Thus, more risk disclosure should be negatively related to the cost of equity.
On the basis of the above, considering the arguments in the literature on the relationship between the disclosure of accounting information and the cost of equity and the impact of risk disclosure on reducing uncertainty and the cost of equity, this study tests the following hypothesis: "There is a negative relationship between risk disclosure and the cost of equity".
Methodology and data
Empirical model
The following regression model was used to analyse the relationship between the cost of equity and risk disclosure (1):

where:
rit the cost of equity implicit in the i-nth for period t.
IRRit the company's risk disclosure index i-nth for period t.
LMCit is the logarithm for the market capitalisation of the company i-nth for period t.
LEVit is the leverage ratio, measured as total debt over market capitalisation.
BTMit is the book-to-market ratio.
Below is a description of the procedures used to estimate the values of the dependent variable (cost of equity) and to determine risk disclosure index values (explanatory variables) and control variables.
Dependent variable: cost of equity
As the cost of equity is a measure of expected profitability, it is not directly observable and must be estimated. It was estimated using the residual income model (RIV). Such as Ohlson (1995), this model establishes that share price is determined by the book value of equity plus an infinite updated flow of future abnormal earnings or residual income (2):

where Pt is the market value of the share at moment t; Et is the estimation operator; bvt is the book value of equity at time t;x+τ is the estimation of results of t+τ made at time t; and r is the profitability demanded by shareholders or the cost of equity.
In order to estimate the cost of equity, the residual income valuation model requires, in theory, the estimation of future profits and equity to infinity. However, for practical purposes Gebhardt et al. (2001) propose an operational model to estimate the cost of equity that adopts a three-stage approach: (a) the first stage uses analysts' forecasts of future profits for the next three years (t+1, t+2 y t+3); (b) in the second stage the forecasts of future profits are obtained by linearly reverting the return on equity in the third year (ROE) (t+3) to the average market ROE and; (c) finally, to determine the terminal value it assumes the perpetuity of the last residual income. This approach provides a model with a finite time horizon (3) that has been used in other studies such as those by Hail (2002), Gietzman and Ireland (2005) and Espinosa and Trombetta (2007).
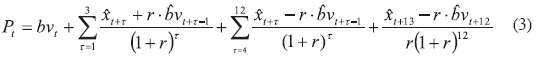
where:
Pt is the share price at the end of June.
bvt is the book value of equity at time t.
 is the future book value of equity at date t+τ, assuming the clean surplus relationship in which
 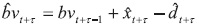 ; expected future net dividends for period (t + τ -1, t+τ) are the average payout ratio (distributed dividends) for the last five years.
 is analysts' profit forecasts in t for the period t+1, t+2 and t+3; after t+3 the profit forecast is determined by a linear reversion of current ROE to the average market ROE until period t+12. This average market ROE is calculated as the median ROE for the last five years of companies listed on the Madrid Stock Exchange General Index eliminating negative ROEs. And r is the cost of equity. The cost of equity is estimated by an iterative process using the available information.
Independent variable: Risk disclosure index
Most previous studies have used narrative content analysis to determine the degree of risk disclosure. This method involves classifying narrative information into the different study categories and establishing a measure of that information. The usual measure is the number of sentences. Thus it is accepted that higher numbers of sentences disclosed indicate higher risk disclosure (Linsey and Shirves, 2006 and Abraham and Cox, 2007). The main drawback of this measure is that it provides information on the amount of disclosure but not on the informative content. In order to overcome this limitation, we have used the methodology proposed by Cabedo and Tirado (2009). This methodology measure the degree of risk disclosure using an index based on published information. The first step of the proposal requires analysis of all the risk disclosure contained in the accounting information published by the studied companies. Then a series of phases is defined. Phase is understood to mean an informative level regardless of the number of sentences concerning a given aspect of risk. In particular and within the group of companies studied, five phases have been identified:
Cabedo and Tirado (2009) measure the degree of risk disclosure using an index based on published information.
• Phase 1: The company only mentions the risks it is exposed to.
• Phase 2: The company describes the risk and how it is affected by that risk.
• Phase 3: The company quantifies the impact of the risk.
• Phase 4: The company informs on risk management.
• Phase 5: The company informs on the types of instruments used to mitigate the risk.
Classification of a company in one of these phases does not exclude it from any of the other phases. Thus, for example, a company may mention the risks it is exposed to (phase 1), it may also describe them and how they affect it (phase 2) and may provide information on risk management (phase 4).
The risk disclosure index for each company is constructed from the number of phases it is in for each of the risks on which the company provides information. This index reflects the degree of risk disclosure for each company (4):
IRi = IRFi + IRNFi (4)
Where IR is the risk disclosure for company i-nth; IRFi is the financial risk disclosure index for company nth and IRNF. is the non-financial risk disclosure index for said company2.
To calculate the risk disclosure index (IR) it is therefore necessary to calculate two sub indexes: the financial risk index (IRF) and the non-financial risk index (IRNF). Below are the equations used to estimate (5) and (6):
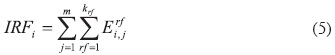
where rfis the type of financial risk; Ei,jrf is the phase value j of the financial risk rf for company i-nth; Ei,jrf will take a value of 1 if company i is in that phase and 0 if it is not; m is the number of phases.

where rNf is the type of non-financial risk; Ei,jrNf is the phase value j of the non-financial risk rNf for company i-nth; Ei,jrNf it will take a value of 1 if the company is in that phase and 0 if it is not; and fi,h represents the risk factors in the case where a non-financial risk category presents more information on a risk factor; fi,h will take the value 1 for each n factor of non financial risk.
In order to eliminate problems of size in the estimated model, the variables representing the degree of risk disclosure for each index, total (IR), financial (IRF) and non financial (IRNF) have been relativized. Thus, the risk indexes used in the model are as follows (7), (8) and (9):
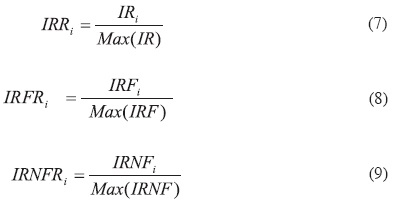
where:
IRRi is the relative risk disclosure index for company i.
IRFRi is the relative financial risk disclosure index for company i.
IRFNRi is the relative non-financial risk disclosure index for company i.
Control variables
This work studies the relationship between risk disclosure and the cost of equity. However, the cost of equity is influenced by other risk factors that investors perceive for the company. In this regard, control variables have been introduced in the form of different risk factors that influence the cost of equity used in prior studies like those by Botosan (1997), Hail (2002), Espinosa and Trombeta (2007) and Francis et al. (2008). These control variables are size, leverage and book-to-market.
Size (LMC).The fact that large companies have greater financing needs means that they provide more information, reducing information asymmetry on perceived risk. Thus, there is likely to be a negative relationship between company size and the cost of equity. Botosan (1997), Hail (2002), Botosan and Plumlee (2005), Hail and Leuz (2006) and Rakow (2010) report that negative relationship. Other studies, however, like the one by Cheng et al. (2006) find no relationship between the cost of equity and size. The variable used to define size is the logarithm of market capitalisation.
Leverage (LEV). High levels of leverage increase company risk and therefore the cost of equity. Therefore there is likely to be a positive relationship between the level of leverage and the cost of equity. Gebhardt et al. (2001), Gietzmann and Ireland (2005), Botosan and Plumlee (2005), Hail (2002), among others, find evidence for such a relationship. The debt-to-market-capitalisation ratio has been used as a proxy for leverage.
Book-to-market ratio (BTM): The book-to-market ratio represents a measure of companies' opportunities for growth (Gebhardt et al., 2001). High values for this ratio indicate lower opportunities for growth and therefore a higher cost of equity. Botosan and Plumlee (2005), Cheng et al. (2006) and Hail and Leuz (2006) find evidence of this positive relationship.
Data
The sample used to test the hypothesis comprises data from non financial companies listed on the Madrid Stock Exchange from 2007 to 2009. Companies for which there were no profit forecasts were eliminated from the sample as forecasts were needed to estimate the cost of equity. Companies for which there was no accounting data were also eliminated.
Furthermore, variable cost of equity outliers were eliminated so that they would not distort the estimation results for the different models. This involved eliminating observations with values outside the following values:
Li and Ls are the lower and upper limits that mark the presence of outliers, C1 and C3 are the first quartile and the third quartile, and RIC is the interquartile range.
In the sample, 21 variable cost of equity outliers were detected and eliminated. The final sample consisted of 234 observations. Table 1 shows details of the sample selection process and the table 2 the distribution of the sample by economic sectors.


The data on risk disclosure levels was obtained from annual accounts and management reports for the years 2007 to 2009. The 2007 General Accounting Plan establishes that the company report must provide qualitative and quantitative information on the different types of financial risks (credit, liquidity, exchange rate, interest rate and other price risks) to which the company's financial instruments are subject to. In no case does the plan mention the obligation to disclose non-financial risk information, leaving it to the companies to decide whether to present information on other types of risks. To supplement the information on risks, Spanish legislation (Article 202 of the Spanish Corporations Act) establishes that companies with an obligation to produce consolidated information must present in the management report a description of the main risks they are exposed to together with objectives, management policy and exposure to financial risks. Thus, these two documents, the company and management reports, reflect all the information on risks that companies disclose.
Three types of data were used to calculate the cost of equity: share prices, profit forecasts per share and corporate variables.
Share prices were obtained from the Madrid Official Stock Exchange Bulletin. Two trading dates were used to estimate the cost of equity: trading on the last working day of the month of June and the date of the audit report. Trading on the last working day of June is the date most commonly used to determine the cost of equity (Espinosa and Trombetta, 2007; Hail, 2002). That date was chosen considering the periods available to companies listed on the stock exchange to deposit and publish their annual accounts. Thus the share price considered reflects the information contained in the annual accounts for the previous year. On the date the audit report is signed, the annual accounts are formulated and cannot be modified. In this regard, although this information has not yet been published in the official registers, it is worth noting that the market does anticipate it.
Profit forecasts and accounting variables were obtained from the Thomson One Banker database.
Results
Analysis of the data
Table 3 shows the main descriptive statistics for the set of variables used in the analysis for the sample of companies.

From the data shown in table 3 it is worth noting that there is little dispersion of figures on size (LMC), and the standard deviation is 1.71, which represents around24% of the average. Whereas leverage (LEV) and book-to-market (BTM) show high standard deviations, 1.38 and 0.59 (150% and 95% of the average) respectively. Therefore, it is a fairly uniform sample in terms of company size, although there is a greater differentiation between companies in terms of leverage and book-to-market.
In relation to risk disclosure, table 3 shows that 50% of the companies have a total risk index (IRR) under 0.39, whereas only 25% have an (IRR) over 0.54; that is a little over half the companies that disclose the most. This data reflects the fact that only a few companies present more information on risks.
Analysis of the data for the financial (IRFR) and non financial (IRNFR) risk indexes shown in table 3, shows that only 25% of companies have an (IRFR) below 0.55, which indicates that most companies present information on their financial risks. In regard to non-financial risk disclosure (IRNFR), few companies present information on non-financial risks in their annual accounts: 75% of the companies have an index (IRNFR) below 0.34. It should be emphasised that all companies in the sample disclose some information (Minimum IRR = 0.07).
Finally, as table 3 shows, the average cost of equity is 11% with a standard deviation of 3%.
Having shown the main descriptive statistics for the data, as an initial step in estimating the models, the correlations between the dependent and explanatory variables for these models were analysed with a dual objective:
• firstly, to determine in the group of potentially explanatory variables, those that are correlated with the estimated costs of capital through model (3) using the share price in June and on the date of the audit report;
• and secondly, to detect correlations between exogenous variables that can justify excluding some of them from the model.
As table 4 shows, of the risk disclosure indexes, only the financial risk index (IRFR) and total risk index (IRR) have a statistically significant correlation coefficient with the cost of equity, the other risk disclosure indexes have no significant correlation. This significant correlation is positive, which is contrary to the results expected from the proposed hypothesis: greater risk disclosure will reduce the cost of equity.

The book-to-market variable (BTM), degree of leverage (LEV) and company size (LMC) have statistically significant correlation coefficients in keeping with prior studies.
Results relativized
Table 5 shows the results of the ordinary least squares estimation of the model.

As can be seen in table 5, the results show a weak and positive relationship (coefficient: 0.0215 significant at 10%) between the degree of risk disclosure (IRR) and the cost of equity (ra) when the audit date is taken as the reference for calculation. This relationship is opposite to that expected. That is, it could be interpreted that the market penalises companies that disclose more information on risks so that greater disclosure leads to a higher cost of equity. Furthermore, the coefficient shows no statistical significance at all when it is related to the cost of equity (rj) calculated with data from June. A possible explanation for these results is that the information is disclosed well before the end of June and therefore prices have already previously reflected risk disclosure.
The variable size (LMC) is not statistically significant in either of the two models. These results contradict the findings of previous studies by Hail (2002), Espinosa and Trombetta (2007) and Botosan and Plumlee (2005) which show a statistically significant negative association. These results may be due to the fact that most of the companies in the sample are similar in size.
The other two variables that reflect risk factors, (LEV) and (BTM), show statistically significant positive relationships in both models as expected: a higher level of leverage (LEV) is perceived by investors as a higher level of risk and thus, investors demand a higher cost of equity; increases in book-to-market (BTM) indicate lower prospects of growth and so investors demand a higher cost of equity to invest in such companies.
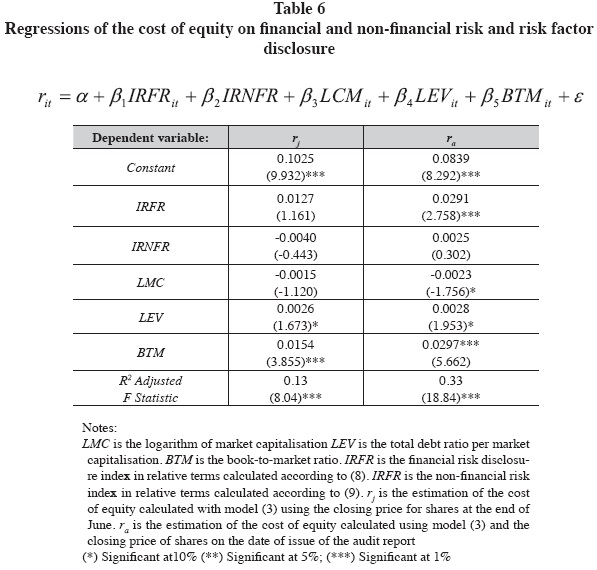
In view of the fact that the risk disclosure index (IRR) includes information on financial and non-financial risks, the effect on the cost of equity of financial risk disclosure (IRFR) and non-financial risk disclosure (IRNFR) have been studied separately. Table 6 shows the results. It can be seen that for both models the variable (IRNFR) is not statistically significant, that is, non-financial risk disclosure (IRNFR) is not related to the cost of equity. However, the financial risk disclosure variable (IRFR) is positive with a high statistical significance for the model that estimates the cost of equity using the date of the audit report as reference. Thus the market behaves in a way that contradicts the hypothesis: Not only does greater financial risk disclosure not reduce the cost of equity (as posited in the theory) but the market perceives it as a risk factor with a negative influence on the cost of equity.
This relationship between the cost of equity and financial risk disclosure shows that markets associate a greater volume of information with a need to justify higher levels of risk. These results are consistent with those reported by Kravet and Muslu (2013).
In our study, financial risk disclosure has been summarised in an index based on five stages. Four of them (E1, E2, E3 and E5) reflect different qualitative aspects of the disclosure whereas the fifth (E4) refers to quantification of the risks. Markets can perceive qualitative and quantitative information in different ways and so the sign of the regression coefficient for the variable IRFR in the model shown in table 6 may be determined by this twofold aspect of the information it contains. To determine whether there is a differential effect between the two types of information model (10) was estimated. This model was only estimated for the cost of equity using the audit report as the reference date, due to the fact that for June no statistically significant relationship between the risk disclosure indexes and the cost of equity was found.

where:
ra is the implicit cost of equity for i-nth in period t.
Dit is a dichotomous variable that takes the value 1 when company i-nth discloses quantitative information on financial risks during period t and 0 when it does not disclose.
LMCit is the logarithm for market capitalisation of company i-nth in period t.
LEVit is the leverage ratio, measured as total debt over market capitalisation.
BTM is the book-to-market ratio.
The dichotomous variable reflects the effect of quantitative financial risk disclosure as against qualitative information. Table 7 shows the results of the estimated regression model. As the table shows, the coefficient of the dichotomous variable (D) is statistically significant and positive. This indicates that investors perceive the fact of quantifying financial risks as a risk factor with a negative impact on the cost of equity for the company (penalising it).
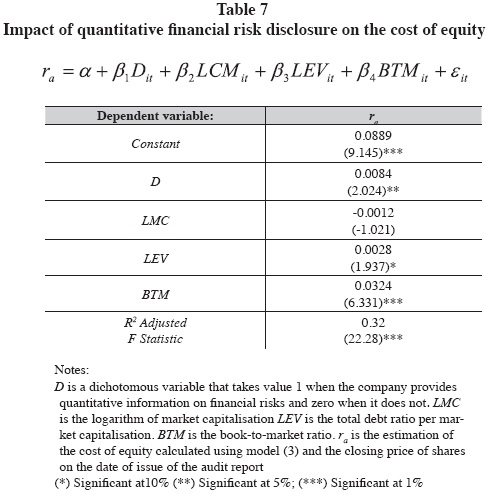
The result from this last estimated model reinforces the idea that markets associate greater disclosure with the need for the company to justify higher levels of risk: the market interprets the quantification of risks negatively, penalising the cost of equity in companies that engage in this practice; it seems therefore, that the market interprets that companies that offer quantitative information are exposed to higher levels of risk.
Conclusions
There is an important body of theoretical and empirical studies in the literature that study the relationship between the disclosure of accounting information and the cost of equity. However, despite the fact that for several years now, professional accounting bodies and various authors have emphasised risk disclosure, few studies have specifically analysed the relationship between this type of disclosure and the cost of equity. Furthermore, most studies approach the problem from a theoretical perspective.
The present study has analysed the relationship between risk disclosure and the cost of equity from an empirical perspective. For that purpose a regression model has been estimated where the dependent variable is the cost of equity and the set of explanatory variables consists of the indicators of the degree of risk disclosure and a set of corporate variables that represent risk, leverage, potential growth and company size.
The sample is made up of non financial companies listed on the Madrid Stock Exchange from 2007 to 2009. In addition, risk disclosure in the sample has been summarised using ad hoc indexes that reflect the different aspects of each risk that companies provide information on. The cost of equity for each company was estimated using the residual income model (RIV).
The results show that the cost of equity is related to corporate aspects such as the potential for growth (book-to-market) and leverage. However, in the case of size, no statistically significant relationship was found, probably due to the lack of differentiation in relation to this magnitude among companies in the sample.
Furthermore, evidence has been found for a relationship (albeit a weak one) between the cost of equity and the amount of risk disclosure: no statistically significant relationship was detected between non-financial risk disclosure and the cost of equity; but a statistically significant relationship was detected between the cost of equity and financial risk disclosure. This relationship is only significant when the date of the audit report is taken as reference for the disclosure. The non significance of the relationship when a later date is taken as reference (the month of June) may be due to the fact that the information was disclosed before that date and prices include the risk disclosure and another type of information that might distort its effect.
It is worth noting that the sign in the detected significant relationship is contrary to that expected in the theory: financial risk disclosure is positively related to the cost of equity (that is, greater disclosure means higher cost of equity). In addition, a relationship with similar characteristics has been detected between the cost of equity and quantitative disclosures of financial risks; that is, the results suggest that markets associate higher risk disclosure or quantitative disclosure with a need for the company to justify higher levels of risk.
The outcomes of this paper must be figured out attending to the following remarks: we have used the model proposed by Gebhardt et al. (2001), to estimate the cost of equity. We have used the analysts' forecasts of future profits in this model, and we have applied it on a sample of Spanish non-financial firms. For future research, it could be interesting to extend the analysis we have done to other countries. By this way, a possible relationship between cost of equity and different degrees of risk disclosure (which depends on national law) could be detected.
References
Abraham, S. and P. Cox (2007). Analysing the determinants of narrative risk information in UK FTSE 100 annual reports. The British Accounting Review 39 (3): 227-248. [ Links ]
American Institute of Certified Public Accountants (1994). Improving Business Reporting: A Customer Focus. New York: AICPA [ Links ]
Amihud, Y. and H. Mendelson (1986). Asset pricing and the bid-ask spread. Journal of Financial Economics 17 (2): 223-249. [ Links ]
Beretta, S. and S. Bozzolan (2004). A framework for the analysis of firm risk communication. The International Journal of Accounting 39 (3): 265-288. [ Links ]
Berk, J. (1995). A critique of size-related anomalies. Review of Financial Studies (Summer): 275-286. [ Links ]
Botosan, C. (1997). Disclosure level and the cost of equity capital. Accounting Review 72 (3): 323-349. [ Links ]
---------- (2006) Disclosure and the cost of capital: what do we know? Accounting and Business Research, International Accounting Policy Forum: 31-40. [ Links ]
---------- and M. A. Plumlee (2002). A re-examination of disclosure level and expected cost of equity capital. Journal of Accounting Research 40 (1): 21-40. [ Links ]
----------, M. A. Plumlee and Y. Xie (2004). The role of information precision in determining the cost of equity capital. Review of Accounting Studies 9 (2 & 3): 233-259. [ Links ]
Bushee, B. and C. Noe (2000). Corporate Disclosure Practices, Institutional Investors, and Stock Return Volatility. Journal of Accounting Research 38 (Supplement): 171-202. [ Links ]
Cabedo, J. D. and J. M. Tirado (2004). The disclosures of risk in financial statements. Accounting Forum 28 (2): 181-200. [ Links ]
---------- and J. M. Tirado (2009). Divulgación de información sobre riesgos: una propuesta para su medición. Innovar Journal 19 (34): 121-134. [ Links ]
Chen, F., B. Jorgenesen and Y. Yoo (2004). Implied cost of equity capital in earnings-based valuation: international evidence. Accounting and Business Research 34 (4): 323-348. [ Links ]
Clarkson, P., J. Guedes and R. Thompson (1996). On the diversification, observability, and measurement of estimation risk. Journal of Financial and Quantitative Analysis 31 (1): 69-84. [ Links ]
Dhaliwal, D., B. Spicer and D. Vickrey (1979). The quality of disclosure and the cost of capital. Journal of Business, Finance & Accounting 6 (2): 245-266. [ Links ]
Diamond, D. and R. Verrecchia (1991). Disclosure, liquidity, and the cost of capital. Journal of Finance 46 (4): 1325-1359. [ Links ]
Easley, D. and M. O'Hara (2004). Information and the cost of capital. Journal of Finance 59 (4): 1552-1583. [ Links ]
Easton, P. D. (2004). PE ratios, PEG ratios, and estimating the implied expected rate of return on equity capital. The Accounting Review 79 (1): 73-95. [ Links ]
Espinosa, M. and M. Trombetta (2007). Disclosure interactions and the cost of equity capital: Evidence from the Spanish continuous market. Journal of Business Finance and Accounting 34 (9 & 10): 1371-1392. [ Links ]
Fama, E.F. and K.R. French (1992). The cross-section of expected stock returns. Journal of Finance 47 (2): 427-465. [ Links ]
Francis, J., R. LaFond, P. Olsson and K. Schipper (2004). Costs of equity and earnings attributes. The Accounting Review 79 (4): 967-1010. [ Links ]
----------, I. K. Khurana and R. Pereira (2005). Disclosure incentives and effects on cost of capital around the world. The Accounting Review 80 (4): 1125-1162. [ Links ]
Frankel, R., M. McNichols and P. Wilson (1995). Discretionary disclosure and external financing. The Accounting Review 70 (1): 135-150. [ Links ]
Gebhardt, W., C. Lee and B. Swaminathan (2001). Toward an implied cost of capital. Journal of Accounting Research 39 (1): 135-176. [ Links ]
George, T., G. Kaul and M. Nimalendran (1991). Estimation of the bid-ask spread and its components: a new approach. The Review of Financial Studies 4 (4): 623-656. [ Links ]
Gietzmann, M. and J. Ireland (2005). Cost of capital, strategic disclosures and accounting choice. Journal of Business Finance & Accounting 32 (3 & 4): 599-634. [ Links ]
---------- and M. Trombetta (2003). Disclosure interactions: Accounting policy choice and voluntary disclosure effects on the cost of raising capital. Accounting and Business Research 33 (3): 187-205. [ Links ]
Gode, D. and P. Mohanram (2003). Inferring the Cost of Capital Using the Ohl-son-Juettner Model. Review of Accounting Studies 8 (4): 399-431. [ Links ]
Greenstein, M. and H. Sami (1994). The impact of the SEC's segment disclosure requirement on bid-ask spreads. The Accounting Review 69 (1): 179-199. [ Links ]
Guo, H. (2003). Quantitative market risk disclosure, bond default risk and the cost of debt: Why value at risk? Baruch College Working Paper. [ Links ]
Hail L. (2002). The impact of voluntary corporate disclosures on the ex-ante cost of capital for Swiss firms. European Accounting Review 11 (4): 741-773. [ Links ]
Healy, P., A. Hutton and K. Palepu (1999). Stock performance and intermediation changes surrounding sustained increases in disclosure. Contemporary Accounting Research 16 (3): 485-520. [ Links ]
Hribar, P. and N. Jenkins (2004). The effect of accounting restatements on earnings revisions and estimated cost of capital. Review of Accounting Studies 9 (2 & 3): 337-356. [ Links ]
Institute of Chartered Accountants in England & Wales (1997). Financial Reporting of Risk: Proposals for a Statement of Business Risk, ICAEW, United Kingdom. [ Links ]
Jorion, P. (2002). How informative are Value-at-Risk disclosures? The Accounting Review 77 (4): 911-931. [ Links ]
Kim, O. and R. Verrecchia (1994). Market Liquidity and Volume Around Earnings Announcements. Journal of Accounting & Economics 17 (1 & 2): 41-67. [ Links ]
Kravet, T.D. and V. Muslu (2013). Textual Risk Disclosures and Investors' Risk Perceptions. Review of Accounting Studies 18 (4): 1088-1122. [ Links ]
Kwok, B. (2003). The effect of mandated market risk disclosures on the quality of information contained in analysts' earnings forecasts, Working Paper, Singapore Management University. [ Links ]
Lajili, K. and D. Zéghal (2003). The disclosure of risk management information in Canadian annual reports, 26th Annual Congress of the European Accounting Association, Seville, Spain. [ Links ]
Lakonishok, J. (1993). Is Beta dead or alive?' in AMIR's (Association for Investment Management and Research) Conference Proceedings. Available at http://www.cfapubs.org/toc/cp.1/1993/1993/6 [ Links ]
Lambert, R., C. Leuz and R. Verrecchia (2009). Information asymmetry, information precision, and the cost of capital, (April) NBER Working paper. [ Links ]
Lang, M. and R. Lundholm (2000). Voluntary disclosure and equity offerings: reducing information asymmetry or hyping the stock? Contemporary Accounting Research 17 (4): 623-662. [ Links ]
Leuz, C. and R. Verrecchia (2000). The economic consequences of increased disclosure. Journal of Accounting Research 38 (3): 91-124. [ Links ]
Linsley, P.M. and P. J. Shrives (2006). Risk reporting: A study of risk disclosures in the annual reports of UK companies. The British Accounting Review 38 (1): 387-404. [ Links ]
Linsmeier, T., D. Thornton, M. Venkatachalam and M. Welker (2002). The effect of mandated market risk disclosure on trading volume sensitivity to interest rate, exchange rate, and commodity price movements. The Accounting Review 77 (2): 343-377. [ Links ]
Liu, Ch., S. Ryan and H. Tan (2004). How banks' value-at-risk disclosures predict their total and priced risk: Effects of bank technical sophistication and learning over time. Review of Accounting Studies 9 (2 & 3): 265-294. [ Links ]
Mikhail, M., B. Walther and R. Willis (2004). Earnings surprises and the cost of equity capital. Journal of Accounting, Auditing and Finance 19 (4): 491-514. [ Links ]
Mohd, E. (2005). Accounting for software development costs and information asymmetry. The Accounting Review 80 (4): 1211-1231. [ Links ]
Mohobbot, A. (2005). Corporate risk reporting practices in annual reports of Japanese companies. Journal of Japanese Association for International Accounting Studies: 113-133.
Nikolaev, V. and L. Van Lent (2005). The endogeneity bias in the relation between cost-of-debt capital and corporate disclosure policy. European Accounting Review 12 (4): 677-724. [ Links ]
Ohlson, J. A. (1995). Earnings, Book Values and Dividends in Equity Valuation. Contemporary Accounting Research 11 (2): 661-687. [ Links ]
---------- and B. Juettner-Nauroth (2000). Expected EPS and EPS Growth as Determinants of Value, Working Paper New York University. [ Links ]
Prodhan, B. and M. Harris (1989). Systematic risk and the discretionary disclosure of geographical segments: an empirical investigation of US multinationals. Journal of Business, Finance & Accounting 16 (4): 467-492. [ Links ]
Rajgopal, S. (1999). Early evidence on the informativeness of SEC's market risk disclosures: The case of commodity price risk exposure of oil and gas producers. The Accounting Review 74 (3): 251-280. [ Links ]
Rakow, K.C. (2010). The effect of management earnings forecast characteristics on cost of equity capital. Advances in Accounting, incorporating Advances in International Accounting 26 (1): 37-46. [ Links ]
Richardson, A. and M. Welker (2001). Social disclosures, financial disclosures and the cost of equity capital. Accounting, Organizations and Society 26 (7 & 8): 597-616. [ Links ]
Securities and Exchange Commission (1997). Disclosure of accounting policies for derivative financial instruments and derivative commodity instruments and disclosure of quantitative and qualitative information about market risk inherent in derivative financial instruments, other financial instruments, and derivative commodity instruments. Release 33-7386, FRR 48, Washington, DC: SEC. [ Links ]
Sengupta, P. (1998). Corporate disclosure quality and the cost of debt. The Accounting Review 73 (4): 459-74. [ Links ]
Solomon, J.F., A. Solomon, S. D. Norton and N. L. Joseph (2000). A conceptual framework for corporate risk disclosure emerging from the agenda for corporate governance reform. The British Accounting Review 32: 447-478. [ Links ]
Verrecchia, R. (1999). Disclosures and the cost of capital: A discussion. Journal of Accounting and Economics 26 (1 & 3): 271-283. [ Links ]
---------- (2001). Essays on Disclosure. Journal of Accounting and Economics 32 (1 & 3): 97-180. [ Links ]
Welker, M. (1995). Disclosure policy, information asymmetry and liquidity in equity markets. Contemporary Accounting Research 11 (2): 801-827. [ Links ]
Woods, M., K. Dowd and C. Humphrey (2008). The Value of Risk Reporting: A Critical Analysis of Value-at-Risk Disclosures in the Banking Sector. International Journal of Financial Services Management 8 (1): 45-64. [ Links ]
1 See Lakonishok (1993).
2 Financial risks have been classified into five categories: interest rate risk, exchange rate risk, commodity risk, credit risk and liquidity risk. Non-financial risks have been classified into seven categories; business risk, strategic risk, compliance risk, information processing risk, integral risk and other risks.

