


Services on Demand
Journal
Article
 English (pdf)
 Article in xml format
 Article references
 Send this article by e-mail
Indicators
-
 Cited by SciELO
 -
 Access statistics
Related links
-
 Similars in
SciELO
Similars in
SciELO
Share

 Permalink
Contaduría y administración
Print version ISSN 0186-1042
Contad. Adm vol.59 n.4 Ciudad de México Oct./Dec. 2014
Performance of the different RAROC models and their relation with the creation of economic value. A study of the largest banks operating in Brazil
El rendimiento de los diferentes modelos de RAROC y su relación con la generación de valor económico. Un estudio de los principales bancos que operan en Brasil
Fabiano Guasti Lima*, Sant Clair de Castro Junior**, Tabajara Pimenta Júnior*** y Luiz Eduardo Gaio****
* University of São Paulo, fabianoguastilima@gmail.com.
** University of São Paulo, santjunior@hotmail.com.
*** University of São Paulo, taba.jr@terra.com.br.
**** University of São Paulo, luiz.gaio@ymail.com.
Fecha de recepción: 19.12.2013
Fecha de aceptación: 11.06.2014
Abstract
This article approaches several different methodologies for calculation of the RAROC (Risk Adjusted Return on Capital) for Brazilian banks. Two questions gave reason to the study: whether the application of different methods for calculation of the RAROC would generate significantly different results?, and checking what is the connection between the RAROC and the generation of economic value, measured by the EVA (Economic Value Added), for the largest banks with operations in Brazil? The following methodologies for verification of the RAROC were applied: Buch's Method (2011); Prokopczuk's Method (2006); Prokopczuk's Method (2006) with application of the VaR technique; Saunders's Method (2007); Chapelle's Method (2008); and the Smithon & Hayt Method (2001), by applying these parametric and non-parametric statistics in order to check the sensibility of the differences between models. This study has evidenced that, when we compare the methodology based on minimum capital with other methodologies, there are no significant differences, except in the few cases indicated. It is important to notice it only occurred in the case of the Bank of Brazil and it was concentrated in the comparison of the Creditmetrics models and in the methodology in which there is equivalence by the reference equity.
Keywords: EVA (Economic Value Added), RAROC (Risk Adjusted Return on Capital), risk capital, banking, Basel accords.
Resumen
El presente artículo se ocupa de diferentes metodologías para el cálculo de RAROC (Rentabilidad Ajustada al Riesgo) para los bancos brasileños. Dos preguntas motivaron el estudio: ¿la aplicación de diferentes métodos para el cálculo del RAROC produciría resultados significativamente diferentes?, y ¿cómo se da la relación entre la RAROC y la generación de valor económico, medido por EVA (Valor Económico Agregado) de los mayores bancos que operan en Brasil? Se aplicaron los siguientes métodos de cálculo RAROC: Modelo Buch (2011); Modelo Prokopczuk (2006); Modelo Prokopczuk (2006), utilizando el VaR; Modelo Saunders (2007); Modelo Chapelle (2008); y modelo Smithon y Hayt (2001), la aplicación de sensibilidad paramétrica y no paramétrica para verificar las diferencias entre los modelos de pruebas estadísticas. Este estudio demostró que en la comparación de la metodología basada en el capital mínimo con otras metodologías, no hay diferencias significativas, excepto en los pocos casos mencionados. Es importante darse cuenta de que esto era sólo para el Banco de Brasil y se centró en la comparación de modelos Creditmetrics y metodología en donde existe la equivalencia entre el patrimonio neto de referencia.
Palabras clave: EVA (Economic Value Added), RAROC (Risk Adjusted Return on Capital), capital de riesgo, banca, acuerdos de Basilea.
Introduction
Several economic crises took place in recent times, largely caused by the poor management of banking leverage. The latest major crisis, which peaked in 2008 and affected several countries, had the excessive banking leverage incompatible with the fair value of assets as one of its causes. That went together with a progressive erosion of the level and quality of the capital base. Monetary authorities were not sufficiently attentive to the fact that banking institutions had been exposed to higher risks than their capital bases would support. Some banks did not have enough reserves to sustain the liquidity of their operations. This was aggravated by the fact that the market started to be suspicious of the solvency and liquidity of banking institutions, thus, the deficiencies of the banking industry were quickly transmitted to the rest of the system (Taylor, 2009).
Since Schumpeter (1911) emphasized the importance of banking industry for the economic development and growth of countries, several studies were conducted, concerning the relationship between the banking industry and the development of companies. Among such studies, Solow (1956) proposed a model that became known as Neoclassical Economic Growth Model, in which he evidences that the driving forces of economic growth are the accumulation of capital, the growth of the workforce and the technological evolution. This latter factor, technological evolution, may be associated in the banking industry sphere to the creation of new products, of innovative operational instruments, and of new administrative parameters, especially concerning risk management.
This article approaches an investigation that involves both ideas commented in the above paragraphs: the idea that global financial crises are intimately connected to the poor management of banking leverage, and the idea that technological evolution applied to banking management is an important factor of economic development.
In other words, this research comes against checking the relevance of accounting information to evaluate the creation of economic value added as has been recognized in the context of fundamental analysis on the capital market as demonstrated by Kothari (2001).
The focus of the study was a banking performance indicator named RAROC (Risk-adjusted Return on Capital). Two questions gave reason to the study: (a) Does the application of different methods for calculation of the RAROC generate significantly different results? What is the connection between the RAROC and the generation of economic value measured by the EVA (Economic Value Added), for the largest banks operating in Brazil?
Banking authority in Brazil and the Basel accord
The Central Bank of Brazil performs the role of authority for financial institutions in Brazil. On August 29th, 2007, the Central Bank published Resolution 3490, approaching the procedures and parameters related to the implementation of the Internal Capital Adequacy Assessment Process to guide the banks with operations in the country. The adequacy of the capital of banks is an essential initiative set forth in Accords Basel II and III, in which the edition of the resolution is proposed, with provisions on the implementation of capital and management structures by the institutions, so that these are able to maintain judicious capital levels, developing and using better techniques in their risk management and monitoring processes, as well as consistently planning their future capital needs (BACEN, 2011).
The recommendation is that banks adopt a prospective position, in the sense of modelling future scenarios, based on the information they have and by using effective models of performance estimates. In order to meet this recommendation, several banks in Europe and in the USA adopted the RAROC methodology as part of the group of necessary frameworks.
The openness provided by the Basel II Committee, in the sense that banks are able to develop internal methodologies for the management of Capital at Risk, does not alleviate the responsibility of banks regarding the control of the Regulatory Capital level. In fact, the accurate calculation of the capital base is, according to Chapelle et al. (2008), a need to manage bank institutions, much more than a mere obligation to be fulfilled by the intensely requested monetary authorities.
The 2008 economic crisis brought up questions concerning the efficiency of regulations and of the supervision proposed in Accords Basel II and III (BIS, 2010). In the sphere of the BIS (Bank for International Settlements), some rules and regulations were discussed, with the purpose of promoting a more resilient banking industry and reducing the risk of contamination of the real economy by the financial. The risk of contamination exists by the activities of banks as credit arbitrators, by their role as funders, liquidity providers and by their payment services. In order to attain both these goals, banks, especially those with international operations should, according to Rymanowska (2006), harmonize parameters and rules, in addition to being transparent in the disclosure of financial information and internal assessment methodologies. They should also watch over the quality of their assets and maintenance of liquid assets sufficient to endure moments of economic crises.
Worthington and West (2001) argue that there is a prospect of a global trend to find new methods to evaluate risk-adjusted returns as the traditional models end up getting overly supported in coming past accounting data and do not take into account the minimum return for the shareholder.
The RAROC Methodology
The adoption of the RAROC as a management tool is a decision to be freely made by each bank. But the definition of given parameters, such as the minimum capital requirement and the disclosure of information on risk are guided and demanded by the Central Bank of Brazil. The RAROC is an indicator adopted by banks worldwide, according to Buch (2011), being also recommended by the BIS. Its standard formula created by Bankers Trust is given below:
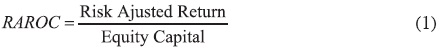
Equation 1 shows that the RAROC is the ratio between a risk-adjusted return measurement and the measurement of capital allocated. Despite the Basel Accords guidelines, several studies and proposals emerged, addressing which would be the best return and capital measurements to be employed in the calculation of the RAROC.
The originally proposed formula considered the equity capital as the capital of choice. But the Basel Committee designated present equity as the denominator of the RAROC formula, and Reference Assets. And the Committee also established that it should be composed of two types of bank capital: Level I Capital and Level II Capital, which sum expresses the total capital composing the different types of portfolios operated by the bank. Level I capital is the capital reserved to contrapose the regular course portfolio, while Level II capital considers the assessment reserves and subordinate debts.
Prokopczuk (2004) proposed other return and capital measurements for calculation of the RAROC. He questions the original formulation, as he understands the expected return is the best risk-adjusted return measurement, since the expected losses have already been considered in his estimate, and it is consequently adjusted to risk. He also questions the use of equity capital in accounting measurement, as he understands that capital should be verified for its fair value, named economic value. Thus, the formula proposed by Prokopczuk is:

Economic Capital, according to Prokopczuk (2004), is not the required regulatory capital or the accounting equity capital, but the amount of Money necessary to ensure the survival of the bank in the worst possible scenario. The use of an auxiliary VaR (Value at Risk) model capable of measuring the maximum capital amount that could be lost in a given period was proposed for the calculation, under a given statistic confidence level.
The Central Bank of Brazil suggests the use of the CreditMetrics method to calculate the VaR, but does not prevent banks from adopting a different model. Considering 252 business days in a year and adopting a vertex Pi for the moment, the VaR is calculated as follows:

Where:
Pi: vertex considered for purposes of cash flow clustering, as per procedure described below.
VMTMi,j: algebraic sum, either positive or negative, in reais, of the cash flow values marked-to-market on the day, and allocated at vertex Pi;
D: number of business days judged necessary for liquidation of the position,
σi,t: Standard volatility for time i and day t,
ρi,j: Correlation between vertexes i and j.
The expression. For calculation of the RAROC, when the VaR is considered as the capital, it is given by:

Another variation for calculation of the RAROC is the method proposed by Saunders (2007). It correlates the RAROC to the duration of credit positions. The calculation is given by:

Where:
AR: is the annual return by monetary unit borrowed;
UL: is the unexpected loss rate;
LGD: is the percentage of loss for default.
Chapelle et al. (2008) proposed the calculation of the RAROC as a ratio between the economic profit and the economic capital, given by:

In equation 6 the Economic Capital has the same meaning given by Prokopczuk (2004) and adopted in the calculation of the RAROC given by equation 2. Economic Profit is, according to Chapelle et. al. (2008), calculated by:
Economic Profit = Spread + Addtitional Rates + PDD - EL-Costs (7)
Where:
Spread: is the difference between funding and investment rates (loans);
Additional Rates: other rates that add to the basic spread rate;
PDD: Provision for Doubtful Debts;
EL: Expected Loss;
Costs: Bank's operational costs.
Equation 6 can be summarized as:

For calculation of the RAROC based on equation 8 the regular course portfolio is considered, that means, Level I Capital and the expenses from this portfolio.
The BIS recommends that the calculation of the Economic Capital (equation 8) is done by means of a methodology named IRB (Internal Rating Basel). By this methodology, the economic capital is represented by a beta distribution which mean is equal to the expected loss and the standard deviation is equal to the unexpected loss. The Basel Accord established that the economic capital is given by a multiple of the unexpected loss, as per the expression:
Economic Capitaln,t = 12 x ULn,t (9)
As the unexpected loss (ULn,t) is the standard deviation for the expected loss (ELn,t), its value can be determined by the expression:

Where:
ULn,t: Unexpected loss of portfolio n at moment t;
ΠDn,t: Product from the expected values of discrete random variable Dn,t;
Dn,t : Variable that will assume value 1 in case of default in time t, and value zero if otherwise;
LGDn,t: Loss Given Default
EADn,t: Capital exposed to a condition of default (Exposure At Default);
Smithon and Hayt (2001) proposed a way to calculate the RAROC as a ration between risk-adjusted capital and economic capital, as per the expression:

Where:
The Risk-Adjusted Return is given by:
Risk Adjested Return = Receitas-Provisões-Tributos-Ajustes Capital (12)
And the Economic Capital is given by:
Economic Capital = Capital sob Risco de Crédito, Operacional e de Mercado (13)
The RAROC and the generation of economic value
Contrary to classic financial performance indicators, the EVA (Economic Value Added) is a type of economic performance indicator that provided good parameters on which high management and investors can base to learn about the evolution of the economic value in the organization. According to Santos and Watanabe (2005), economist Alfred Marshall had already written, in 1890: "What remains of his profits [from owners to managers] after deducting interest on his capital at the current rate (allowing, where necessary, for insurance) is generally called his earnings of undertaking or management".
The EVA is an economic profit measurement which, according to Stewart (2005), subtracts the capital cost from the operating profits generated in an enterprise. For the researcher, the operational area may take a number of individual initiatives to create market value (financial/economic), but all of them should at a certain point, fall into one of the three categories measured by the EVA: if operating profits can be incremented without insertions of any other capital; if other capital is invested in other projects that produce more than the total cost of capital; and if the capital is diverted or removed from negotiable activities that do not cover their own costs of capital. This methodology of calculation of EVA from the RAROC model was also successfully employed by Naimy (2012) in Lebanese banks.
The EVA is calculated as per the expression:
EVA = NOPAT -(WACC x Invested Capital) (14)
Where:
NOPAT: is the operating result after tax adjustments (Net Operating Profit After Taxes);
WACC: is the Weighted Average Cost of Capital;
Invested Capital: is the capital invested in operating assets and requires explicit financial earnings.
The two indicators, RAROC and EVA, are performance measurements significant for the strategic management of financial and non-financial organizations. The ratio between both indicators can be given by the following expressions, according to Goldfarb (2010):

However, for financial institutions, the risk-adjusted return measured as a financial value and not as a rate may be matched to the NOPAT. Thus, equation 15 becomes:

Then:
NOPAT = RAROC x Risk Adjusted Capital (17)
Assuming that, for financial institutions, the Invested Capital indicated in equation 14 can be considered equivalent to the Risk Adjusted Capital and assuming that in equation 14 the NOPAT is given by equation 17, the EVA value can be obtained through the expression:
EVA = (RAROC - WACC) x Risk Adjusted Capital (18)
Naimy (2012) states that although it may be simple compared to that when the RAROC exceeds the cost of capital has been adding value, there is evidence that this result shows that although there are different approaches to measuring the RAROC they can be considerably different.
After the several models for calculation of the RAROC have been presented, as well as the ratio [nota revisor.- Ver nota anterior] existing between this measurement and the EVA, the next session will present the results of the calculation of both performance indicators for the largest banks operating in Brazil.
Results
The RAROC calculation for the largest banks with operations in Brazil (Bank of Brazil, Bradesco, Itaú and Santander) was based on the seven models presented: (a) Buch's Method (2011); (b) Prokopczuk's Method (2006); (c) Prokopczuk's Method (2006) with use of the VaR; (d) Saunders' Method (2007); (e) Chapelle's Method (2008); and (f) Smithon & Hayt's Method (2001). The results obtained can be observed in the tables 1 (2, 3, 4) to 5 presented next.
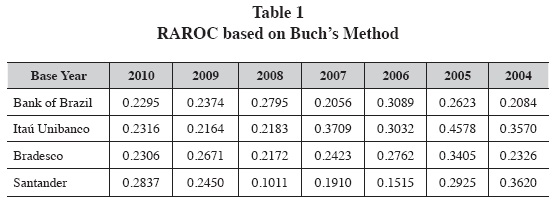
The values in table 1 represent the model chosen as benchmark in this study, and were used as the methodology in the calculation of the Minimum Capital Requirement, as the minimum capital base a bank must have in order to face risks. The use of this method is justified by the fact it meets the recommendations of the Basel Committee, which means the bank shall not have a capital base inferior to the one provided in this methodology.

Each bank uses a different methodology for calculation of the VaR. These methodologies are validated by following features consolidated by the financial market and these features are explained by the risk reports of banks.
It is important to notice that, in some cases, the internal VaR was calculated for a 10-day horizon; in order to obtain the alignment of data, we calculated the conversion for a business day and a 99% confidence interval. The reliability of the model used is confirmed by the use of the Backtest technique, in which the daily actual losses and earnings are compared with the percentage of cases in which the result was off the pre-established limits for maximum loss and the result was satisfying, as observed in the risk reports charts.

The theory used for calculation of the RAROC in this variation of the methodology follows the same proposal by Prokopczuk (2004), however the CreditmetricsTM method is used as a basis for calculation of the VaR. In this methodology the calculation of the RAROC makes use of the market risk information published by the BACEN; for the calculations above the vertex was one business day with 99% of significance. If the Normal chart is used, the value adopted for calculation is 2.33, considering 252 business days and the fact that each vertex features 20 days of interval, and adopting the median as the day for liquidation.

The methodology presented by Saunders (2007, p.221) for calculation of the RAROC, bases on the duration of the loan, is used with the calculation of the ratio between the earnings and the total portfolio, from which the earnings of a year by borrowed dollar is given, divided by the product of the unexpected loss rate, the number of business days and the proportions lost by default.

This model uses the Level I Capital, which is the capital reserved to contrapose the regular course portfolio. Therefore, in order to analyze an operation without considering assessment reserves and subordinate debts (items present in Level II Capital) it is necessary to take Level I Capital as the Economic Capital Reserve.
This calculation was found in the risk report of some banks; also, the calculation of the RAROC based on the Level I Capital is defined as the RAROC based on a regular course portfolio.

The RAROC by the basic method of return on capital at risk was calculated according to the Smithson and Hayt (2001) equation, which considers a risk-adjusted return divided by the economic capital. Knowing that the Net Equity is the resulting equity of a company, it is not different in the case a banking institution; the NE is not different, the NE is the total equity that is at risk in the operations made by the bank; in this calculation, the Net Equity is adopted as Economic Capital.
The results of the RAROC calculations were analyzed by using three different statistic tests: (a) Parametric test of Difference between Means; (b) Non-parametric Wilcoxon test; (c) Non-parametric Mann Whitney test. Results can be observed in tables 7, (8) and 9 as follows:


The parametric test of differences between means applied in the banks researched shows that the vast majority of the RAROC methodologies do not present significant differences in result when compared to the minimum capital requirement methodology. Only the calculations made for the Bank of Brazil and Bradesco presented a small difference. In the test conducted for the Bank of Brazil, the difference in the methodologies for Calculation of the RAROC presented differences when comparing the methodology of the Minimum Capital requirement and the RAROC methodologies with the CreditMetricsTM, the Basic Model For Return and the Net Equity Equivalence Method; as for the case of Bradesco, only upon comparing the Benchmark model with the PR equivalence model we notice a little difference when we observe the p-value; such small differences when we observe that the p-value is (0.00826), being very close to 0.01, since it would be interpreted as if there was no difference between methodologies. That occurs in the Bank of Brazil cases addressed in the beginning of the paragraph, and the existing difference is very small, as the p-value is also very close to 0.01.
The test showed that, among all the banks, there was no significant statistic difference, with 5% of significance between the calculation methodology based on minimum capital and the other methodologies in the study.
The results show there is no significant statistic difference among results, by the use of different methodologies for calculation of the RAROC. It does not occur only for the Bank of Brazil in the case of the CreditMetricsTM models and in the PR equivalence methodology. For all the other cases it was not possible to notice statistically significant differences in the methodologies of calculation of the RAROC for the banks selected for the research.
Conclusions
The fact that banking institutions play an extremely important role in economy caused the definition of rules by the monetary authority, in order to prevent the banks from taking risks higher than their capacity to cope with them. Among the rules, a minimum capital base was defined for each bank, in connection with the portfolio of credit assets and others.
The research worked with the hypothesis of using the RAROC calculation methodology as an efficient methodology regarding investment assessment (RAROC ex-ant) or for performance analysis (RAROC ex-post). For that, different methodologies were studied for calculation of the RAROC, in which all of them preserve the original idea of calculating the Return in relation to the capital base, but with some differences in relation to what is considered as capital base and different ways to verify the return.
This study evidenced that when the methodology based on minimum capital requirements is compared to other methodologies, there are no significant differences, except in the few cases pointed out. It is important to notice that it occurred only in the case of the Bank of Brazil and was concentrated in the comparison of the CreditMetrics+ models and in the methodology in which there is equivalence by the reference equity.
There was no significant difference among models for the non-parametric Wilcoxon test, and the only difference was found in the parametric tests of the difference of means and in the non-parametric Mann-Whitney test, which gives us assurance in relation to the methodology adopted in the calculation of the RAROC.
Considering that there is "soundness" in the methodology adopted as benchmark in this research, it was possible to calculate the actual value added in the operations during the years researched. It is worthwhile emphasizing that this value added (EVA) is demonstrated as a percent of the capital base of each bank.
The calculation of the EVA by means of the RAROC is not a usual methodology in the academic world; only a few researchers demonstrate this ratio. This research also intended to evidence that the RAROC may be seen as a consistent alternative for calculation of the EVA of the operations of financial institutions.
However, this subject deserves in-depth study and, as a suggestion for future works, it would be interesting to make a comparison between the EVA verified by the RAROC methodology and the EVA verified by the traditional model. Similar results were also found in the paper of Naimy (2012) for the Lebanese banks.
References
Banco Central do Brasil, (2011), BACEN. Implementação de estrutura de gestão de capital. Audiência Pública n°36. Brasília. Disponível em: <https://www3. bcb.gov.br/audpub/edital/ExibeEdital.jsp?edt=49>. Acessoem 08/12/11. [ Links ]
Basel Committee on Banking Supervision, (2010). BIS. Basel III: A global regulatory framework for more resilient banks and banking systems. Switzerland: Disponívelem: <http://www.bis.org/publ/bcbs189.htm>. Acessoem 08/12/11. [ Links ]
Buch, A. and G. Dorfleitner (2011). Risk capital allocation for RORAC optimization. Journal of Banking and Finance 45: 3001-3009. [ Links ]
Chapelle, A., Y. Crama, G. Hübner and J. Peters (2008). Practical methods for measuring and managing operational risk in the financial sector: a clinical study. Journal of Banking and Finance 32: 1049-1061. [ Links ]
Goldfarb, R. (2010). Risk-adjusted performance measurement for P & C insurance companies. Working Paper. Disponível em: <http://www.casact.org/library/ studynotes/Goldfarb2010.pdf>. Acesso em: 08/12/11. [ Links ]
Kothari, S. P. (2001). Capital markets research in accounting. Journal of Accounting and Economics 31: 105-231. [ Links ]
Naimy, V. Y. (2012). The RAROC as an alternative model of analysing the Lebanese Bank's performance and capital allocation. Journal of Business and Financial Affairs 1: 1-5. [ Links ]
Prokopczuk, M., S. Rachev and S. Truck (2004). Quantifying risk in the electricity business: a RAROC based approach. Journal of Energy Economics 29: 1033-1049. [ Links ]
Rymanowska, P. (2006). The Basel I and Basel II accords: comparison of the models and economical conclusions.2006. Dissertação de Mestrado, Department of Mathematics. Vrije Universiteit of Amsterdam. Holland, Amsterdam. [ Links ]
Santos, J. O. and R. Watanabe (2005). Uma análise da correlação entre o EVA e o MVA no contexto das empresas brasileiras de capital aberto. Caderno de Pesquisas em Administração 12 (1): 19-32. [ Links ]
Saunders, A. (2007). Administração de instituições financeiras. São Paulo: Atlas. [ Links ]
Schumpeter, J. (1911). The theory of economic development. USA: Harvard University Press. [ Links ]
Smithson, C. and G. Hayt (2001). Optimizing the allocation of capital. RMA Journal: 67-7. Disponivelem:<http://www.rutterassociates.com/pdf/5%20Implementing%20New%20Approaches%20(RMA%20Oct%202001).pdf>. Acesoem: 08/12/11. [ Links ]
Solow, R. A. (1956). Contribution to the theory of economic growth. Quarterly Journal of Economics 70: 65-94. [ Links ]
Stewart, G. B. (2005). Em busca do valor: o guia de EVA para estrategistas. Porto Alegre: Bookman, 2005. [ Links ]
Taylor, J. T. (2009). The financial crisis and the policy responses: an empirical analysis of what went wrong. NBER Working Paper. Cambridge, MA: National Bureau of Economic Research, 2009. Disponível em: <http://www.nber.org/papers/w14631>. Acesso em: 08/12/11. [ Links ]
Worthington, A. and T. West (2001). Economic Value-Added: A Review of the Theoretical and Empirical Literature. Asian Review of Accounting 9 (1): 67-86. [ Links ]

