


Serviços Personalizados
Journal
Artigo
 Inglês (pdf)
 Artigo em XML
 Referências do artigo
 Enviar este artigo por email
Indicadores
-
 Citado por SciELO
 -
 Acessos
Links relacionados
-
 Similares em
SciELO
Similares em
SciELO
Compartilhar

 Permalink
Contaduría y administración
versão impressa ISSN 0186-1042
Contad. Adm vol.58 no.2 Ciudad de México Abr./Jun. 2013
EBITDA1 margin in brazilian companies. Variance decomposition and hierarchical effects
Margen de EBITDA en las empresas brasileñas. Descomposición de la varianza y efectos jerárquicos
Margem EBITDA em companhias brasileiras. Decomposição de variância e efeitos hierárquicos
Adriano Alcalde*, Luiz Paulo Lopes Fávero** y Renata Turola Takamatsu***
* University of São Paulo. adrianoalcalde@gmail.com.
** University of São Paulo. lpfavero@usp.br.
*** University of São Paulo. rettakamatsu@gmail.com.
Fecha de recepción: 31.08.2011.
Fecha de aceptación: 24.11.2011.
Abstract
This study explores the controversy between the business and academic perspectives regarding earnings before interest, taxes, depreciation, and amortization (EBITDA). Some authors argue that EBITDA is not useful as an indicator, except for comparing companies within the same sector (Assaf Neto, 2003, McClure, 2006, Stumpp, 2000). On the other hand, the business world strongly uses this type of indicator as a tool to support its decisions (Schmalensee, 1985, Moraes, 2005). This difference in opinions has aroused interest in understanding the reasons for its use and has raised questions regarding the usefulness of EBITDA for comparing companies from both the same and different sectors. By applying Hierarchical Linear Modeling (HLM), the main goal of this research is to observe EBITDA behavior across companies selling goods in Brazil, comparing them within the same sector and across different sectors over time. This research allows for the analysis of the reasons why EBITDA patterns occasionally occur. The results show significant variation in EBITDA among companies across the same sector and across companies from different sectors. On the other hand, our results have shown, nevertheless, that the variability among companies from the same sector was the highest one, raising questions on the actual usefulness of this indicator to compare companies from the same sector.
Keywords: EBITDA, hierarchical effects, Brazil.
Resumen
Este estudio explora la controversia entre las perspectivas de negocio y académicas con respecto al uso de EBITDA. Algunos autores sugieren que este indicador es de poca utilidad, salvo para comparar empresas del mismo segmento (Assaf Neto, 2003; McClure, 2006; Stumpp, 2000), aunque algunas empresas utilizan este indicador en sus decisiones (Schmalensee, 1985; Moraes, 2005). Esta diferencia de opinión ha despertado el interés en la comprensión de las razones de su uso y su utilidad para comparar empresas de diferentes sectores a través de la aplicación de modelos jerárquicos lineales, o HLM (Hierarchical Linear Modeling). El principal objetivo de este estudio es observar el comportamiento de EBITDA de las compañías en el mercado brasileño desde el mismo sector o no, con el tiempo, que permite analizar las razones por las cualses las diferencias se producen. Los resultados muestran que existe una variabilidad significativa en el EBITDA entre empresas del mismo sector y entre empresas de diferentes sectores. Por otro lado, nuestros resultados también mostraron que la primera variación fue mayor o que plantea dudas sobre la utilidad de este indicador para la comparación de empresas similares.
Palabras clave: EBITDA, efectos jerárquicos, Brasil.
Resumo
Este estudo explora a controvérsia existente entre o meio empresarial e o meio acadêmico, no tocante à utilização do EBITDA. Alguns autores acadêmicos apontam que este indicador tem pouca utilidade, a não ser para comparar empresas de um mesmo segmento (Assaf Neto, 2003, McClure, 2006, Stumpp, 2000); por outro lado, o meio empresarial utiliza fortemente este indicador para embasar diversas de suas decisões (Schmalensee, 1985, Moraes, 2005). Esta diferença de opiniões despertou o interesse em entender as razões para a sua utilização e, em um aprofundamento maior, observar a utilidade do EBITDA para a comparação de empresas provenientes de um mesmo setor e de setores diferentes. Por meio da aplicação da Modelagem Hierárquica Linear, ou HLM (Hierarchical Linear Modeling), o principal objetivo deste trabalho consiste em observar os comportamentos dos EBITDAs de empresas atuantes no mercado brasileiro provenientes de um mesmo setor e de setores diferentes, ao longo do tempo, o que torna possível analisar as razões por meio das quais eventuais diferenças ocorrem. Os resultados mostram que há uma variabilidade significativa do EBITDA entre firmas advindas de um mesmo setor e entre empresas provenientes de setores diferentes. Por outro lado, nossos resultados mostraram ainda, que a primeira variabilidade foi a mais elevada, levantando questões acerca da real utilidade desse indicador para fins de comparação de empresas do mesmo setor.
Palavras chave: EBITDA, efeitos hierárquicos, Brasil.
Introduction
In the business world, the presence of parameters and metrics allows managers to evaluate a firm's financial situation. Notwithstanding its broad scope of use, no single and definitive recipe exists that shows what indicators should be used and in what circumstances. Expanding the issue of financial indicators from the business to the academic world, a very large area exists for research on the application and usefulness of the different indicators. In Brazil, the work by Assaf Neto (2003) and Cristiano and Sachuk (2004) stands out, demonstrating financial indicators' ability to reflect firm's performance.
The number of financial indicators and the freedom to use them might suggest greater certainty in understanding a business. However, some care should be taken to avoid excessive confidence, which can entail mistaken decisions, causing damage or losses to those relying on the information. As Assaf Neto (2003) affirms, care should be taken not to study an isolated ratio, especially if it will be the basis of subsequent decisions and conclusions, without first verifying the behavior of related indicators. Even when analyzing a group of complementary indicators, the indicators should be compared over time and within sectors.
Concerning the care that should be taken when using financial indicators, Assaf Neto (2003) also affirms that company analysis should be made based on indicators for the last three years at least, with a view to the analysis dynamics and to confirm whether management goals were reached. Sectoral comparison involves confronting the company indicators in question against those of its competitors' and, finally, comparing them to average market indicators.
According to Vasconcelos (2001a), the search for economic and financial indicators to support the decision process has increased recently. Foreseeing the behavior of equity elements imposes the analysis of environmental phenomena. Although environmental dynamics are responsible for generating market patterns, each company has its behavioral peculiarities, resulting from a complex set of logical relations that go beyond the internal organizational environment.
This research analyzes the behavior of earnings before interest, taxes, depreciation, and amortization (EBITDA) for companies selling goods in Brazil, from a sectoral and temporal perspective. Despite the fact that EBITDA is widely calculated and used in the business context, its true informative efficacy is the subject of much discussion. While some authors claim there are advantages in using performance measures related to its ability to compare similar companies in the same sector (Vasconcelos, 2001a; McClure, 2006; Santana and Lima, 2004; Stumpp, 2000), others dispute EBITDA true informative capacity (Stumpp, 2000; McClure, 2006; Malvessi (2006).
The main goal of this study is to evaluate EBITDA behavior over time for companies from the same sector and different sectors, discussing the reasons for possible discrepancies. The answers can indicate whether EBITDA can usefully be used to compare similar companies within the same sector. In line with the research aims, four questions are proposed:
1) Do significant differences in the EBITDA margin exist among companies from the same sector over time?
2) Do significant differences in the EBITDA margin exist among companies from different sectors over time?
3) Does time exert significant influences on the EBITDA margin in companies from the same sector and from distinct sectors?
When seeking evidence on the EBITDA margin behavior as a function of time, company characteristics and sectoral influences, the intent is to discover whether there are differences in the indicator that results from these variables' effects, beyond ratifying the utility of the indicator in comparing companies.
The method used is the Hierarchical Linear Modeling (HLM) one, which, according to Gelman (2006), is a generalization of regression methods. As such, it can be used for a range of purposes, including prediction, data reduction and causal inferences on experiments, and observational studies. Its main advantage is to allow for the analysis of individual variance components at each analysis level of a research; in this case the levels are time, companies, and sectors.
Literature review: EBITDA
According to Greenberg (1998), EBITDA emerged as an indicator in the 1960s, but only entered into popular usage as a result of the leveraged buyouts in the 1980s. In this line McClure (2006), states that EBITDA became prominent in the mid 1980s. It was frequently used as a tool to assess cable TV and media companies that were more highly leveraged, in which real gains were hard to come by. It also became particularly popular in companies that gained control over other companies.
For similar reasons, banks promoted EBITDA as a tool to determine whether a company could cover its liabilities over a one-to-two-year term. Thus, the use of EBITDA extended to a wide business range. Its advocates argue that it more clearly reflects operations by excluding expenses that obscure the way the company is truly performing (McClure, 2006).
According to Martins (1998), the EBITDA concept simply corresponds to the cash that operational assets really produce. This constitutes profit before interest rates (both financial gains and expenses), income tax and social contribution on income, and before depreciations and amortizations. It therefore corresponds to the potential cash a company's operational assets are capable of producing, even before considering the cost of any capital. Thus, as Strischek (2001) discusses, EBITDA does not correspond to the physically produced cash flow, as sales are not commonly received in cash and neither are expenses. It represents the cash flow that the assets produce, even before considering financial revenues and expenses, after receiving all revenues, and after paying for all expenses.
Controversy surrounds the use of EBITDA. On the one hand, a large majority of the business market adopts EBITDA as a fundamental indicator for a range of decision making. On the other hand, academic research has shown that the informative capacity of the indicator is limited. Many authors have expressed doubts regarding its efficacy, while others have defended it. This duality of opinion aroused interest in studying this indicator in greater depth, primarily focusing on investigating the use of the EBITDA margin for inter-company comparison.
EBITDA use
According to some authors, EBITDA can be used to display a company's operating performance. Greenberg (1998) indicates that EBITDA supposedly offers a clearer image of company operations by removing expenses that can distort the actual quality of businesses' performance. Vasconcelos (2001b) argues that EBITDA reveals a company's performance and the extent to which company's revenues covers financial expenses, in addition to reflect adopted market strategies. Coelho (2004) argues that EBITDA measures the efficiency of an undertaking by its cash-generating potential, ignoring the asset and liability structure and the fiscal effects.
According to Coelho (2004), one cannot mix up EBITDA with cash production, as EBITDA does not correspond to the actual physical cash flow that has already occurred in the period. This is because a portion of the sales may not have been received and a portion of the expenses may not have been paid for. Thus, even if many operational cash production variables are in sync with EBITDA, investment expenses and variations in working capital needs are not included in this indicator. Moreover, companies can naturally be divided to lever their operations, which can often generate higher expenses than revenues.
Among authors who defend the idea of proximity between EBITDA and cash flow, Smith (2002) argues that the indicator can be used as a shortcut to estimate the cash flow available to pay for long-term debt on assets, such as equipment and other items with a time horizon measured in decades instead of years.
Some authors believe that EBITDA can complement financial statement analyses, as these do not grant the user a complete view regarding the general condition of a business, according to Vasconcelos (2001b) and Santana and Lima (2004). They suggest that EBITDA's information value can contribute more and is more significant when used in combination with other techniques and other indicators to form an analysis of the business.
The joint use of multiple indicators is beneficial because, although a company may display a positive EBITDA in a given period, part of this result could be the result of an onerous liability, and part could be composed of term revenues. On the other hand, a given company can show a negative EBITDA but, when viewed over time, one might see a trend towards recovery.
Opinions are also divided on the use of EBITDA as a tool for investment decision making. While some authors argue that the indicator is useful for this analysis too, others maintain that investment decisions based on EBITDA may result in losses. Hawkins (2003) defends the use of this indicator for investment decisions, affirming that, in industries with little need for immobilized assets and with low change perspectives, the EBITDA multiple can be very useful. Malvessi (2006) adds that brokers calculate the Market Value plus Net Indebtedness /EBITDA formula as an important financial indicator in investment decisions.
Santos (2000) also suggests that the EBITDA percentage variation between one year and another shows investors a trend about whether a company is improving its efficiency or enhancing its productivity. On the other hand, authors who condemn the use of EBITDA in investment decisions, such as Stumpp (2000) and McClure (2006), maintain that the indicator alone is an insufficient measure when comparing multiples in purchasing decisions.
EBITDA limitations
According to some authors, including Veríssimo (2006), some of the criticism against EBITDA refers to the income statement format itself. Greenberg (1998) and Malvessi (2006) state that the method is simple and fast to calculate. According to Smith (2002), the exclusion of interest rates, taxes, depreciation, and amortization when calculating EBITDA is realized to consider long-term asset costs allowing analysis of remaining profits after considering all those costs.
Coelho (2004), on the other hand, questions whether the accounting theoretical framework would support EBITDA estimation. In this line, McClure (2006) believes that the EBITDA calculation does not take into account some generally accepted accounting principles. By the same note, Icó and Braga (2001) say that omitted information in bookkeeping makes it impossible for EBITDA to express the entity value as a whole and, consequently, results may seem distorted from a technical-accounting viewpoint.
In line with Santana and Lima (2004), due to its composition and nature, EBITDA is sensitive to inventory assessment, especially when the analysis aims to estimate a company's market value. Despite this weakness, the authors argue that, because it ignores financial revenues and expenses, EBITDA eliminates, for analysis purposes, any difficulty from an occasional exchange rate devaluation that might arise.
Many authors criticize the use of EBITDA due to its vulnerability to manipulation. According to Stumpp (2000), EBITDA can be easily manipulated through aggressive accounting policies for revenue and expense recognition, asset writeoffs, and adjustments related to the depreciation calendar. Coelho (2004) believes that some companies often manipulate EBITDA. The author believes further that its efficacy closely depends on the reliability of processed data and on managers' ability to use their good sense when elaborating the analysis. According to Smith (2002), if fraudulent accounting techniques are used to inflate revenues and interest rates, taxes, depreciation, and amortization, almost all companies will seem to be in a better condition. Finally, Santos (2000) comments that a manipulation hypothesis was confirmed by Worldcom scandal, wherein the company acknowledged that $7 billion in operating expenses were claimed as capital investments. This accounting manipulation provoked a profound distortion in reporting profits and, consequently, increased EBITDA.
Most criticism against EBITDA argues that one of its major weaknesses is its informative capacity. This criticism states that EBITDA presents different kinds of problems, such as sensitivity to inventory criteria shifts and an inability to forecast changes in working capital. Moreover, it ignores variations in accounting methods, cash needs, and the need to pay debts. On top of this, it provides limited information regarding earnings quality.
EBITDA also ignores changes in and the need for working capital to enhance investments and receivables to support sales growth. Also, it does not consider the need for cash with a view to covering daily operations (Stumpp, 2000; McClure, 2006). According to Smith (2002), if investors do not consider changes in working capital in their analyses and rely only on EBITDA, they may not see the indications that a company is losing money through lack of sales.
According to Malvessi (2006), EBITDA does not cover fundamental factors of a business's financial performance, such as the connections between use of the capital employed by the company and the stockholder's opportunity cost. EBITDA totally ignores cash needs with a view to the growth of receivables and inventories. According to White, Sondhi and Fried (1997), EBITDA does not consider the cash that networking capital requires either. Frezatti and Aguiar (2007) suggest that, when possible, a cash flow indicator should replace EBITDA to analyze not only the operational cash flow, but also the flow of investments, stockholders, and funding. In the same sense, McClure (2006) affirms that the indicator does not consider all aspects of a business as it ignores important cash items. Further, even if a certain company reaches its balance point based on EBITDA, it will not generate sufficient cash to replace the assets as the business uses them. Moreover, Santos (2000) argues that EBITDA does not consider changes in working capital either; hence, it overvalues the cash flow when this capital increases. This may result in a false perspective on the company's actual liquidity.
Smith (2002) points out that EBITDA's bad reputation results rather from excessive exposure and improper use than from any other reason, arguing that it should not be used as an indicator that attends to all situations, considering that it is not perfect for the purposes of assessing profitability. Like any other measure, EBITDA is but one indicator; developing a complete panoramic view of any organization requires taking other parameters into account.
According to Coelho (2004) EBITDA started being adjusted by removing nonrecurring expenses indiscriminately, leading to a distancing from its original objective. In addition, Hawkins (2003), for example, criticizes the use of EBITDA in company evaluation since the informative power of this indicator suffers interferences from country political changes, technological alterations and changes in business practices, fluctuations in exchange rates for industries that export products or import raw material, contract expiration or gaps in patent protection, and so on. While EBITDA is considered by many to be an exact measure of company value, it is widely understood as a mere tool that helps analysts and researchers to study a business and decide whether the business should be analyzed further.
EBITDA to compare companies
Using EBITDA to compare companies is one of the main focuses of this research and, among the uses discussed in the literature, it is one of the most frequently researched. The EBITDA indicator is an alternative method of analysis for companies with large investments that are incurring losses. According to Coelho (2004), EBITDA's essence is not numerically precise, but it is related to information timeliness and comparability. While McClure (2006) affirms that EBITDA can be used to analyze and compare profitability among companies and industries, Santos (2000) indicates that, because it eliminates the effects of funding and decisions that are purely concerned with accounting, EBITDA can provide a good comparative analysis as it measures business productivity and efficiency. Likewise, Santana and Lima (2004) suggest that, because it discloses business feasibility by verifying efficiency and productivity, EBITDA can serve as the basis for company assessment and comparison.
On the other hand, some authors argue that global comparison is not one of the virtues of this indicator. Stumpp (2000) points out that EBITDA is not a common denominator for accounting conventions between different countries, and ignores distinctions in cash flow quality resulting from different accounting policies. He also argues that not all revenues are in cash. According to White, Sondhi and Fried (1997) and Santos (2000), EBTIDA ignores the variation in accounting methods and, thus, does not take into account existing distinctions in the quality of cash flows resulting from different accounting practices.
With regard to the comparison of companies within the same sector, many authors agree that EBITDA is a useful tool for comparison. According to Vasconcelos (2001a) and Santana and Lima (2004), EBITDA can be considered a financial benchmark for inter-company comparison. As the first author discusses, the indicator reveals business feasibility, so it can be considered a barometer of efficiency and productivity.
Market analysts also tend to recommend businesses with companies showing a positive EBITDA. After all, the greater the company's resource production through operations, the more attractive its business becomes, especially when comparing the total EBTDA reached to investment volume in company's operation.
One of the questions regarding the use of EBITDA as a financial indicator is based on its sectoral adequacy. In other words, is the indicator's adherence, that is, its informative capacity, better in some industrial sectors than others? Some authors advocate the use of the indicator in sectors that include companies that need assets with a long useful life and intense use. This is in line with Stumpp (2000), who argues that EBITDA is a good tool for companies whose assets have a shorter useful life or for companies in sectors that face many technological changes. Favaro (2004) indicates that, except for companies whose principal business is knowledge production, the items excluded from the EBITDA (particularly fixed asset purchases) exert great influence on economic profitability —a profitability measure that considers capital cost. Along the same line, Santos (2000) argues that EBITDA is an excellent measurement tool for organizations that use their equipment intensively, that is, with a minimum time horizon of 20 years of use.
Research design and data
As Gavin (2004) affirms, organizational sciences have recently witnessed a growing interest in models that take into account the hierarchical nature of data. According to Schmalensee (1985), Mauri and Michaels (1998), Brito and Vasconcelos (2004), and Fávero (2008), there are many situations with a hierarchical structure. Hierarchies correspond to the idea according to which subjects who belong to the same group share a set of stimuli that enhance homogeneity. Hierarchical modeling popularity is increasing among statistical techniques applied by researchers in social sciences. However, it is relatively new in finance and accounting papers. The method is powerful for analyzing data in which observations are clustered into higher-level organizations (Dong and Stettler, 2011).
In this study, company clusters by sectors are assessed over time. A three-level hierarchical model with repeated measures will be applied. As discussed above, EBITDA analysis is stronger when companies are compared over time and within sectors. Thus, we can infer that a portion of EBITDA margin variability between companies is due to sector influence, explicating the hierarchical nature of our data.
According to Raudenbush, Bryk, Cheong and Congdon (2004), behavioral and social data generally contain cluster structures and, if repeated observations are collected from a group of companies, collection periods span different ranges of time. Each company should also be part of a cluster in some organizational unit, like a sector. In the linear hierarchical model, each data structure level is formally represented by its own sub-model, representing the structural relations that occur at that level. Hierarchical models with repeated measures offer additional advantages because they allow researchers to create models with specific predictive variables at each analytic level, offering answers as to how such variables affect firm and sector levels over time exactly.
According to Deadrick, Bennett and Russell (1997) and Short, Ketchen, Palmer and Hult (2007), HLM use enhances the study of variance components at each analysis level. As Raudenbush and Bryk (2002) discuss, HLM offers an integrated approach to study individual growth structure and predictors. In the context of dynamic criteria, HLM offers a means to examine the existence, nature and intra-personal causes of performance changes over time and, as a result, create analyses of more complete dynamic criteria. That is:
a) It explicitly recognizes and investigates changes in individual systematic platforms over time;
b) It permits estimating static and longitudinal performance parameters;
c) And it permits intra-personal and inter-personal performance parameter analyses.
In order to analyze the proportions of between- and within-subject variances were conducted via multilevel statistics using the HLM 6.04 program (Hierarchical Linear Modeling); (Raudenbush, Bryk, Cheong and Congdon, 2004).
Sampling and definition of variables
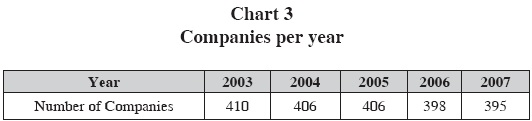
The research data were collected from the database of Revista Exame Melhores e Maiores, for the period from 2003 to 2007. Melhores e Maiores magazine compiled an annual database of Brazilian companies and then, selected the 500 largest and best companies. Financial institutions were not part of the database. Data refer to absolute amounts, in reais (R$), for the EBITDA and gross revenues for the companies the magazine listed. Some firms are repeated year after year, characterizing repeated measures. The criterion for inclusion in the research database was that a company had to be present on the magazine's list in at least two out of five years in the sample. The sequence of years for a company's appearance did not matter. Companies should have presented their gross sales and EBITDA in reais. The database was composed based on the following variables, presented in Chart 1.

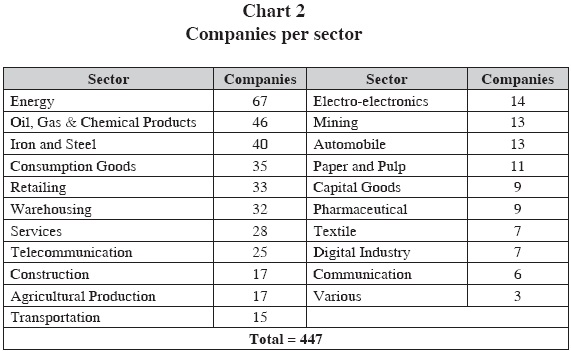
Applying the selection criteria to the database to exclude companies, the end sample results in 447 companies that remain, distributed in their respective sectors according to Chart 2.
For each of the years under analysis, the final number of companies is shown in Chart 3.
Following, we present the model adopted in this research.
Three-Level hierarchical modeling with repeated measures
The study by Griffin, Li, Yue and Zhao (2009) addressed the EBITDA indicator through the use of HLM. In their study, the role of culture in business risk was investigated through income variability measures, expense on research, and the development and use of long-term debt. As a proxy of business risk, Return on Assets (ROA) was used, represented by the EBITDA/Assets equation. In this study, the EBITDA margin will be used as the dependent variable.
As Soto and Morera (2005) and Fávero (2008) discuss, three-level models consist of three sub-models, in which there are t = 1,..., Tij years at level 1, which are clustered in each i = 1,..., nj companies that, in turn, are nested in j = 1,..., J sectors. Thus, HLM considers a single performance trajectory for each company. That is, it takes into account random effects to explain performance over time. In this research, the assertion is also valid, as it will use each firm's EBITDA margin as a performance measure.
The three-level hierarchical model with repeated measures used in this study involves three levels as follows:
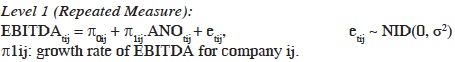
Level 1 (Repeated Measure): the analysis of individual changes in companies' EBITDA margins over time.
Level 2 (Firm): EBITDA variation among companies in the same sector. This analysis permits to examine differences in the EBITDA margin that exist among companies from the same sector over time (first research question); and
Level 3 (Sector): EBITDA variation among companies from different sectors. The second research question can be analyzed by this level, allowing to observe differences in the EBITDA margin that exist among companies from different sectors over time.
To verify the first two research questions, a model without predictive variables is proposed (the null model), which offers estimations of variance components in each firm (over time), among firms and among sectors.
According to Raudenbush, Bryk, Cheong and Congdon (2004), the model provides tests for the variance components among companies and among sectors. The null model can be written as follows:
Null Model
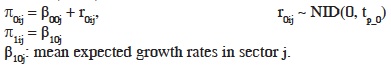
Level 1 (Repeated Measure):

Level 2 (Firm):
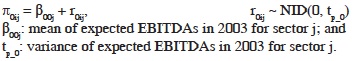
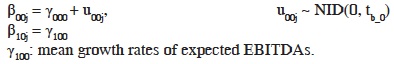
Level 3 (Sector):

To check the third research question (Does time exert different influences on the EBITDA margin in companies from the same sector and from distinct sectors?), two models are proposed that include a trend component (variation over time) at level 1. The first model does not include random effects and merely tests whether the companies' EBITDA margin follows a linear trend over time; in the second model, random effects are included to test whether the EBITDA trend varies among companies over time.
Linear trend model without random effects
Level 1 (Repeated Measure):
Level 2 (Firm):
Level 3 (Sector):
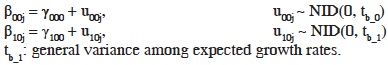
Linear trend model with random effects
Level 1 (Repeated Measure):

Level 2 (Firm):

Level 3 (Sector):
Result analysis
In line with Raudenbush and Bryk (2002) and Fávero and Confortini (2010), through the application of the null model in HLM, table 1 presents the variance decomposition among the levels. As observed, a considerable part of the variance (26.45%) is due to differences among sectors (x2 = 203.94, p<0.01) and a relatively smaller percentage (19.02%) is due to the evolution over time. On the other hand, a significant part of the variability in the EBITDA margin (55.53%) occurred among companies from the same sector (x2 = 5417.28, p<0.01).
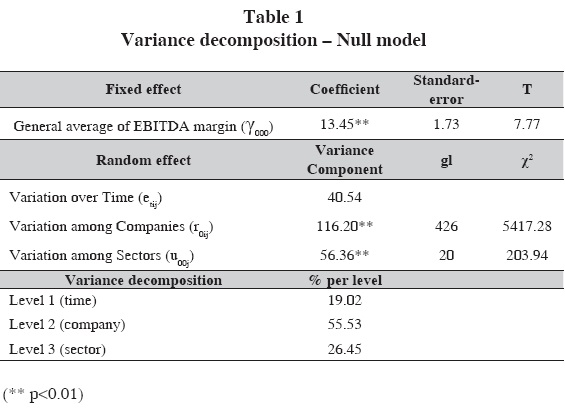
The variance decomposition explicated by Table 1 shows that the main part of the variance was due to the variability of the EBITDA margin among companies from the same sector. One cannot ignore, however, that significant variability exists in the EBITDA margin between companies from different sectors and over time.
Turning to question 1, about differences in the EBITDA margin among companies from the same sector, we can see that the data in Table 1 shows a significant variability among firms in EBITDA (55.305%) in the same sector. This supports an answer to the question as there is a significant difference in the EBITDA margin among companies from the same sector over time, and such variability is stronger than any other variability analyzed (caused by sector and time).
However, the variability aroused by sector cannot be dismissed, once it has reached a considerable level of 25.399%. Thus, it can be said, in answer to research question 2 (Do significant differences in the EBITDA margin exist among companies from different sectors over time?), that, although weaker than variability showed by companies from the same sector, there are differences in EBITDA over time and in companies of different sectors.
As previously discussed, company performance is directly related to the industry structure in which it is inserted. Industry structure directly determines profitability margin and the behavior of economic agents responsible for business conduct (Moraes, 2005). Therefore, it was expected that the EBITDA ability to compare companies arising from same sector would be stronger, since EBITDA ability to compare firms is strong in similar firms (which are competing in the same competitive environment).
The immediate assumption, therefore, was that companies from same sector exhibit different EBITDA, but close to each other, after all, they are competing in the same industry and supposedly have a similar functional structure, which in turn, results in similar indicators. Thus, higher differences were expected to be present between sectors than within sectors. However, the differences demonstrated an opposite behavior compared to what we thought we would find. Differences between companies from same sector were expected, but not as indicated by results. The variability of companies from same sector was the highest one, reaching a magnitude twice higher than the variability we have found between companies across sectors.
Tables 2 and 3 offer the models results when including the trend at level 1, with and without random effects, respectively. The model without random effects (Table 2) shows that the parameter corresponding to the temporal evolution (linear trend) with fixed effect does not statistically differ from zero (t = -5.25, p<0.01), with a negative growth factor for the EBITDA margin over time, at an average of -0.21.
Table 3, which presents the results of the linear trend model with random effects, shows that the variance component for the linear trend is significant (x2 = 1017.08, p<0.01), which indicates significant variance in the EBITDA trend among companies from the same sector over time. Thus, companies from the same sector tend to present significant mutual variations over time. The same is the case for companies from different sectors.
The analysis of Tables 2 and 3, verifies research question 3 (Does time exert different influences on the EBITDA margin in companies from the same sector and from distinct sectors?). On average, among the 21 sectors under analysis, fourteen showed decreases in their mean annual EBITDA margins (oil, gas, and chemical products; iron and steel; retailing; warehousing; telecommunications; construction; agricultural production; transportation; paper and pulp; pharmaceutical; textile; digital industry; communications and various other sectors), five displayed rising mean annual EBITDA margins (consumption goods, services, mining, automobile and capital goods), and only two showed a stable indicator over time (energy and electro-electronics). Therefore, the answer to question 3 is that there is a time effect on EBITDA margin, and this factor has negatively influenced (-0.218901) companies' EBITDA.
Final considerations
Motivation for this paper were the debates in the literature between the business and academic spheres regarding EBITDA use. Many academic critics affirm that EBITDA has a limited usefulness, except for comparing companies active within the same sector. The business sphere, in turn, makes considerable use of EBITDA, often considering it as important an indicator as income or generated cash. Thus, the goal was to study the EBITDA margin from a hierarchical perspective, with a view to an analysis of possible existing discrepancies over time, not only among companies from the same sector, but also among companies from different sectors for the Brazilian case.
This research suggests the answer to question 1 is that there is a significant difference in the EBITDA margin among companies from the same sector over time. Actually, such variability was the stronger one, when compared to the variability caused by sector or time. Even though variability aroused by sector was more than two times lower than variability among companies from the same sector over time, it cannot be dismissed. Thus, the answer to question two is that there are significant differences in the EBITDA margin among companies from different sectors over time. Finally, including in the model a trend by levels allows to infer that there is a time effect on EBITDA margin, and that this factor has negatively influenced companies' EBITDA (question 3).
Traditional authors argue that EBITDA comparison makes a difference when made among similar companies only (Vasconcelos, 2001a; McClure, 2006; Santana and Lima, 2004; Stumpp, 2000). In accordance with the literature on the EBITDA margin's comparative capacity, it was not expected that the main differences would occur exactly among companies from the same sector. The smaller discrepancy among EBITDA margins for companies active in different sectors raises questions on the actual usefulness of this indicator to compare companies from the same sector only. Moreover, the importance of the sector for EBITDA analysis is questioned, as the variance percentage at analysis level 3 was lower.
Besides our results achievements, further research in this area can be relevant. It is worth mentioning the importance of conducting research to provide results that can be generalized on EBITDA ability to represent firm's performance. Thus, developing the research to establish a connection between EBITDA and market variables, such as market value, cost of capital, liquidity and volatility of the stock is relevant in the way to better understand EBITDA informational ability. In addition, a general model to assess the EBITDA variability not just between sectors, but between different countries appears to be of great relevance. The method adopted allows for inferences, as it offers predictive capacity and, in comparison with traditional regression methods, it permits the decomposition of variances at each level, with a view to further research on the influences of each level for comparative purposes. Therefore, research is needed on other periods and focusing on other Latin American markets.
The academic use of HLM, besides its wide utilization among researchers in social sciences, is relatively new in finance and accounting papers (Dong and Stettler, 2011). This way, the use of such technique allows researchers to generalize results, considering sector or country specific characteristics. Lastly, as discussed above in this paper, EBITDA's information can better contribute when used in combination with other techniques and other indicators to form an analysis of the business. In this line, evaluating the behavior of other financial indicators for companies from the same sector and different sectors, over time, shows up as a fruitful line of research.
References
Assaf Neto, A. (2003). Finanzas corporativas e valor. 3a. ed., São Paulo: Atlas. [ Links ]
Brito, L.A.L. and F.C. Vasconcelos (2004). Performance of Brazilian companies: year effects, line of business and individual firms. Brazilian Administration Review 1 (1): 1-15. [ Links ]
Coelho, F. (2004). EBITDA: a busca de uma melhor compreensao do maior vox populi do mercado financeiro. Pensar Contábil 6 (26): 41-49. [ Links ]
Cristiano, A.C. and M.I. Sachuk (2004). Os indicadores econômico-financeiros no varejo eletrônico e no tradicional: o caso das Lojas Americanas S/A e Americanas.com Comércio Eletrônico S/A, Paper, Encontro Nacional de Associação Nacional dos Programas de Pós Graduação em Administração, Curitiba. [ Links ]
Deadrick, D.L., N. Bennett and C.J. Russell (1997). Using hierarchical linear modeling to examine dynamic performance criteria over time. Journal of Management 23 (6): 745-757. [ Links ]
Dong, M. and A. Stetler (2011). Estimating firm-level and country-level effects in cross sectional analyses: An application of hierarchical modeling in corporate disclosure studies. The International Journal of Accounting, 46 (1): 271-303. [ Links ]
Favaro, P. (2004). The evils of EBITDA. Disponible en: http://corp.bankofamerica.com/public.portal?_pd_page_label=products/abf/capeyes/archive_index&dcCapEyes=indCE&id=192 [ Links ]
Fávero, L.P.L. (2008). Efeito tempo, firma e país no desempenho: uma análise sob a perspective da modelagem hierárquica com medidas repetidas. Brazilian Business Review 5 (3): 173-191. [ Links ]
---------- and D. Confortini (2010). Modelos multinível de coeficientes aleatorios e os efeitos firma, setor e tempo no mercado acionário brasileiro. Pesquisa Operacional 30 (3): 703-727. [ Links ]
Frezatti, F. and A.B. Aguiar (2007). EBITDA: possíveis impactos sobre o gerenciamento das empresas. Revista Universo Contábil 3 (3): 7-24. [ Links ]
Gavin, M. (2004). Review of the hierarchical linear models: applications and data analysis methods. Organizational Research Methods 7 (2): 228-231. [ Links ]
Gelman, A. (2006). Multilevel (hierarchical) modeling: what it can and cannot do. Technometrics 48 (3): 432-435. [ Links ]
Greenberg, H. (1998). EBITDA: never trust anything that you can't pronounce. Fortune 137: 192-194. [ Links ]
Griffin, D., K. Li, H. Yue and L. Zhao (2009). Cultural values and corporate risk-taking, Paper, International Conference in Finance, China. [ Links ]
Hawkins, D.J. (2003). Valuation methodologies and the use of EBITDA. Disponible en: http://findarticles.com/p/articles/mi_m0ITW/is_3_84/ai_n14897014/ [ Links ]
Icó, J.A. and R.P. Braga (2001). EBITDA: Lucro ajustado para fins de avaliação de desempenho operacional. Pensar Contábil 3 (10): 9-14. [ Links ]
Malvessi, O. (2006). EBITDA: será esse um bom indicador para a gestão financeira, e útil para a remuneração variável nas empresas? Relações com Investidores 96: 11-12. [ Links ]
Martins, E. (1998). EBITDA: O que é isso? Boletim IOB 6 (19): 1-7. [ Links ]
Mauri, A.J. and M.P. Michaels (1998). Firm and industry effects within strategic management: an empirical examination. Strategic Management Journal 19 (3): 211-219. [ Links ]
McClure, B. (2006). A clear look at EBITDA. Disponible en: http://www.investopedia.com/articles/06/ebitda.asp [ Links ]
Moraes, E.A. (2005). Análise da decomposição do desempenho de empresas brasileiras utilizando modelos lineares mistos e de componentes de variância. Doctoral Dissertation, Fundação Getúlio Vargas. [ Links ]
Raudenbush, S. and A. Bryk (2002). Hierarchical linear models: applications and data analysis methods. 2a. ed., London: Sage. [ Links ]
----------, A.S. Bryk, Y.F. Cheong and R.T. Congdon Jr. (2004). HLM6: Hierarchical linear and nonlinear modeling. Lincolnwood: Scientific Software International [ Links ]
Santana, L. and F. G. Lima (2004). EBITDA: uma análise de correlação com os retornos totais aos acionistas no mercado de capitais brasileiro, Paper, Congresso USP de Controladoria e Contabilidade, Universidade de São Paulo. [ Links ]
Santos, P. (2000). Será o EBITDA o melhor instrumento de avaliação de empresas? Disponible en: http://www.sonegocios.pt/ver_artigo.php?id_artigo=14 [ Links ]
Schmalensee, R. (1985). Do markets differ much? American Economic Review 75 (3): 341-351. [ Links ]
Short, J.C., D.J. Ketchen Jr, T.B. Palmer and G.T.M. Hult (2007). Firm, strategic group, and industry influences on performance. Strategic Management Journal 28 (2): 147- 167. [ Links ]
Smith, L. (2002). EBITDA: challenging the calculation. Disponible en: http://www.investopedia.com/articles/analyst/020602.asp [ Links ]
Soto, J.L.G. and M.C. Morera (2005). Modelos jerárquicos lineales. Madrid: La Muralla. [ Links ]
Strischek, D. (2001). E-B-I-T-D-A it doesn't spell cash flow. Disponible en: http://findarticles.com/p/articles/mi_m0ITW/is_3_84/ai_n14897014/ [ Links ]
Stumpp, P. M. (2000). Putting EBITDA in perspective: ten critical failings of EBITDA as the principal determinant of cash flow. 10th Annual High Yield Bond Seminar of the New York Society of Security Analysts, presented in New York City on June 15, 2000. Published in Moody's Investor Service Global Credit Research, Special Comment. [ Links ]
Vasconcelos, Y.L. (2001a). EBITDA: redescoberta do potencial informativo dos indicadores absolutos. Revista do Conselho Regional do Rio Grande do Sul 102: 1-9. [ Links ]
----------, (2001b). EBITDA: retrato do desempenho operacional. Boletim IOB 49: 1-6. [ Links ]
Veríssimo, M. (2006). Relates com investidores: EBITDA. Disponible en: http://www.mzweb.com.br/mz/web/arquivos/MZ_220306_port.pdf [ Links ]
White, G.I., A.C. Sondhi and D. Fried (1997). The analysis and use of financial statement. 2a. ed., New York: John Wiley and Sons. 102: 1-9. [ Links ]
1Earnings before interest, taxes, depreciation and amortization

