


 texto en
  Inglés (pdf)
 Artículo en XML
 Referencias del artículo
 Enviar artículo por email
 Citado por SciELO
  Similares en
SciELO
Similares en
SciELO 
 Permalink
Introduction
Cage culture represents a sustainable alternative in world aquaculture. It is a technology with potential for fish production. Several fish species of commercial interest have been assessed to know their potential for farming in these systems (Islam et al. 2016). In Mexico, aquaculture research on cage culture has focused on marine fish (Álvarez-Lajonchere et al. 2012), particularly the white Snook,Centropomus viridis(Ibarra-Castro et al. 2017), and snappers (Martínez-Brown et al. 2018).
Farming of spotted rose snapper (SRS) (Lutjanus guttatus) in floating net cages began in Mexico in the 1990s in Sonora (SEPESCA 1994). It is one of the cultures with the greatest development given the controlled production of its culture cycle and other technological advances. Another important factor is its high productive yield compared with land production systems (Hernández et al. 2015).
SRS has been identified as one of the best prospects for large-scale commercial cage culture. Some biological, technical, and economic processes have been well documented: hatchery and larval rearing (Abdo de la Parra et al. 2015), feeding (Silva-Carrillo et al. 2012), growth rate (Hernández et al. 2015), and bioeconomic analysis (Martínez-Cordero et al. 2017). In commercial farming, growth performance is the most influential factor to achieve economic profitability. Despite the knowledge gained on this species about its growth rate in net cages, it is important to know its limits and establish a growth model that maximizes production efficiency. Currently, different models are available for estimating individual growth, which estimates the mean individual body growth (Baer et al. 2011). Today, the most commonly applied model in fisheries and aquaculture is the von Bertalanffy growth model (Katsanevakis and Maravelias 2008). There are other commonly used models, such as the Gompertz growth model (Gompertz 1825), the Schnute-Richards model (Schnute and Richards 1990), the logistic model (Ricker 1975), and the Schnute growth model (Schnute 1981). The Schnute model is a general model that incorporates the von Bertalanffy, Gompertz, Schnute-Richards, and logistic models as special cases. Model selection requires the use of the Akaike’s information criterion (AIC) (Akaike 1973) and the Bayesian information criterion (BIC) (Schwarz 1978). This approach has been recommended as a better and more reliable alternative to traditional approaches (Katsanevakis and Maravelias 2008). When data support evidence to set more than one model, it is possible to build average model best fits or even all candidate models as a better alternative to describe the growth of a species. This is called multimodel inference (Katsanevakis and Maravelias 2008) and it has been used often (Ansah and Frimpong 2015). Application of multimodel inference to select a model for a specific data collection reduces the uncertainty of model selection. To our knowledge Castillo-Vargasmachuca et al. (2018) is the only research focused on the application of growth models for SRS reared in a hatchery and cultured in floating net cages.
The present study compares the performance of the von Bertalanffy model, the logistic growth model, and the Gompertz model in predicting SRS growth in a complete production cycle of organisms reared in a hatchery and fattened in net cages at different densities in a pilot commercial farm. Results from this study will increase our knowledge regarding the aquaculture of SRS in cages and its potential technical implications.
Materials and methods
We implemented a floating net cage system, located at the Isla de la Piedra Beach (23°10ʹ45.5ʺ N, 106°24ʹ29ʺ W), as part of a pilot study on the effect of 3 harvest densities on growth performance and profitability of hatchery-reared SRS, for a period of 360 days and a complete production cycle. We built 3 circular floating net cages, 2 with a diameter of 9 m and a depth of 3.5 m and 1 with a diameter of 9 m and a depth of 4.5 m, using extruded high density polyethylene.
The 39,120 hatchery-reared SRS juveniles (60 days old) with an initial mean weight of 14.0 ± 4.9 g and an initial total length of 10.8 ± 1.2 cm were obtained from the rearing facilities of the Research Center for Food and Development (CIAD, for its acronym in Spanish), Sinaloa, Mexico. These organisms were randomly distributed and stocked at 3 initial harvest densities, one for each cage: 15 kg·m-3(D15 = 9,300 fingerlings), 20 kg·m-3(D20 = 12,340 fingerlings), and 22 kg·m-3(D22 = 17,480 fingerlings). The mean survival was 95% for all densities; we estimated it through a daily collection by scuba diving, and we counted dead fish from the surface and the bottom of each cage.
Water quality was evaluated daily inside all cages (Hernández et al. 2016). We measured water temperature (°C) and dissolved oxygen (DO, mg·L-1) with a YSI meter (model 85); water temperature ranged from 16.0 to 31.0 °C (mean = 27.3 °C) and DO ranged from 4.3 to 7.8 mg·L-1(mean = 5.9 mg·L-1). Salinity was measured with an ATAGO salinometer and varied from 33.0 to 35.0. We measured pH with a digital pH meter (HANNA Instruments), and it ranged from 7.0 to 8.8 (mean = 7.8). The water ammonia nitrogen was determined using a YSI 9,000 photometer (ammonia starter kit, 0.0-1.0 mg·L-1). The cage conditions varied as follows (Hernández et al. 2016): water temperature ranged from 16.0 to 31.0 °C (mean = 27.3 °C), DO ranged from 4.3 to 7.8 mg·L-1(mean = 5.9 mg·L-1), pH ranged 7.0 to 8.8 (mean = 7.8), and salinity ranged from 33.0 to 35.0. Nets were routinely cleaned by diving to maintain the water quality in the cages.
For 360 days, the fish were fed twice daily (8:00 AM and 4:00 PM) with a reference extruded diet, with sinking pellets containing 50% crude protein and 12% crude lipids. More details on the diet are found in Silva-Carrillo et al. (2012). Feed was supplied at 3% of biomass per day throughout the experiment. Every 2 weeks we took samples to monitor and adjust the food ration according to the average weight and the total biomass in each cage.
Each month we sampled individuals from each cage and recorded the total length-at-age (TL) to the nearest millimeter. Particularly for the last month, we sampled a total of 284 organisms (74 for D15, 100 for D20, and 110 for D22). To assess the impact of stocking density on growth performance, we used 2 indicators: final TL at 12 months, which is a commonly used indicator (Lambert and Dutil 2001), and the growth rate estimated from the following growth models: von Bertalanffy, logistic, and Gompertz.
For the first indicator, we calculated the basic statistics (minimum, maximum, mean, standard deviation, and median) for each density and tested for normality (Shapiro-Wilk test). We then carried out the Kruskal-Wallis test to compare the mean final length (FL) associated with each density. The null hypothesis was rejected (H 0: FLD15= FLD20= FLD22), so we did a post hoc Kruskal-Wallis test (Dunn test implemented in the FSA package from R).
For the second indicator, we used a different approach that has never been used in this type of analysis. To take into account model uncertainty, we modeled growth with 3 length-at-age models. The first one was the von Bertalanffy growth model (1957):
whereL ∞is the asymptotic length,Kis the growth rate,t 0is the time when length is equal to zero, and ε i is an independent normal randomly distributed error [N(0,σ 2)]. The second model was the logistic growth model:
whereIis the age at the inflection point of the length curve. The third model was the Gompertz model (1825):
We estimated the model parameters from equations 1-3 and their uncertainties using the maximum likelihood estimation (MLE) method (Kimura 1980); thus, the objective function was the negative log-likelihood (LL) (Hilborn and Mangel 1997):
where s2is the variance,nis the number of observations,
whereprepresents the number of parameters in the model andnis the number of observations. Once we determined the best model (smallest AIC and BIC), we did 1,000 bootstrap simulations for each density scenario; in every iteration, we sampled randomly with replacement 50 observed points for each age in each density. We used these 600 points, the subroutineoptim, and the L-BFGS-B algorithm to determine the MLE estimate forK. We recorded the 1,000KMLEs for all model/density scenarios into a file for later analysis.
With the simulatedKMLEs, we did basic statistics and tested the data for normality with the Shapiro-Wilk test. Because the estimates had a normal distribution, we used an analysis of variance (ANOVA) to test the equality of the instantaneousK(H 0:K D15=K D20=K D22). Because the null hypothesis was rejected, we did a Tukey’s honest significant difference (HSD) test to assess the equality of the means.
Results
The maximum length (33.0 cm) and the largest average (30.1 ± 1.3 cm) corresponded to density D20, while the smallest mean (28.0 ± 2.0 cm) corresponded to density D22. Densities D15 and D20 had the largest medians. For densities D20 and D22, the TL data was not normally distributed (Table 1, Fig. 1). The non-parametric Kruskal-Wallis test suggested that at least 1 mean was different (Pvalue = 1.037 × 10⁻¹⁵). The post hoc Kruskal-Wallis test suggested the means of densities D15 and D20 were statistically the same (Pvalue = 0.22); the remaining comparisons were not significant (Table 2).
Table 1. Basic statistics for the final total length (cm) (age 12 months) of spotted rose snappers cultured in floating net cages and thePvalues the normality test for the final total length in each density scenario.
| Density | Minimum | Maximum | Average | Median | Pvalue |
| D15 | 27.0 | 32.5 | 29.8 ± 1.3 | 30 | 0.1567 |
| D20 | 27.0 | 33.0 | 30.1 ± 1.3 | 30 | 0.0335 |
| D22 | 22.5 | 31.5 | 28.0 ± 2.0 | 28 | 0.0104 |
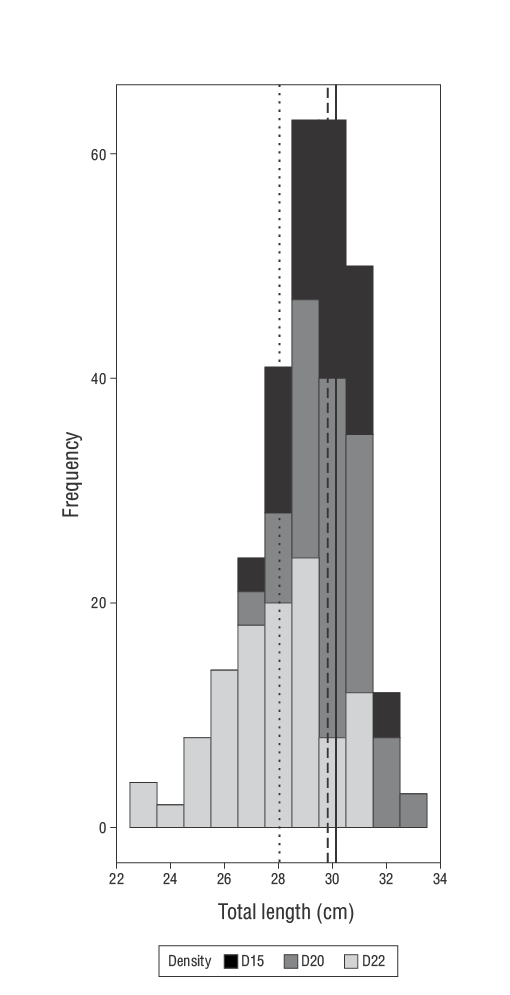
Figure 1. Snapper final total length distribution within each initial density level (D15, D20, and D22); lines represent the mean total length for each initial density: dashed line, D15; solid line, D20; dotted line, D22.
Table 2. Results of the non-parametric post hoc Kruskal-Wallis test by ranks for the final total length (age 12 months) of spotted rose snappers cultured in floating net cages at 3 different densities (D15, D20, D22).
| Comparison | Value | Pr(>| |) |
| D20-D15 = 0 | -1.100658 | 0.22479 |
| D22-D15 = 0 | 2.977395 | 0.00392 |
| D22-D20 = 0 | 4.048660 | 0.00008 |
For the MLE estimates ofK, 9 scenarios were analyzed (Table 3). All models fitted the observed TL well in each density scenario (Fig. 2). The highest MLEs ofL ∞were consistently estimated with the von Bertalanffy model; the largest value corresponded to density D20. On the other hand, the smallest MLEs corresponded to the logistic model (Table 3), with the lowest value associated with the D15 density. Regarding theKparameter, the logistic model had the largest estimates, with the highest corresponding to the D20 scenario. The smallest estimates corresponded to the von Bertalanffy model and were one order of magnitude smaller than the estimates from the logistic and the Gompertz models (Table 3).
Table 3. Estimates of parameters and their uncertainty (standard error) from the growth model fitting for each model within each density scenario.L ∞, asymptotic length;K, growth rate;t 0, the time when length is equal to zero; s, standard error;LL, log likelihood; AIC, Akaike’s information criterion; BIC, Bayesian information criterion.
| Model/density | D15 | D20 | D22 | |
| von Bertalanffy | L ∞ | 48.500 ± 1.2600 | 50.000 ± 1.3700 | 46.960 ± 1.2000 |
| K | 0.067 ± 0.0031 | 0.065 ± 0.0031 | 0.063 ± 0.0028 | |
| t 0 | -2.400 ± 0.0900 | -2.390 ± 0.0900 | -2.731 ± 0.0906 | |
| σ | 1.140 ± 0.0300 | 1.170 ± 0.0344 | 1.608 ± 0.0458 | |
| LL | 2485.503 | 2402.729 | 2980.511 | |
| AIC | 4979.000 | 4813.457 | 5969.022 | |
| BIC | 5027.800 | 4861.886 | 6018.030 | |
| Logistic | L ∞ | 32.900 ± 0.2500 | 33.160 ± 0.2300 | 34.790 ± 0.4932 |
| K | 0.269 ± 0.0045 | 0.275 ± 0.0044 | 0.214 ± 0.0049 | |
| t 0 | 3.916 ± 0.0654 | 3.925 ± 0.0591 | 4.906 ± 0.1503 | |
| σ | 1.108 ± 0.0318 | 1.132 ± 0.0333 | 1.540 ± 0.0437 | |
| LL | 2457.965 | 2363.608 | 2924.238 | |
| AIC | 4923.931 | 4735.215 | 5856.475 | |
| BIC | 4972.757 | 4783.644 | 5905.484 | |
| Gompertz | L ∞ | 34.980 ± 0.2900 | 36.375 ± 0.3490 | 38.994 ± 0.6384 |
| K | 0.178 ± 0.0030 | 0.175 ± 0.0035 | 0.133 ± 0.0034 | |
| t 0 | -7.480 ± 0.2500 | -7.530 ± 0.2718 | -12.054 ± 0.4749 | |
| σ | 1.130 ± 0.0300 | 1.137 ± 0.0334 | 1.555 ± 0.0441 | |
| LL | 2,476.870 | 2,368.310 | 2,936.490 | |
| AIC | 4,961.750 | 4,744.630 | 5,880.970 | |
| BIC | 5,010.572 | 4,793.055 | 5,929.979 |
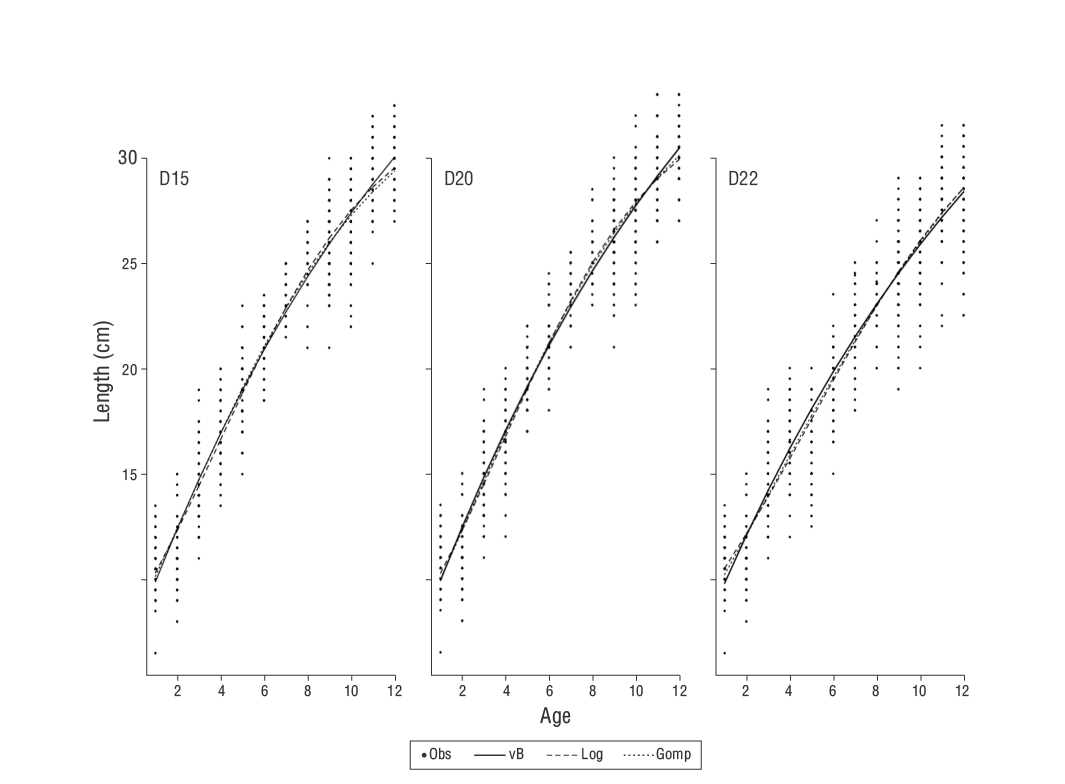
Figure 2. Model fits to observed total length-at-age data for each spotted rose snapper density rearing in floating net cages. Obs, observed length-at-age data; vB, von Bertalanffy model; Log, logistic model; Gomp, Gompertz model.
The AIC and BIC criteria suggested that the logistic model was the best fit for the observed data in each initial density scenario (Table 3). The smallest AIC value (4,735.21) corresponded to the logistic model and D20. Likewise, with the BIC (4,783.64), the best fit corresponded to the logistic model with D20. The von Bertalanffy model consistently had the worst performance, while the logistic model performed slightly better than the Gompertz model (Table 3).
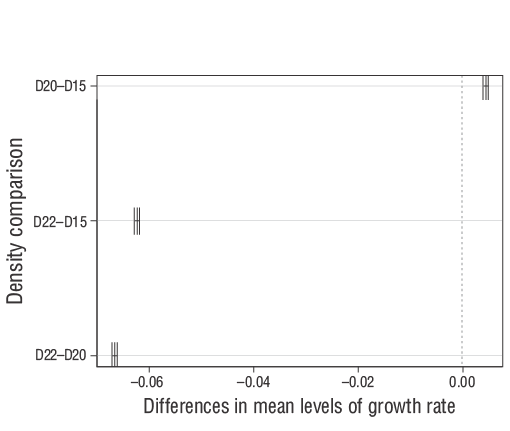
Based on these results, we carried out bootstrapping to build samples with replacement for fitting the logistic model. The resulting MLEKdistributions indicated higherKvalues for the D15 and the D20 densities, while the D22 density had smaller estimates (Figs. 3, 4). Extreme values were found in all density scenarios (Fig. 4). The largest averageK(0.2863 ± 0.0045) and the median (0.2862) corresponded to the D20 density (Fig. 4), while the smallest values corresponded to the D22 density. The Shapiro-Wilk test suggested that the MLEKestimates were normally distributed in each density scenario (Table 4). Therefore, we did an ANOVA to test the equality of the means of each distribution. ANOVA results (Table 5) suggested that at least one mean was different from the rest (Pvalue < 2 × 10-16). The Tukey HSD test suggested that all means were statistically different; none of the 95% confidence intervals included the value zero (Fig. 5). The fastest growth occurred in the cage with density D20. The second fastest growth corresponded to D15, while the slowest growth corresponded to cages with density D22.
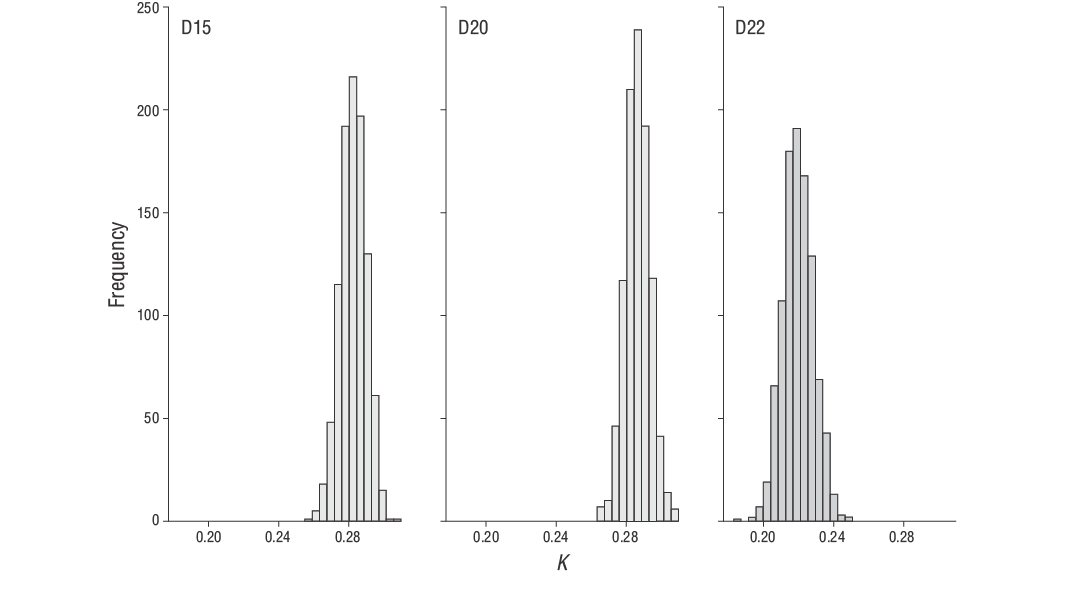
Figure 3. Distributions of maximum likelihood estimates of growth rate (K) for each density scenario obtained through Markov chain Monte Carlo simulations.
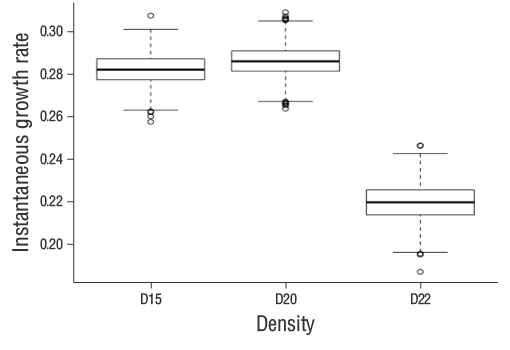
Figure 4. Boxplots for the logistic model instantaneous growth rate maximum likelihood estimates in each density scenario.
Table 4. Basic statistics for the maximum likelihood estimate of growth rate (K) found with bootstrapping simulations and thePvalue for the normality test of theKestimates for each density scenario.
| Density | Minimum | Maximum | Average | Median | Pvalue |
| D15 | 0.2576 | 0.3075 | 0.2822 ± 0.00727 | 0.2822 | 0.6068 |
| D20 | 0.2638 | 0.3091 | 0.2861 ± 0.00696 | 0.2861 | 0.7500 |
| D22 | 0.1871 | 0.2465 | 0.2197 ± 0.00856 | 0.2198 | 0.7000 |
Table 5. One-way analysis of variance results for the comparison of the mean growth rate associated with 3 fish densities (D20, D20, D22).
| d.f. | Sum square | Mean square | F | Pr(F>) | |
| Density | 2 | 2.7938 | 1.397 | 63,572 | < 2 × 10-16 |
| Residuals | 2,997 | 0.0659 | 0.000 |
Discussion
Much effort is currently being invested in promoting cage aquaculture and attaining optimal stocking density for better profitability (Ansah and Frimpong 2015). However, despite the vast advantages and opportunities presented by marine cage culture, this activity has shown slow growth in various regions of Mexico. One of the main reasons for this is that the perception of investment opportunities is not attractive given the margins of economic profitability. It has been identified that of the production parameters, growth performance is the main factor affecting the economic profitability of a cage fish culture. Islam et al. (2016) suggested that estimations on productions that are adjusted to an optimal cultivation density can lead to higher economic yields since the organism’s growth is optimized. Therefore, culture density optimization is one of the most valuable control tools for maximizing economic benefit and should be included in all economic feasibility studies within the early planning stages.
Aquaculture presents a unique challenge to modeling fish growth because the main research objective is accelerating growth for profit. Growth patterns of captive fish in well-fed conditions will diverge from those found for wild fish. For a fish farming enterprise, overestimating growth will lead to expectations of revenue and profit that will not be realized. Underestimating growth will lead to planning for later harvest than is optimal, and the unnecessary additional cost of feeding (Ansah and Frimpong 2015). Thus, an accurate estimation of growth is necessary for maximizing profit. However, deciding which growth models to use, or how to use them, can be fundamentally difficult (Quinn and Deriso 1999).
Several factors can impact fish growth. As the environment changes, the growth and maturity of individual fish often vary (Jessop 2010). In marine environments, different factors have been recognized as important drivers of fish growth, including forage availability (Bremigan et al. 2003), inter- and intraspecific competition (Lorenzen and Enberg 2002), and temperature (Staggs and Otis 1996). In contrast, forage availability and inter- and intraspecific competition might not be an issue in aquaculture systems (Noble et al. 2007). The influence of temperature on fish growth has been widely studied; optimal temperatures for growth have been determined for several species (Pörtner et al. 2001, Handeland et al. 2008, Katzenmeyer 2010). In particular, an important factor affecting fish growth is stocking density; its effect on growth performance and yield has been studied extensively (Rieman and Myers 1992, Apu et al. 2012, Long et al. 2019). Among the indicators of growth performance, authors have used FL, mean final weight, mean weekly weight gain, feed conversion, and survival rate (Papoutsoglou et al. 1998, Lorenzen and Enberg 2002, Gonçalves de Oliveira et al. 2012, Hernández et al. 2015 Long et al. 2019). In general, the methodology they used is based on determining whether significant differences existed between the treatments and the indicators tested, with all the results being analyzed using ANOVA and Tukey’s multiple comparisons of means. Results may vary, and some authors report no influence of fish number per unit volume on survival and growth, like for example in the rabbitfishSiganus rivulatus(Saoud et al. 2008). Other studies have reported fish growing faster at high stocking densities, for example the European sea bassDicentrarchus labrax(Papoutsoglou et al. 1998), but most of the studies have suggested thatKwas inversely proportional to stocking densities, as was the case for the Atlantic cod,Gadus morhua(Lambert and Dutil 2001).
In our study, we used the final length-at-age, as in other studies, but we also used a new indicator: theKparameter from the logistic model. To our knowledge, no previous study has used this approach as an indicator.
Regarding the FL-at-age, our study results suggest the SRS can be maintained at densities as high as 20 kg·m-3with no negative effect on growth, assuming water quality remains within the species’ tolerance levels. In other words, we get the same growth performance in the first 2 stocking densities. A higher density reduces the final size significantly; in our case, the smallest TL coincided with the highest density (22 kg·m-3). This result agrees with most of the previous studies suggesting that higher densities might affect growth negatively (Lambert and Dutil 2001, M’Balaka et al. 2012, Costa et al. 2017). Regarding theKparameter, the availability of data for a long period (12 months) adds contrast to the overall data. Length data are available for the periods of fast and slow growth and allow for reliability in the model parameter estimation. In most stocking studies, this approach is not possible because the sampling period rarely goes beyond 150 days. However, it is worth mentioning that our study results cannot be generalized because our experimental design did not include replicates due to the lack of funding; further improvements should incorporate replicates to avoid pseudoreplication.
Most fish growth studies assume the von Bertalanffy growth model as the default model (Cailliet et al. 2006). However, recent studies have suggested that other models could be more reliable for certain species; for example, the Gompertz model has been suggested for yellowfin tuna (Thunnus albacares) by Quinn and Deriso (1999). According to Arocha et al. (2002), Chapman’s generalized model was the most appropriate for predicting swordfish (Xiphias gladius) growth in the northwestern Atlantic. The Schnute-Richards growth model has been proposed (Katsanevakis 2006) as the most suitable for the rougheye rockfish (Sebastes aleutianus), and a stochastic version of the logistic model performed well forPlecoglossus altivelisin Japan (Yoshioka et al. 2019).
According to Katsanevakis and Maravelias (2008), the information theory approach frees the researcher from the limiting concept that a “true” growth model exists. Multimodel inference based on information theory is proposed as a more robust alternative to study fish growth. In the present study, we followed this approach and fitted 3 growth models to the SRS observed final length-at-age. In our work, we used AIC and BIC for the model selection. Our results suggest the logistic model was the best model fitting the observed final length-at-age data in each of 3 harvest densities. Other studies suggested similar results; for example, Yoshioka (2019), Arzola-Sotelo (2014), and Jurado-Molina et al. (2018) found that the logistic model was the best forP. altivelis, the yellowtail snapper (Ocyurus chrysurus), and curvina (Cynoscion othonopterus), respectively. We could cite more examples; however, as stated by Katsanevakis and Maravelias (2008), in many cases the von Bertalanffy model is not supported by the data, and many species seem to follow different growth trajectories. Thus, we recommend the use of the multimodel inference approach as a default methodology in all fish growth studies.
Once the logistic model was selected, using bootstrapping for estimating the instantaneousKprovided new insight into this analysis. Given the original sample, we used bootstrap samples for the estimation ofK; with this approach, we estimated the distribution ofKfor each stocking density and made a comparison via ANOVA to assess the impact of stocking density on growth performance. Contrary to our first indicator, the second indicator suggested there might be an optimal stocking density (D20) producing the highestK; fishes might grow faster in a stocking density of 20 kg·m-3than at 15 kg·m-3. This type of resolution was not provided by the first indicator, which suggested the same performance for the lower densities. It is worth noting that length-at-age data is always available in aquaculture enterprises. Therefore, this approach can be included in studies that focus on the effect of densities on growth performance.
The results obtained are early and pretend to benefit the managers of SRS cage aquaculture in order to maximize fish growth performance and economic profits to escalate culture to a commercial scale. Further improvements to the experimental design should focus on adding replicates and avoiding pseudoreplication.

