SciELO - Scientific Electronic Library Online

 
vol.49Composición y diversidad espaciotemporal de la comunidad de aves acuáticas en la laguna de las Ilusiones, Tabasco, MéxicoEfecto del estrés térmico causado por el evento El Niño 2015-2016 sobre la composición bioquímica, la estructura del exoesqueleto y la densidad de simbiontes del coral de fuego Millepora alcicornis índice de autoresíndice de assuntospesquisa de artigos
Home Pagelista alfabética de periódicos  

Serviços Personalizados

Journal

Artigo

Indicadores

Links relacionados

  • Não possue artigos similaresSimilares em SciELO

Compartilhar


Ciencias marinas

versão impressa ISSN 0185-3880

Cienc. mar vol.49  Ensenada Jan./Dez. 2023  Epub 08-Dez-2023

https://doi.org/10.7773/cm.y2023.3358 

Articles

Classification of Santa Ana winds for the evaluation of their wind potential in La Rumorosa, Baja California, Mexico

Marlene Zamora-Machado1  * 
http://orcid.org/0000-0002-4522-2294

Alejandro Adolfo Lambert-Arista1 
http://orcid.org/0000-0002-9241-6374

Onofre Rafael García-Cueto2 
http://orcid.org/0000-0003-4594-2600

Oscar Alfredo Jaramillo-Salgado3 
http://orcid.org/0000-0002-5894-3023

Elia Leyva-Sánchez4 
http://orcid.org/0000-0002-6135-4924

Rafael Carlos Reynaga-López1 
http://orcid.org/0000-0001-5863-8865

Jesús Rigoberto Herrera-García1 
http://orcid.org/0000-0003-4897-8270

Noemí Lizárraga-Osuna1 
http://orcid.org/0000-0002-4689-7525

Rosa Citlalli Anguiano-Cota1 
http://orcid.org/0000-0003-1087-293X

1Facultad de Ingeniería, Universidad Autónoma de Baja California, 21280 Mexicali, Baja California, Mexico.

2Instituto de Ingeniería, Universidad Autónoma de Baja California, 21280 Mexicali, Baja California, Mexico.

3Instituto de Energías Renovables, Universidad Nacional Autónoma de México, 62580 Temixco, Morelos, Mexico.

4Tecnológico Nacional de México, Campus Mexicali, 21376 Mexicali, Baja California, Mexico.


Abstract.

La Rumorosa region, located in northwestern Mexico, is characterized by intense local wind speeds, which led to the installation of wind farms. In this area, the contribution of wind power from the Santa Ana winds (SAWs), which are part of the regional wind regime, is unknown. In addition, the valley-mountain winds, cold fronts, extratropical storms, and other meteorological phenomena contribute to the totality of wind power production. For this reason, this study focused on classifying SAW events over a period of 10 years (2005-2014) considering the following categories: “weak,” “moderate,” and “strong.” The criteria for the analysis were associated with the average wind velocity magnitude, the dimensionless pressure gradient, and the normalization of pressure values, gust magnitude, and average wind velocity magnitude. The proposed classification provides information on the behavior of SAW in the area and, by extension, their contribution to wind power generation in La Rumorosa.

Key words: Santa Ana winds; categories; wind power

Resumen.

La región de La Rumorosa, localizada en el noroeste de México, se caracteriza por sus fuertes velocidades en la magnitud del viento a nivel local, lo que ha originado la instalación de parques eólicos. En esta zona, no se conoce de forma precisa la contribución de energía eléctrica eólica de los vientos de Santa Ana (VSA), que son parte del régimen de viento regional. Además los vientos de valle-montaña, los frentes fríos, las tormentas extratropicales y otros fenómenos meteorológicos, en conjunto, contribuyen a la totalidad de energía eléctrica generada. Por ello, este estudio se centra en clasificar, por un periodo temporal de 10 años (2005-2014), los eventos de VSA considerando las categorías: “débil”, “moderado” y “fuerte”. En el análisis se aplicaron criterios asociados a los parámetros de la magnitud de la velocidad promedio del viento, el gradiente de presión adimensional y la normalización de valores de presión, magnitud de la velocidad de ráfaga y magnitud de la velocidad promedio del viento. La clasificación propuesta proporciona información sobre el comportamiento de los VSA en la zona y, por ende, su contribución en la generación de energía eólica en La Rumorosa.

Palabras clave: vientos de Santa Ana; categorías; energía eólica

INTRODUCTION

Santa Ana winds (SAWs) are foehn-type desert winds that occur seasonally in southern California, United States, and northern Baja California, Mexico, generally with a northeasterly or easterly direction (Glickman and Zenk 2000). The winds blow with great magnitude and strong gusts, which flow down the mountains and plateaus (Conil and Hall 2006). The region presents a complex topography, including broad mountain ranges, low coastal plains, and high desert plateaus (Castro et al. 2006). On the other hand, SAWs have important implications for the pattern of coastal currents (Navarro-Olache et al. 2020) and for the influx of mineral dust and its associated contributions of iron and manganese to the coastal waters of the California Current System and the Gulf of California, which promote primary productivity (Félix-Bermúdez et al. 2017, Álvarez and Carbajal 2019, Álvarez et al. 2020).

The season of SAW events begins in September and ends in April. This is caused by a surface high-pressure system over the Great Basin and an offshore low-pressure system off southern California that induce a synoptic pressure gradient and force the shift of surface winds from the northeastern quadrant (Jones et al. 2010). The approximate average is 20 events per period (standard deviation: 5) (Raphael 2003). Previous works report surface speeds with average wind magnitudes between 28 and 56 km·h-1 (15-30 knots) (Small 1995), which correspond to favorable ranges in wind magnitude for wind power generation, and magnitudes of gust speed values that exceed 25 m·s-1 (56 miles per hour) (Sommers 1978, Trasviña et al. 2003, Bytnerowicz et al. 2010). The occurrence of events is frequently higher during autumn and winter than during spring and summer, with maximum activity in December and January (Jones et al. 2010). Sommers (1978) mentioned that events occurred from October to May. As described by Raphael and Finley (2007), no Santa Ana event has been recorded between June and August, due to the patterns of the Pacific high-pressure system located west of California.

SAW events have been the object of study for several years due to their different impacts on the border of Baja California, Mexico, and California, United States (Castro et al. 2003, Hu and Liu 2003, Raphael 2003, Trasviña et al. 2003, Westerling et al. 2004, Sosa-Ávalos et al. 2005, Conil and Hall 2006, Miller and Schlegel 2006, Hsu et al. 2007, Hughes et al. 2009, Bytnerowicz et al. 2010, Hughes and Hall 2010, Jones et al. 2010, Jin et al. 2014, Langford et al. 2015, Hatchett et al. 2018, Álvarez et al. 2020, Gershunov et al. 2021, Serpa-Usta et al. 2021). Within the region impacted by this phenomenon, there are, on the side of the Pacific Ocean, highly urbanized areas, important agricultural areas, forests, and deserts (Castro et al. 2006).

SAWs occur in the region of La Rumorosa, which is characterized as a site with extraordinary potential for harnessing wind power. A study by the Ensenada Center for Scientific Research and Higher Education indicates that, in the area, the presence of SAW events increases the magnitude of average wind speeds (CICESE 2003). During the first 5 years of operations of the wind farm La Rumorosa I, the presence of SAW events in a wind turbine was analyzed, and the average annual electricity generation of that turbine was 16% in 2011 (Zamora 2016). Currently, La Rumorosa region has 52 wind turbines in operation in 2 wind farms, and there are plans to install more in the future (NADB 2013, CEE 2017).

According to Rolinski et al. (2019), the criteria for defining SAWs depend on both the topic of interest regarding the phenomenon (for example, catastrophic forest fires) and its spatiotemporal variability. The velocity magnitude, direction, local pressure gradient, temperature, and relative humidity are used to define SAWs (Raphael 2003).

In this work, we classify SAWs in La Rumorosa because of the favorable conditions found at this site for harnessing wind energy.

MATERIALS AND METHODS

For this study, we analyzed data on the magnitude of wind speed, magnitude of gust speed, and direction of the wind, as well as data on relative humidity and local atmospheric pressure measured at the surface, over a period of 10 years (2005 to 2014), in periods measured at 10-min intervals at a height of 10 m above ground level. Data from 2005 to 2014 from the weather station in La Rumorosa were obtained by formal request to the Comisión Nacional del Agua (CONAGUA, Mexico), with 2% missing data; in addition, the data corresponding to the last 90 days (CONAGUA 2022) can be consulted online. Table 1 shows the geographical characteristics of La Rumorosa weather station (CONAGUA 2022), and Figure 1 shows the geographical location of the station. In addition, local atmospheric pressure values and atmospheric pressure values corresponding to the high-pressure center formed in the Great Basin for each recorded event were obtained from the synoptic maps of the National Oceanic and Atmospheric Administration (NOAA) of the United States (NWS 2007).

Table 1 Geographical characteristics of the weather station. 

Automatic weather station Latitude (north) Longitude (west) Elevation (meters above sea level)
La Rumorosa 32°16′20.00″ 116°12′20.00″ 1,262

Figure 1 Geographical location of La Rumorosa weather station in the northern area of Baja California, Mexico (INEGI 2022). Meters above sea level: m.a.s.l. 

Study area

La Rumorosa was selected to study SAW events because of the availability of on-site surface measurements and because of the various studies that contain information that demonstrates SAW occurrence in southern California (Sommers 1978, Small 1995, Raphael 2003, Keeley et al. 2004, Castro et al. 2006, Conil and Hall 2006, Hughes and Hall 2010, Jones et al. 2010, Ackerman and Knox 2011, Abatzoglou et al. 2013, Cao and Fovell 2013, Fovell and Cao 2017). Data were compared with that of nearby stations, such as Tijuana, Ensenada, and Mexicali; this confirmed that the readings captured at La Rumorosa station recorded the presence of SAW events more frequently than those at the other stations.

Categories for evaluating Santa Ana winds

Set (1) belongs to all the data considered as SAWs from La Rumorosa weather station. The result was verified through the formation of the Great Basin high-pressure center on surface analysis maps (NWS 2005, 2006, 2007, 2008, 2009, 2010, 2011, 2012, 2013):

Vt=vti, 0ti,hrtivti>4,0ti0,90,hrti<40,ti=ti+a-ti (1)

where V t is the magnitude of the wind speed, v(∆t i ) is the magnitude of the wind speed in meters per second, θ(∆t i ) is the wind direction in sexagesimal degrees, hr(∆t i ) is the relative humidity shown as a percentage, t i + a is the upper limit of the time interval, t i is the lower limit, and ∆t i is a time interval greater than 3 h.

Once the data were filtered, different classifications were made taking as reference the data obtained through the meteorological station and the high-pressure center formed in the Great Basin. Events according to this classification were identified on the same day, up to 2 times, and, due to the treatment of the information, they were shown as the total amount of time of SAW events; that is, if the year 2005 had a total of 22 events, with the time analysis, this would correspond to 12 days of SAWs in that year.

    (a). Classification based on the magnitude of the average wind speed with 2 different categories

The sample of SAWs identified with set (1) was classified using ranges of the average wind magnitude (Data 1: ranges in intervals of 5 m·s-1) according to the SAW regional index (SAWRI) by Guzman-Morales et al. (2016), which includes weak SAWs (<5 m·s-1), moderate SAWs (5-10 m·s-1), and extreme SAWs (10-15 m·s-1). In addition, the category used for the Jet Propulsion Laboratory model applied by the National Aeronautics and Space Administration (NASA, USA) in the QuickScat Project (2003) was used, with values of 4-6 m·s-1 for weak SAWs, 6-8 m·s-1 for moderate SAWs, and >8 m·s-1 for strong SAWs (Data 2: ranges in intervals of 2 m·s-1).

    (b). Dimensionless analysis based on atmospheric pressure, air density, and the maximum value of the magnitude of the wind speed

The objective of the dimensionless classification was to correlate the variables of pressure, wind speed magnitude, and air density for all SAW events and compare “weak”, “moderate,” and “strong” winds. This classification was made using the dimensionless parameter, I D (equation 2), derived from the momentum equation, and was calculated as follows:

ID=PH-Plocal×teρDVgust-Vi,mean (2)

where P H is the value of the pressure shown at the high-pressure center over the Great Basin from the synoptic maps, P local is the value of atmospheric pressure recorded in La Rumorosa area on the NOAA synoptic maps, D is the distance obtained through Google Earth between the points P H and P local , V gust is the magnitude of the gust speed, V i,mean is the magnitude of the average wind speed, and t e is the duration of the event (values measured on the surface of La Rumorosa by CONAGUA). Air density, ρ, was obtained with surface values from CONAGUA using the following equation:

t=Plocal, mRT (3)

where P local,m is the local maximum pressure during an event, R is the ideal gas constant, with a value of 0.2870 kPa∙m3·(kg∙K)-1, and T is the maximum average temperature recorded in all events per year.

    (c). Classification using normalization on average velocity magnitude, gust velocity magnitude, and pressure gradient

With the sample of SAW events obtained with set (1), the average magnitude of the wind speed, the magnitude of the gust speed (measured on the surface by CONAGUA), and the pressure gradient were normalized to obtain a “weak”, “moderate,” and “strong” classification. The pressure gradient was normalized using the following equation:

Pgradientnorm=PgradientPgradientmax (4)

Where Pgradientnorm is the normalized value of the pressure gradient, Pgradient is the pressure gradient for each SAW event (P H - P local ), and Pgradientnorm is the maximum value of the pressure gradient.

Considering the parameter I D as linear and divided into 3 intervals, and the dimensionless (item b) and normalization (item c) classifications, we proposed weak SAWs for values of 0.00-0.33, moderate SAWs for values of 0.33-0.66, and strong SAWs for values of 0.66-1.00.

RESULTS

The classification of SAW events obtained by applying the previously defined criteria to set (1) is shown in Figure 2. The results show a cumulative value of 20 ± 4 d of SAWs per year. In addition, in each of the years studied, SAW events had the longest duration in January. In addition, in the years 2008, 2011, and 2014, events occurred in May, which is consistent with the reports by Hsu et al. (2007).

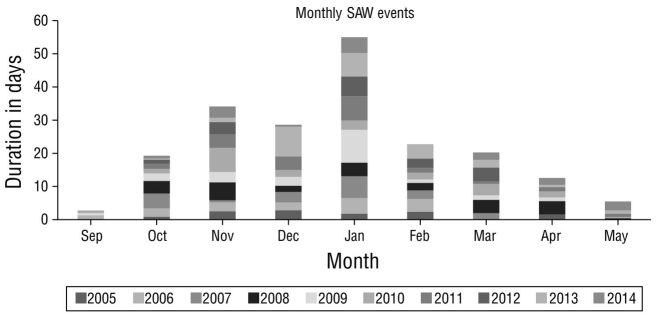
Figure 2 Days with Santa Ana wind (SAW) events at La Rumorosa weather station during the 2005-2014 period, with dataset (1). 

Figure 3 shows the behavior of SAWs for the study period, with a minimum of 12 d in 2005 and a maximum of 29 d in 2008. Figure 4 shows the classification based on the magnitude of the average speed of the wind (m·s-1) with categories based on the range divided in intervals of 2 m·s-1; this are shown as “weak” (4 to 6 m·s-1), “moderate” (6 to 8 m·s-1), and “strong” (>8 m·s-1), according to the QuickScat Project (2003) ranges.

Figure 3 Santa Ana wind (SAW) days per year at La Rumorosa automatic weather station. 

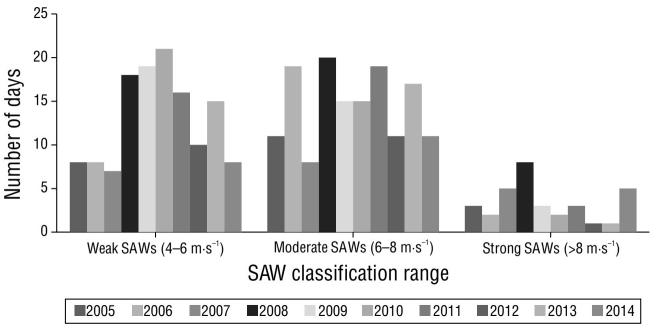
Figure 4 Classification of Santa Ana wind (SAW) events in La Rumorosa, with the QuickScat Project (2003) ranges of the magnitude of wind speed with intervals of 2 m·s-1

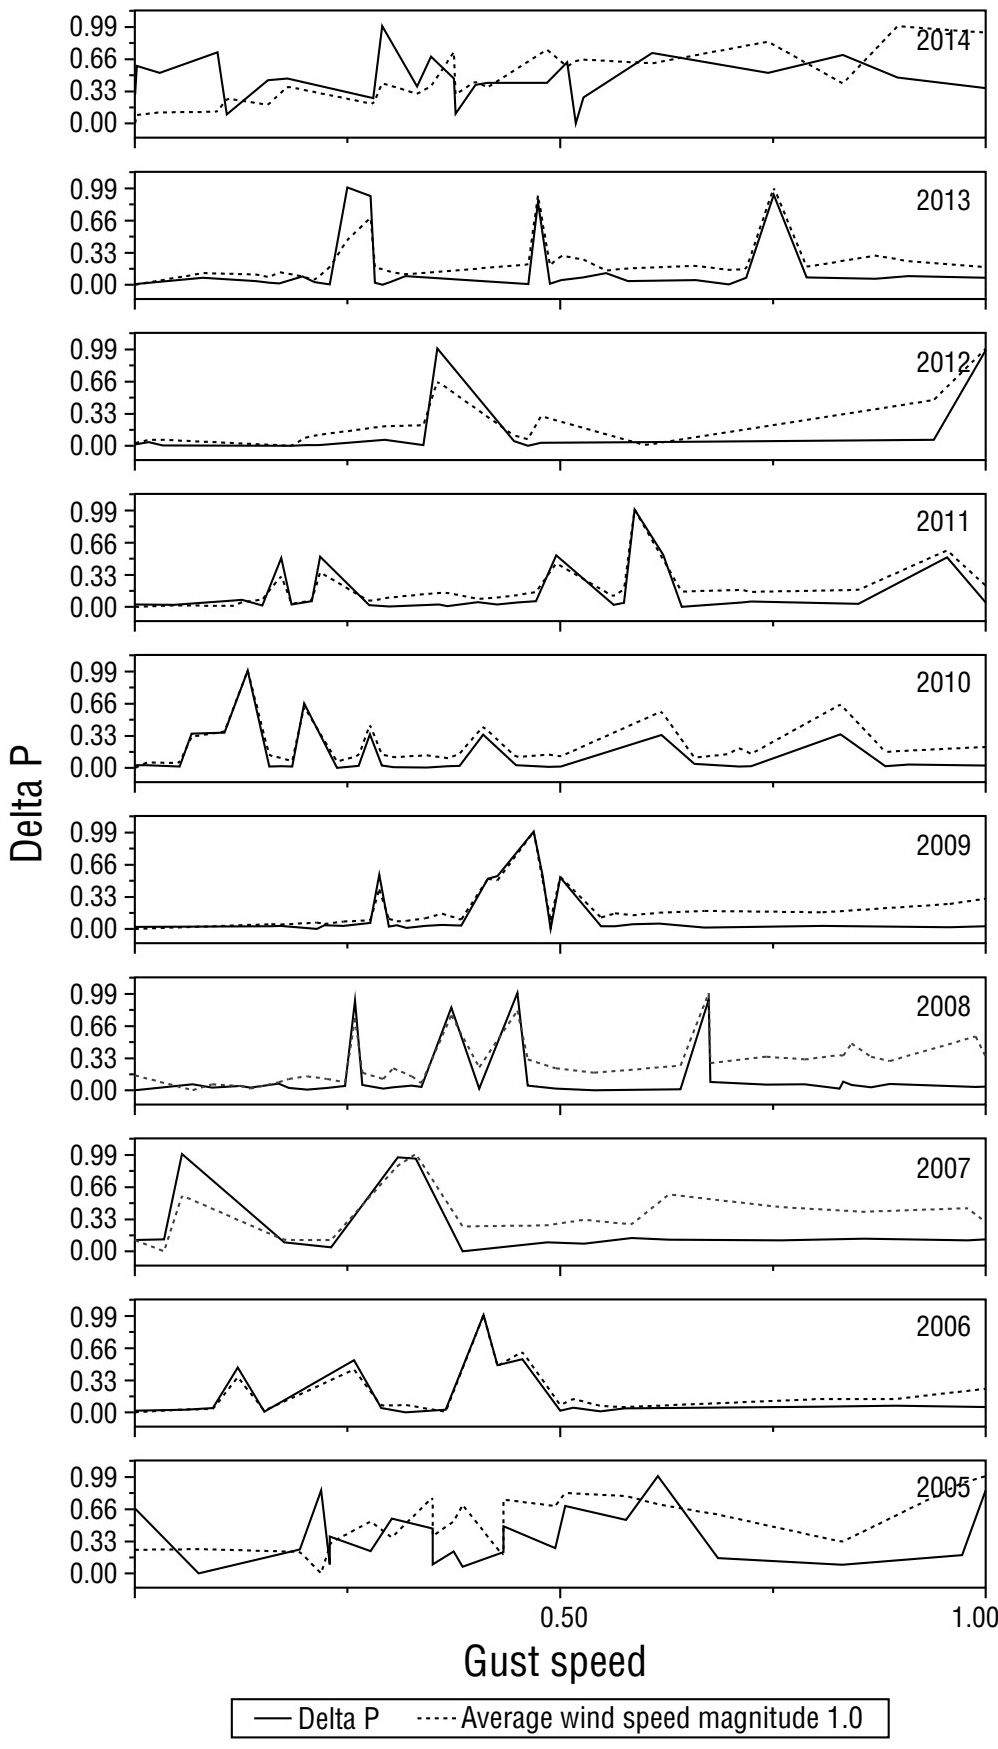
SAW event classifications were compared using the different variables proposed in the classifications mentioned in the Materials and methods section (Table 2). Figure 5 shows the normalized data of the magnitude of the average wind speed, the magnitude of the gust speed, and the pressure gradient for all the VSA events registered in the period from 2005 to 2014. This analysis was done to identify the relationship between the variables of pressure and magnitude of the average wind speed in La Rumorosa, and it showed that the greater the value of the pressure gradient, the greater the magnitude of the average wind speed. We show here the graph of the behavior of the variables in the presence of SAWs by year as a function of gust speed.

Table 2 Comparison of the results of the classification of the Santa Ana winds in La Rumorosa. 

Classification Weak Moderate Strong
(a) Class range classification using the average wind speed magnitude from Guzman-Morales et al. (2016). Vm (m∙s-1): <5, 5-10, 10-15 7.79% 91.88% 0.32%
Class range classification using the average wind speed magnitude from QuickScat Project (2003). Vm (m∙s-1): 4-6, 6-8, >8 42.10% 47.20% 10.70%
(b) Dimensionless classification (equation 2) <0.33, 0.33-0.66, >0.66 37.93% 47.93% 14.14%
(c) Normalized wind speed magnitude classification (equation 4) <0.33, 0.33-0.66, >0.66 32.76% 57.24% 10.00%

Figure 5 Normalized values of the magnitude of the average wind speed and the normalized pressure differential at La Rumorosa weather station during the period from 2005 to 2014. 

DISCUSSION

The proposed methodology supported by previous regional studies allows following an empirical model based on surface measurements and supported by synoptic scale maps, which contributes significantly to the understanding of local atmospheric dynamics in the northern area of Baja California, Mexico.

The classification obtained in this study can serve as a basis for establishing a relationship between SAWs and their effect on primary productivity in the Gulf of California and the coastal region of the California Current in the areas influenced by SAWs.

This information can be used by companies that have installed wind turbines in the area of La Rumorosa for their operational purposes during the presence of SAWs, whose incidence, according to our results, is highest during January.

According to the studies reviewed, SAW events are winds that occur from September to April, most frequently in December. However, in this work, we identified that this phenomenon also happened in May in the years 2008, 2011, and 2014.

In the proposed classification for SAW events in La Rumorosa, the magnitude of the velocity of occurrence considered was 4 m·s-1. SAW events here behaved in a similar manner to those reported in studies in southern California, with corresponding variables of wind direction, relative humidity, and atmospheric pressure; this was not observed for the magnitude of the wind speed in La Rumorosa, which reached only up to 14% of strong events (classification b).

The wind classification shown in Table 2, with the exception of the range in intervals of 5 m·s-1, differ for the SAW categories from 4% to 9% for weak, from 1% to 10% for moderate, and from 1% to 4% for strong. Between 86% and 90% of classifications were weak and moderate SAWs, and 58% to 67% were moderate and strong, which directly impact the generation of electric wind power through the wind turbines placed in the region.

This confirms that the presence of SAW events increases the wind potential available in the region of La Rumorosa. According to a previous study, wind energy harnessing associated with these SAW events for the year 2012 represented 10% of the total wind production in a turbine of the wind farm La Rumorosa I (Zamora 2016).

Based on the obtained results, it is estimated that SAW events reach this region of Baja California with less strength. This can be attributed to natural obstacles, such as mountains and uneven terrain, that decrease their speed on their way to the Pacific coast. Understanding the dynamics of these winds is essential given the growth in the energy sector projected for La Rumorosa, that is, given the future installation of wind farms and the operation of current ones (NADB 2013, CEE 2017, IEnova 2022). Consequently, knowing the behavior and occurrence of these winds allows wind power plants to make management and projection decisions.

The methodology used in this study could be applied to other regions influenced by SAWs, such as the border region between Baja California and Southern California, where there are wind farms on both sides of the border: in the municipalities of Ensenada and Tecate in Mexico, and in Imperial, San Diego, and Riverside counties in the United States. Riverside County has one of the most important areas for harnessing wind power, the area of Palm Springs. Therefore, the relevance of this study to understand the dynamics of the winds and their energy contribution lies in processing the information from the databases to obtain mathematical models for the prediction of wind energy in the short term.

ACKNOWLEDGMENTS

We thank the Comisión Nacional del Agua (Mexico) for obtaining meteorological data for the study and the Autonomous University of Baja California.

REFERENCES

Abatzoglou, JT, Barbero, R, Nauslar, NJ. 2013. Diagnosing Santa Ana winds in Southern California with synoptic-scale analysis. Weather Forecast. 28(3):704-710. https://doi.org/10.1175/WAF-D-13-00002.1 [ Links ]

Ackerman, S, Knox, J. 2011. Meteorology. Kendallville (IN): Jones & Bartlett Publishers. 577 p. [ Links ]

Álvarez, CA, Carbajal, N. 2019. Regions of influence and environmental effects of Santa Ana wind event. Air Qual Atmos Health. 12(9):1019-1034. https://doi.org/10.1007/s11869-019-00719-3 [ Links ]

Álvarez, CA, Carbajal, JN, Pineda-Martínez, LF, Tuxpan, J, Flores, DE. 2020. Dust deposition on the gulf of California caused by Santa Ana winds. Atmosphere. 11(3):275. https://doi.org/10.3390/atmos11030275 [ Links ]

Bytnerowicz, A, Cayan, D, Riggan, P, Schilling, S, Dawson, P, Tyree, M, Wolden, L, Tissell, R, Preisler, H. 2010. Analysis of the effects of combustion emissions and Santa Ana winds on ambient ozone during the October 2007 southern California wildfires. Atmos Environ. 44(5):678-687. https://doi.org/10.1016/j.atmosenv.2009.11.014 [ Links ]

Cao, Y, Fovell, RG. 2013. Predictability and sensitivity of downslope windstorms in San Diego County. In: Lane, T, Epifanio, C (eds.), 15th Conference on Mesoscale Processes: 2013 August 6-9, Portland, Oregon, United States of America. Portland (OR). p. 1-9. [ Links ]

Castro, R, Mascarenhas, A, Martínez-Díaz-de-León, A, Durazo, R, Gil-Silva, E. 2006. Spatial influence and oceanic thermal response to Santa Ana events along the Baja California Peninsula. Atmósfera. 19(3):195-211. https://www.revistascca.unam.mx/atm/index.php/atm/article/view/8560. [ Links ]

Castro, R, Parés-Sierra, A, Marinone, SG. 2003. Evolución y extensión de los vientos Santa Ana de febrero de 2002 en el océano, frente a California y la Península de Baja California = Evolution and extension of the Santa Ana winds of February 2002 over the ocean, off California and the Baja California Peninsula. Cienc Mar. 29(3):275-281. https://doi.org/10.7773/cm.v29i3.158 [ Links ]

[CICESE] Centro de Investigación Científica y de Educación Superior de Ensenada. 2003. Zonas Potencialmente Productoras de Energía Eólica en Baja California, México [Potential Wind Energy Production Zones in Baja California, Mexico]. Ensenada (Mexico): CICESE. 51 p. [ Links ]

[CEE] Comisión Estatal de Energía. 2017. Lo que hacemos: proyectos en operación [What we do: projects in operation]. Mexicali (Mexico): CEE; [accessed 2022 Oct 06]. http://www.energiabc.gob.mx /. [ Links ]

[CONAGUA] Comisión Nacional del Agua. 2022. Sistema de Información y Visualización de Estaciones Automáticas [Information and Visualization System of Automatic Stations]. Mexico City (Mexico): CONAGUA; [accessed 2022 Oct 10]. https://smn.conagua.gob.mx/es/observando-el-tiempo/estaciones-meteorologicas-automaticas-ema-s . [ Links ]

Conil, S, Hall, A. 2006. Local regimes of atmospheric variability: A case study of Southern California. J Clim. 19(17):4308-4325. https://doi.org/10.1175/JCLI3837.1 [ Links ]

Félix‐Bermúdez, A, Delgadillo‐Hinojosa, F, Huerta‐Diaz, MA, Camacho‐Ibar, V, Torres‐Delgado, EV. 2017. Atmospheric inputs of iron and manganese to coastal waters of the southern California Current System: Seasonality, Santa Ana winds, and biogeochemical implications. J Geophys Res Oceans. 122(11):9230-9254. https://doi.org/10.1002/2017JC013224 [ Links ]

Fovell, RG, Cao, Y. 2017. The Santa Ana winds of southern California: Winds, gusts, and the 2007 witch fire. Wind Struct. 24(6):529-564. https://doi.org/10.12989/was.2017.24.6.529 [ Links ]

Gershunov, A, Guzman-Morales, J, Hatchett, B, Guirguis, K, Aguilera, R, Shulgina, T, Abatzoglou JT, Cayan D, Pierce D, Williams P, et al. 2021. Hot and cold flavors of southern California’s Santa Ana winds: their causes, trends, and links with wildfire. Clim Dyn. 57(7):2233-2248. https://doi.org/10.1007/s00382-021-05802-z [ Links ]

Glickman, TS, Zenk, W. 2000. Glossary of meteorology. Boston (MA): American Meteorological Society. 855 p. [ Links ]

Guzman‐Morales, J, Gershunov, A, Theiss, J, Li, H, Cayan, D. 2016. Santa Ana Winds of Southern California: Their climatology, extremes, and behavior spanning six and a half decades. Geophys Res Lett. 43(6):2827-2834. https://doi.org/10.1002/2016GL067887 [ Links ]

Hatchett, BJ, Smith, CM, Nauslar, NJ, Kaplan, ML. 2018. Brief communication: Synoptic-scale differences between Sundowner and Santa Ana wind regimes in the Santa Ynez mountains, California. Nat Hazards Earth Syst Sci. 18(2):419-427. https://doi.org/10.5194/nhess-18-419-2018 [ Links ]

Hsu, HM, Oey, LY, Johnson, W, Dorman, C, Hodur, R. 2007. Model wind over the central and southern California coastal ocean. Mon Weather Rev. 135(5):1931-1944. https://doi.org/10.1175/MWR3389.1 [ Links ]

Hu, H, Liu, WT. 2003. Oceanic thermal and biological responses to Santa Ana winds. Geophys Res Lett. 30(11):1596-1599. https://doi.org/10.1029/2003GL017208 [ Links ]

Hughes, M, Hall, A. 2010. Local and synoptic mechanisms causing Southern California’s Santa Ana winds. Clim Dyn. 34(6):847-857. https://doi.org/10.1007/s00382-009-0650-4 [ Links ]

Hughes, M, Hall, A, Kim, J. 2009. Anthropogenic reduction of Santa Ana winds. Sacramento (USA): California Climate Change Center. 29 p. [ Links ]

[IEnova] Infraestructura Energética Nova. Our company: our Assets; 2022c. Mexico City (Mexico); [accessed 2022 Oct 10]. https://www.ienova.com.mx/activos.php . [ Links ]

[INEGI] Instituto Nacional de Estadística y Geografía. 2022. Mapa Digital de México [Digital Map of Mexico]. Mexico City (Mexico): INEGI; [accessed 2022 Oct 10]. http://gaia.inegi.org.mx/mdm6 /. [ Links ]

Jin, Y, Randerson, JT, Faivre, N, Capps, S, Hall, A, Goulden, ML. 2014. Contrasting controls on wildland fires in Southern California during periods with and without Santa Ana winds. J Geophys Res Biogeosci. 119(3):432-450. https://doi.org/10.1002/2013JG002541 [ Links ]

Jones, C, Fujioka, F, Carvalho, LMV. 2010. Forecast skill of synoptic conditions associated with Santa Ana winds in Southern California. Mon Weather Rev. 138(12):4528-4541. https://doi.org/10.1175/2010MWR3406.1 [ Links ]

Keeley, JE, Fotheringham, CJ, Moritz, MA. 2004. Lessons from October 2003. Wildfires in Southern California. J For. 102(7):26-31. [ Links ]

Langford, AO, Pierce, RB, Schultz, PJ. 2015. Stratospheric intrusions, the Santa Ana winds, and wildland fires in Southern California. Geophys Res Lett. 42(14):6091-6097. https://doi.org/10.1002/2015GL064964 [ Links ]

Miller, NL, Schlegel, NJ. 2006. Climate change projected fire weather sensitivity: California Santa Ana wind occurrence. Geophys Res Lett. 33(15):1-5. https://doi.org/10.1029/2006GL025808 [ Links ]

Navarro-Olache, LF, Castro, R, Durazo, R, Hernández-Walls, R, Mejía-Trejo, A, Flores-Vidal, X, Flores-Morales, AL. 2020. Influence of Santa Ana winds on the surface circulation of Todos Santos Bay, Baja California, Mexico. Atmósfera. 34(1):97-109. https://doi.org/10.20937/ATM.52719 [ Links ]

[NADB] North American Development Bank. 2013. Energía Sierra Juárez Proyecto de Energía Eólica Primera fase Municipio de Tecate, Baja California [Energy Sierra Juárez Wind Energy Project First Phase Municipality of Tecate, Baja California]. Tecate (Mexico): NADB; [accessed 2022 Oct 10]. https://www.nadb.org/es/nuestros-proyectos/proyectos-de-infraestructura/energia-sierra-juarez-proyecto-de-energia-eolica-primera-fase-municipio-de-tecate-baja-california . [ Links ]

[NWS] National Weather Service. 2005. Weather Map Archive: Surface Analysis Map 2005. Fort Collins (USA): Colorado State University; [accessed 2022 Oct 10]. http://archive.atmos.colostate.edu/data/sfc/QYAA00/0501 /. [ Links ]

[NWS] National Weather Service. 2006. Weather Map Archive: Surface Analysis Map 2006. Fort Collins (USA): Colorado State University; [accessed 2022 Oct 10]. http://archive.atmos.colostate.edu/data/sfc/QYAA00/0601 /. [ Links ]

[NWS] National Weather Service. 2007. Weather Prediction Center: WPC Surface Analysis Archive October 22, 2007. Maryland (USA): National Oceanic and Atmospheric Administration; [accessed 2022 Oct 10]. https://www.wpc.ncep.noaa.gov/archives/web_pages/sfc/sfc_archive_maps . [ Links ]

[NWS] National Weather Service. 2008. Weather Prediction Center: WPC Surface Analysis Archive October 22, 2008. Maryland (USA): National Oceanic and Atmospheric Administration; [accessed 2022 Oct 10]. https://www.wpc.ncep.noaa.gov/archives/web_pages/sfc/sfc_archive_maps.hp?arcdate=01/01/2008&selmap=2008010100&maptype=all . [ Links ]

[NWS] National Weather Service. 2009. Weather Prediction Center: WPC Surface Analysis Archive January 06, 2008. Maryland (USA): National Oceanic and Atmospheric Administration; [accessed 2022 Oct 10]. https://www.wpc.ncep.noaa.gov/archives/web_pages/sfc/sfc_archive_maps.php?arcdate= 01/01/2009&selmap=2009010100&maptype=all . [ Links ]

[NWS] National Weather Service. 2010. Weather Prediction Center: WPC Surface Analysis Archive February 16, 2010. Maryland (USA): National Oceanic and Atmospheric Administration; [accessed 2022 Oct 10]. https://www.wpc.ncep.noaa.gov/archives/web_pages/sfc/sfc_archive_maps.php?arcdate=01/01/2010&selmap=2010010100&maptype=all . [ Links ]

[NWS] National Weather Service. 2011. Weather Prediction Center: WPC Surface Analysis Archive February 09, 2011. Maryland (USA): National Oceanic and Atmospheric Administration; [accessed 2022 Oct 10]. https://www.wpc.ncep.noaa.gov/archives/web_pages/sfc/sfc_archive_maps.php?arcdate=01/01/2011&selmap=2011010100&maptype=all . [ Links ]

[NWS] National Weather Service. 2012. Weather Prediction Center: WPC Surface Analysis Archive March 21, 2012. Maryland (USA): National Oceanic and Atmospheric Administration; [accessed 2022 Oct 10]. https://www.wpc.ncep.noaa.gov/archives/web_pages/sfc/sfc_archive_maps.php?arcdate=01/01/2012&selmap=2012010100&maptype=all . [ Links ]

[NWS] National Weather Service. 2013. Weather Prediction Center: WPC Surface Analysis Archive October 17, 2013. Maryland (USA): National Oceanic and Atmospheric Administration; [accessed 2022 Oct 10]. [ Links ]

QuickScat Project. 2003. Santa Ana Wind Event Over California. La Cañada Flintridge (USA): NASA Jet Propulsion Laboratory; [accessed 2022 Oct 10]. https://earthobservatory.nasa.gov/images/10729 . [ Links ]

Raphael, MN. 2003. The Santa ana winds of California. Earth Interact. 7(8):1-13. https://doi.org/10.1175/1087-3562(2003)007<0001:TSAWOC>2.0.CO;2 [ Links ]

Raphael, M, Finley, J. 2007. The relationship between El Niño and the duration and frequency of the Santa Ana winds of Southern California. Prof Geogr. 59(2):184-192. https://doi.org/10.1111/j.1467-9272.2007.00606.x [ Links ]

Rolinski, T, Capps, SB, Zhuang, W. 2019. Santa Ana Winds: A Descriptive Climatology. Weather Forecast. 34(2):257-275. https://doi.org/10.1175/WAF-D-18-0160.1 [ Links ]

Serpa-Usta, Y, López-Lambraño, AA, Flores, DL, Gámez-Balmaceda, E, Martínez-Acosta, L, Medrano-Barboza, JP, Remolina-López, JF, López-Ramos, A, López-Lambraño, M. 2021. Santa Ana Winds: Fractal-Based Analysis in a Semi-Arid Zone of Northern Mexico. Atmosphere. 13(1):48. https://doi.org/10.3390/atmos13010048 [ Links ]

Small, IJ. 1995. Santa Ana winds and the fire outbreak of fall 1993. Memorandum Technical NWS WR-230. Oxnard (CA): National Weather Service Forecast Office. 56 p. [ Links ]

Sommers, WT. 1978. LFM forecast variables related to Santa Ana wind occurrences. Mon Weather Rev. 106(9):1307-1316. https://doi.org/10.1175/1520-0493(1978)106<1307:LFVRTS>2.0.CO;2Links ]

Sosa-Ávalos, R, Gaxiola-Castro, G, Durazo, R, Mitchell, BG. 2005. Effect of Santa Ana winds on bio-optical properties off Baja California = Efecto de los vientos Santa Ana en las propiedades bio-ópticas frente a Baja California. Cienc Mar. 31(2):339-348.http://dx.doi.org/10.7773/cm.v31i2.60 [ Links ]

Trasviña, A, Ortiz-Figueroa, M, Herrera, H, Cosío, MA, González, E. 2003. ‘Santa Ana’ winds and upwelling filaments off Northern Baja California. Dyn Atmos Oceans. 37(2):113-129. https://doi.org/10.1016/S0377-0265(03)00018-6 [ Links ]

Westerling, AL, Cayan, DR, Brown, TJ, Hall, BL, Riddle, LG. 2004. Climate, Santa Ana winds and autumn wildfires in southern California. Eos Trans AGU. 85(31):289-296. https://doi.org/10.1029/2004EO310001 [ Links ]

Zamora, M. 2016. Variabilidad del potencial eólico y su relación con fenómenos meteorológicos en Baja California [Variability of wind potential and its relationship with meteorological phenomena in Baja California] [dissertation]. Mexicali (Mexico): Universidad Autónoma de Baja California. 113 p. [ Links ]

Received: April 19, 2022; Accepted: November 04, 2022

*Corresponding author. E-mail: zamora.marlene@uabc.edu.mx

English translation by Claudia Michel-Villalobos.

Creative Commons License This is an open-access article distributed under the terms of the Creative Commons Attribution License