


 texto en
  Inglés (pdf)
 Artículo en XML
 Referencias del artículo
 Enviar artículo por email
 Citado por SciELO
  Similares en
SciELO
Similares en
SciELO 
 Permalink
INTRODUCTION
The pantropical spotted dolphin (Stenella attenuata) is found in all oceans, from tropical to temperate waters between 40° N and 40° S (Jefferson et al. 1993). In the Eastern Tropical Pacific there are 2 offshore stocks and a coastal stock that has been classified as a subspecies (Stenella attenuata graffmani) having limited distribution from the coast to 200 km offshore, from Mexico to Peru (Dizon et al. 1994). All 3 stocks have been greatly impacted by the purse seine and pelagic longline tuna fisheries, which led to a decrease of about 85% of the offshore stocks and about 58% of the coastal stock during the 1990s due to bycatch (Gerrodette and Forcada 2002, 2005; García and Dawson 2003). In the Mexican Central Pacific (MCP) the spotted dolphin is the dominant cetacean species, with relatively constant density of individuals throughout the year (Juárez-Ruiz 2014, González-Salguero 2017, Kono-Martínez et al. 2017), but research on its ecology has not been extensively addressed.
Spatial and temporal oceanographic changes exert influence on the distribution and abundance of cetaceans, affecting their ecological aspects directly (metabolic processes) and indirectly (through prey distribution) (Ballance et al. 2006, Durant et al. 2007, Sprogis et al. 2018). Seasonal environmental variability in the MCP region is characterized by 2 main periods (Ambriz-Arreola et al. 2018): (1) mixed (February-June), characterized by intense coastal upwelling, high phytoplankton biomass, and noticeable decrease in sea surface temperature (<25 °C); and (2) stratified (July-January), characterized by a pronounced thermocline, low primary productivity, and high sea surface temperature (>28 °C, López-Sandoval et al. 2009). Interannual variability in the MCP is primarily associated with basin-scale oceanographic phenomena such as El Niño Southern/Oscillation (ENSO) and the northeast Pacific marine heatwave also known as “The Blob” (Fiedler 2002, Bond et al. 2015). Fiedler (2002) defines ENSO as “an unstable interaction between sea surface temperature and atmospheric pressure that results in variations in oceanographic conditions in the central and eastern tropical Pacific Ocean” and describes it as having 3 phases: El Niño, characterized by an unusual increase in sea surface temperature (SST, warm conditions), weak trade winds, reduced nutrient advection, and a deeper mixed layer; La Niña, characterized by strong trade winds, a shallow thermocline, increased primary productivity, and a decrease in SST (cold conditions); and neutral conditions (Fiedler 2002). The Blob was defined as an SST anomaly of ~2.50 °C above the long-term mean (1982-2015) of the near-surface waters (upper ~100 m) that affected the Pacific northeast from 2013 to 2015, with an intense peak in 2014 (Bond et al. 2015). SST anomalies like ENSO and The Blob influence the distribution (Benson et al. 2002, Sprogis et al. 2018), abundance (Sprogis et al. 2018), reproductive rates (Cartwright et al. 2019), and migration (Ramp et al. 2015) of cetaceans either directly or indirectly through the effects on prey distribution (Durant et al. 2007; Salvadeo et al. 2010, 2011; Bond et al. 2015; Cavole et al. 2016). Overall, these environmental variations (seasonal and interannual) could influence the distribution and abundance of spotted dolphins in the MCP. Furthermore, as climate change is expected to increase the frequency and intensity of these oceanographic phenomena, understanding their potential effects on marine mammals will become crucial (Cai et al. 2014). However, research on the effect of SST anomalies on the ecology of cetaceans in the MCP region is null.
We hypothesized that oceanographic conditions resulting from SST anomalies and regional seasonal patterns, which often result in changes in primary productivity in the MCP and affect prey availability for top predators, may change the distribution and abundance of the spotted dolphin. Therefore, the present study investigated the relationship between the distribution/abundance of spotted dolphins and environmental variability in the MCP considering seasonal periods (mixed and stratified) and interannual SST anomalies (cold, neutral, and warm).
MATERIALS AND METHODS
Study area
This study was conducted in the MCP, in a region encompassing 16.50° to 21.50° N and 102.33° to 107.69° W, covering approximately 68,200 km2. The study area was divided into 2 strata: the coastal stratum, which included the continental shelf and slope waters, up to 31.0 km off the coast; and the oceanic stratum, which included deeper waters, from 31.1 to 180.0 km offshore (Fig. 1).
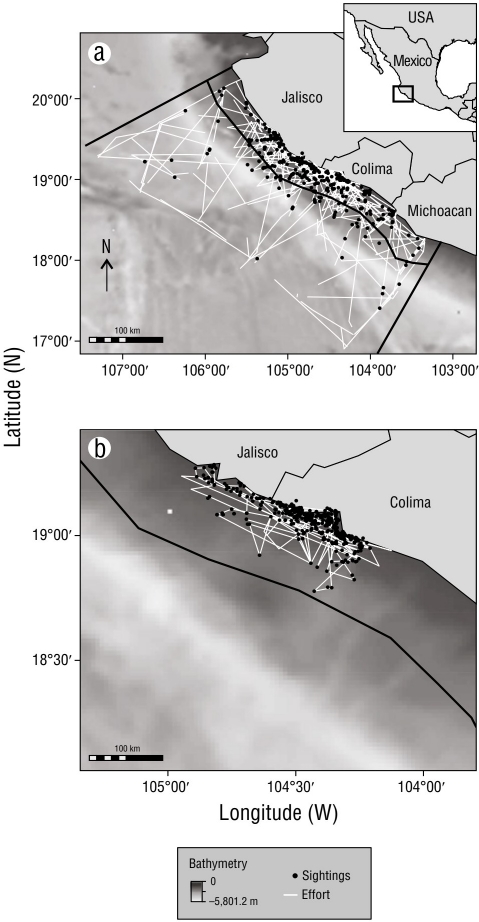
Figure 1 Location of the study area in the Mexican Central Pacific and spotted dolphin sightings (Stenella attenuata), divided into 2 strata (coastal and oceanic), recorded during the large-boat (a) and small-boat (b) surveys across the study period from 2010 to 2015. The line running parallel to the coast represents the boundary between the coastal and oceanic strata. The black dots indicate sightings; the white lines, survey transects; and the background color, the bathymetry of the region.
Survey data
During January 2010 through November 2015, a total of 16 semisystematic surveys were conducted aboard a large boat (LB; 10.67 m in length, 4.30 m platform height), covering both the coastal and the oceanic strata. In addition, biweekly coastal surveys (n = 134) were conducted from a small boat (SB, 7.62 m in length, 2.50 m platform height) in Colima and southern Jalisco. A total survey effort of 31,694.66 km was completed (LB surveys = 16,376.34 km and SB surveys = 15,318.31 km).
Survey speed was kept constant at 10-12 knots, and tracks were recorded using a Garmin map 76CS global positioning system. Two observers using 7 × 50 Fujinon binoculars were situated on the highest platform of the boat. Spotted dolphin sightings were made during daylight hours (7:00 AM to 7:00 PM) with preset rotations (40-min observation time and 40-min rest time per person to avoid fatigue bias). Another person in the center position recorded observer status (1 = active or 0 = inactive), sea condition based on the Beaufort scale, and sighting data (detailed below). Active observations were carried out only when sea/wind conditions were ≤3 on the Beaufort scale; otherwise, observers were inactive and only dolphins close to the boat were recorded. The information recorded for each spotted dolphin sighting included date, time, observation status, geographical position, radial angle and reticule on the binoculars, sighting number, and estimated group size.
Distribution analyses
Sighting data were standardized to eliminate bias due to differences in survey effort (traveled kilometers) following the methodology proposed by Kiszka et al. (2007). Dolphin sighting rate (i.e., the number of sightings·effort-1, in kilometers) was determined. Daily sighting rate was estimated for both LB and SB surveys. Only LB survey data were used for analyses by stratum (spatial analysis). Timescale analyses were made using sighting rate data separately for LB and SB surveys because of differences in periodicity and the sampled area. Data showed no normality or homoscedasticity; therefore, nonparametric tests were used to assess significant differences in sighting rate. All statistical analyses were carried out with a significance level of 0.05 using the Statistica v.12.0 software.
Spotted dolphin distribution and relationship with the environment
To relate spotted dolphin distribution with environmental conditions, time-scale periods were first determined. The regional seasonal periods were grouped considering the definition provided by Ambriz-Arreola et al. (2018): (1) mixed (February-June) and (2) stratified (July-January) (Fig. 2). The National Oceanic and Atmospheric Administration (NOAA, USA) Extended Reconstructed Sea Surface Temperature Version 5 (ERSST V5) was used to build anomaly composites of SST (Huang et al. 2017). These data are available at https://www.ncdc.noaa.gov/data-access/marineocean-data/extended-reconstructed-sea-surface-temperature-ersst-v5. The reconstructed monthly surface temperature anomalies in ten 2 × 2° quadrants (from 15° to 21° N and from 101° to 109° W) were extracted from the ERSST database. Anomalies were calculated by subtracting the long-term (1971-2000) climatology value from each monthly value in each quadrant. A monthly time series was then calculated by averaging the value of the 10 quadrants, thus obtaining an SST anomaly value for each month in our study period. Monthly SST anomaly averages were then classified into warm, neutral, and cold considering a threshold of +/-0.50 °C (Huang et al. 2017).
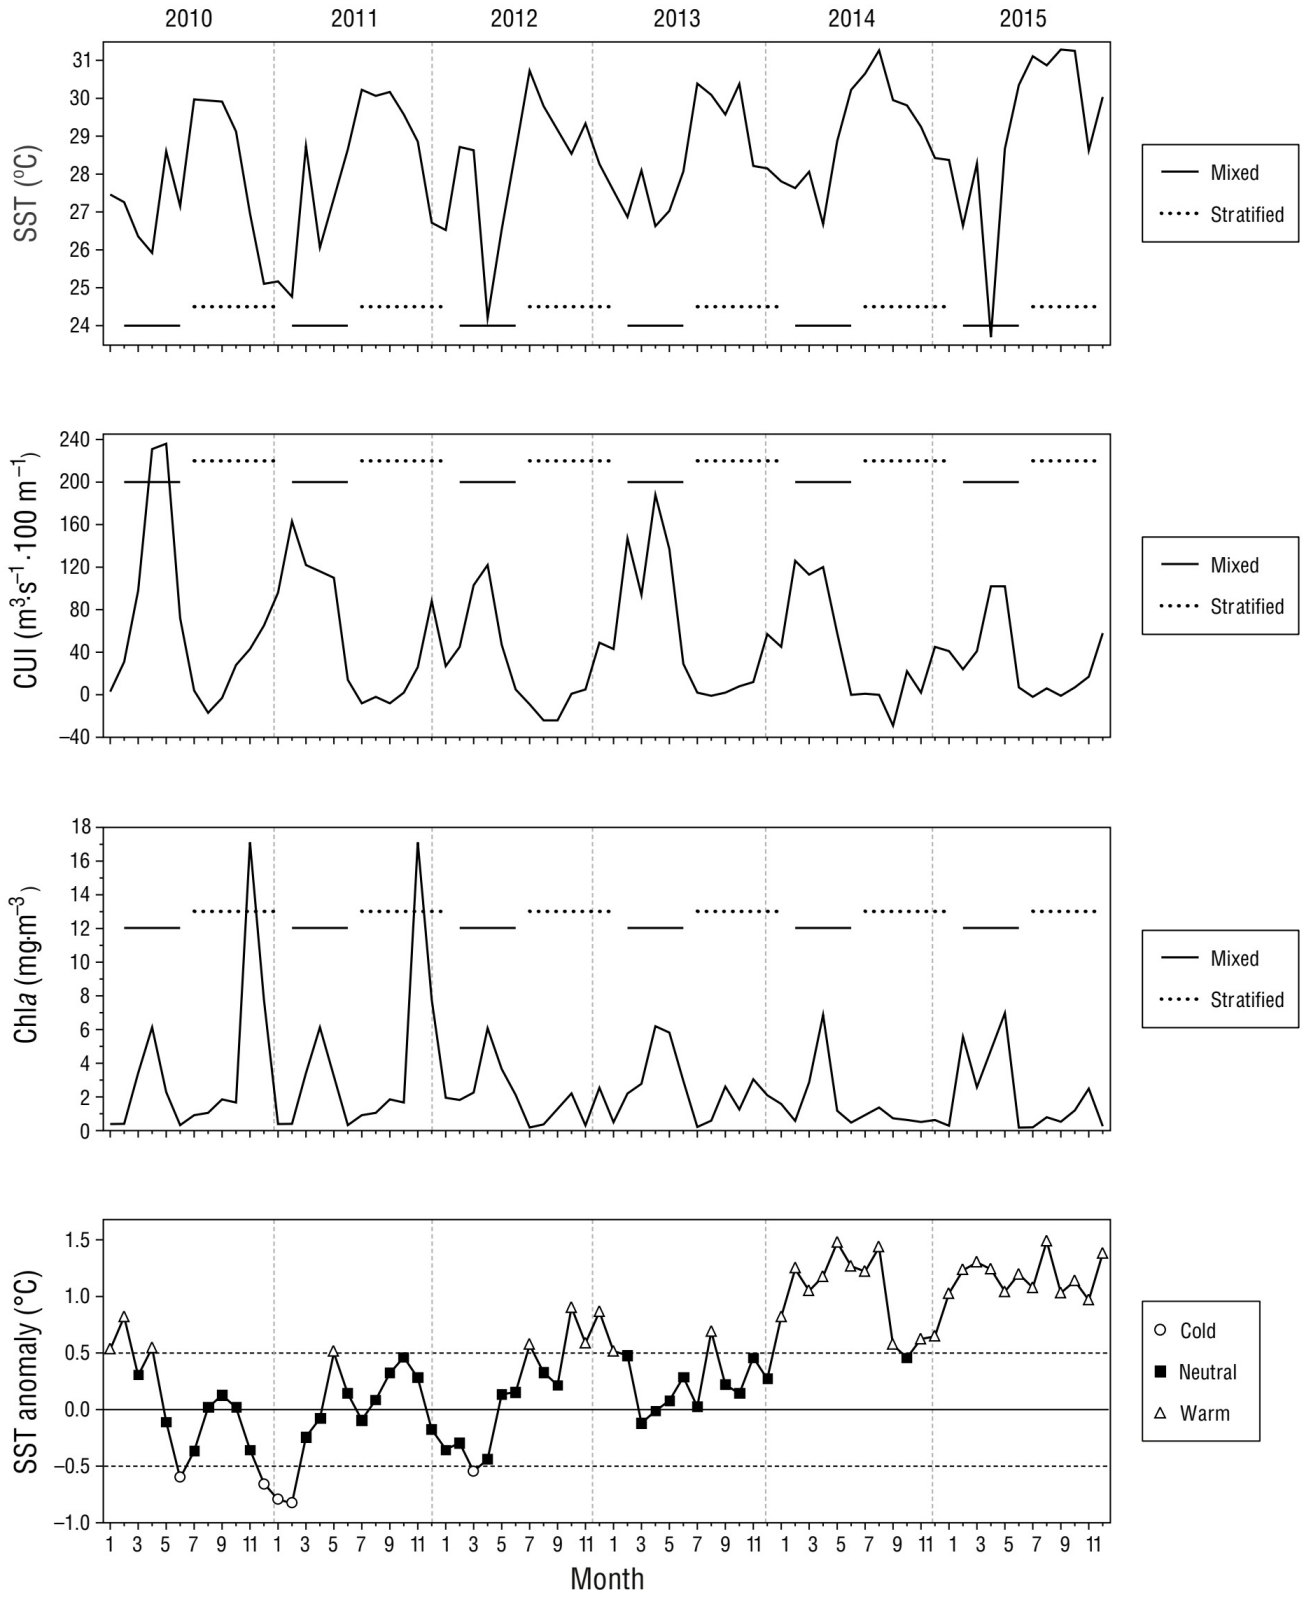
Figure 2 Environmental conditions in the study area in the Mexican Central Pacific across the study period (2010-2015). Mean monthly sea surface temperature (SST), coastal upwelling index (CUI), chlorophyll a concentration (Chla), and SST anomalies (cold, neutral, and warm) are shown. The solid horizontal line indicates the seasonal mixed period, and the dashed line the seasonal stratified period.
SST and chlorophyll a (Chla) values were obtained from NOAA’s ERDDAP (https://coastwatch.pfeg.noaa.gov/erddap/index.html) for each spotted dolphin sighting location. SST and Chla values were collected by the Moderate Resolution Imaging Spectroradiometer (MODIS Aqua) with a 4-km spatial resolution and a monthly temporal resolution. Weekly data were downloaded, and mean monthly values were estimated. The SST and Chla values in the satellite grid node closest to each dolphin observation were used as proxies for the environmental conditions where these organisms occurred. Additionally, the ArcGis software v.10.2 was used to obtain the nearest distance to the coast (in kilometers) for each spotted dolphin sighting position.
Considering that 92.75% of the sightings occurred within the coastal stratum (Fig. 1), environmental data analyses (i.e., mean distance to the coast, SST, and Chla values for each sighting location) were performed using only coastal sightings, pooling data from both platforms, for both seasonal periods (mixed and stratified) and the 3 SST anomalies (cold, neutral, and warm). Nonparametric tests, with a 0.05 significance level, were used to assess potential differences. The relationship of spotted dolphins sighting rate with environmental variables was tested using Spearman correlations.
Density and abundance estimates
A total of 202 spotted dolphin sightings recorded during 16 active LB surveys (effort = 14,947.64 km) were used to estimate population abundance. The density and abundance of spotted dolphins were estimated using distance sampling by linear transect (Buckland et al. 2001), which uses the perpendicular distance to the object of study from the transect line to quantify sighting probability. The angle and reticule recorded for each dolphin sighting were used to calculate the perpendicular distance of the sighting concerning the transect line (x), using the equations proposed by Jaramillo-Legorreta et al. (1999). Distance software v.7.2 was used to determine the detection function [g(x)], which indicates the probability of detecting dolphins within a distance x of the transect line (Buckland et al. 2001). To improve the detection function of each model and its expansion series, all perpendicular distances of spotted dolphin sightings in the region were analyzed in conjunction; truncation of the greatest perpendicular distances was performed to determine an effective bandwidth (Buckland et al. 2001). The model with the lowest Akaike information criterion score (Hilborn and Mangel 1997) was chosen to obtain the best estimate of density (dolphins per square kilometer) and abundance (total number of dolphins) by stratum and time-scale period, with the corresponding estimated 95% confidence interval and coefficient of variation.
RESULTS
Spatiotemporal distribution
A total of 746 spotted dolphin sightings were recorded, 305 during the LB surveys and 441 during the SB surveys. Overall mean spotted dolphin sighting rate was estimated to be 0.024 sightings·km-1, with a mean sighting rate of 0.031 sightings·km-1 for the SB surveys and 0.019 sightings·km-1 for the LB surveys.
The mean spotted dolphin sighting rate recorded during the SB surveys showed significant differences at the seasonal scale (Mann-Whitney: U = 3,444.50, P < 0.050), with a lower sighting rate during the mixed periods (0.028 sightings·km-1) compared to the stratified periods (0.036 sightings·km-1). In contrast, mean sighting rate did not show significant differences at the interannual scale (Kruskal-Wallis: H 2,183 = 3.908, P = 0.142), although mean sighting rate was lowest during the cold periods (0.021 sightings·km-1 than during the warm (0.033 sightings·km-1) and neutral periods (0.033 sightings·km-1) (Fig. 3).
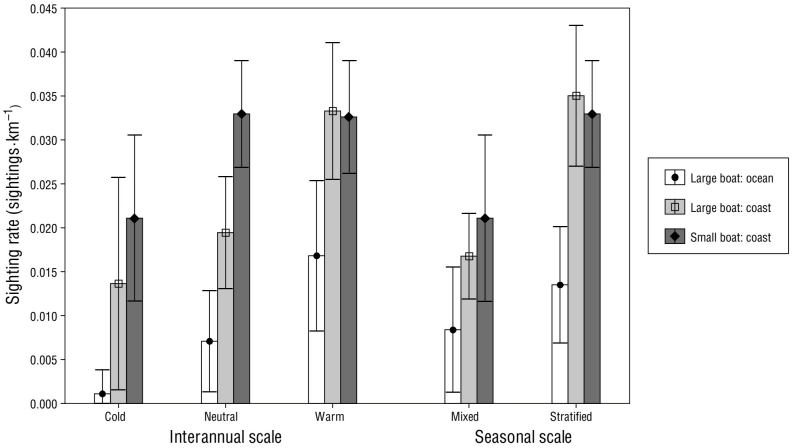
Figure 3 Mean Stenella attenuata sighting rate in the Mexican Central Pacific across the study period (2010-2015), by boat survey (large boat: coastal and oceanic strata; small boat: coastal stratum) and by interannual scale (sea surface temperature anomalies: cold, neutral, and warm) and seasonal period (mixed and stratified). Whiskers represent the 95% confidence interval for the mean.
For the LB surveys, mean sighting rates in the coastal stratum were significantly higher than those in the oceanic stratum (Mann-Whitney: U = 3,328.00, P < 0.050; Fig. 3). At the seasonal scale mean sighting rates during the mixed periods were significantly lower than during the stratified periods in the coastal (Mann-Whitney: U = 1,104.50, P < 0.050) and oceanic (Mann-Whitney: U = 918.00, P < 0.050) strata (Fig. 3). Mean sighting rates also showed significant differences at the interannual scale (Kruskal-Wallis: H 2,118 = 9.243, P < 0.050), with a significantly higher mean sighting rate during the warm periods than during the neutral periods in both the coastal (Mann-Whitney: U = 1,051.00, P < 0.050) and oceanic (Mann-Whitney: U = 702.00, P < 0.050) strata (Fig. 3). In contrast, even though the mean sighting rate was lower during the cold periods than during the warm and neutral periods in both strata, no significant differences were found (Mann-Whitney: P > 0.050 in all cases) (Fig. 3).
Distribution in relation to environmental variables
Within the coastal stratum spotted dolphin sighting locations showed an overall mean distance to the coast of 11.25 km (range: 0.03-155.46 km). There were no significant differences at the seasonal scale (Mann-Whitney: U = 47,473.00, P = 0.056), with a mean distance to the coast of 6.22 km during the mixed periods and 6.92 km during the stratified periods (Fig. 4). However, significant differences at the interannual scale were determined (Kruskal-Wallis: H 2,664 = 67.774, P < 0.050), with sighting locations farther from shore during the warm periods (8.50 km) in comparison with the neutral (4.40 km; Mann-Whitney: U = 30,472.00, P < 0.050) and cold (3.50 km; Mann-Whitney: U = 3,897.00, P < 0.050) periods (Fig. 4).
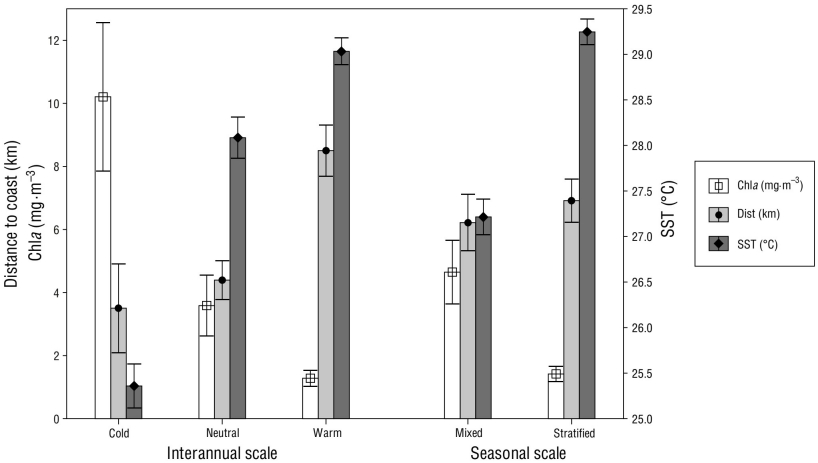
Figure 4 Mean values for environmental variables (sea surface temperature [SST] and chlorophyll a concentration [Chla]) and distance to coast at the Stenella attenuata sighting locations in the coastal stratum surveyed in the Mexican Central Pacific across the study period (2010-2015), by interannual scale (sea surface temperature anomalies: cold, neutral, and warm) and seasonal period (mixed and stratified). Whiskers represent the 95% confidence interval for the mean.
Overall, the mean SST at the coastal sighting locations was 28.50 °C (range: 23.60-31.40 °C). Seasonal SST values portrayed the expected seasonal pattern, with regional mixed periods being significantly cooler than the stratified periods (Mann-Whitney: U = 15,522.50, P < 0.050) (Fig. 4). Interannual mean SSTs also showed significant differences (Kruskal-Wallis: H 2,624 = 129.497, P < 0.050), with sighting locations being significantly cooler during the cold periods (25.36 °C) than during the neutral (28.08 °C; Mann-Whitney: U = 694.50, P < 0.050) and warm (29.03 °C; Mann-Whitney: U = 196.50, P < 0.050) periods (Fig. 4). Additionally, SST was significantly higher during the warm periods than during the neutral periods (Mann-Whitney: U = 27,321.00, P < 0.050) (Fig. 4).
Coastal sighting locations had a mean Chla concentration of 2.30 mg·m-3 (range: 0.10-42.90 mg·m-3). Significant differences were determined at the seasonal scale, with higher concentrations during the mixed periods (4.65 mg·m-3) than during the stratified periods (1.42 mg·m-3; Mann-Whitney: U = 21,386.00, P < 0.050) (Fig. 4). As expected, mean Chla concentrations showed significant differences at the interannual scale (Kruskal-Wallis: H 2,530 = 125.007, P < 0.001), being significantly higher during the cold periods (10.21 mg·m-3) than during the neutral (3.58 mg·m-3; Mann-Whitney: U = 859.00, P < 0.050) and warm (1.28 mg·m-3; Mann-Whitney: U = 615.00, P < 0.050) periods. Also, Chla concentrations were significantly lower during the warm periods than during the neutral periods (Mann-Whitney: U = 15,864.00, P < 0.050) (Fig. 4).
The spotted dolphin sighting rate showed a significant positive correlation with SST (r s [257] = 0.146, P < 0.050). However, no significant correlation was found with Chla concentrations (r s [251] = -0.030, P = 0.641) and distance to coast (r s [262] = 0.047, P = 0.444).
Dolphin density and abundance
Using truncated data (w = 1.55 km) the best density and abundance estimates were obtained with half-normal hermite polynomial and uniform-cosine models (Table 1). Total seasonal density (D) and abundance (N) estimates were higher during the mixed periods (D = 0.21 dolphins·km-2, N = 15,663 dolphins) than during the stratified periods (D = 0.12 dolphins·km-2, N = 9,098 dolphins) (Table 1). At the interannual scale total density and abundance estimates were higher during neutral periods (D = 0.19 dolphins·km-2, N = 14,640 dolphins) and lower during cold periods (D = 0.04 dolphins·km-2, N = 2,693 dolphins) (Table 1).
Table 1 Mean density (D, dolphins·km-2) and abundance (N) estimates for Stenella attenuata in coastal and oceanic strata of the Mexican Central Pacific (2010-2015), by interannual scale (sea surface temperature anomalies: cold, neutral, and warm; °C) and seasonal period (mixed and stratified). Akaike information criterion (AIC), coefficient of variation (CV, applies to both D and N), and 95% confidence intervals (CI) are also shown.
| Period | Model | AIC (No. of parameters) | Stratum | D | CI (95%) | CV (%) | N | CI (95%) | ||
| Cold | Half-normal (Hermite polynomial) | 3.53 (0) | Coast | 0.15 | 0.04 | 0.62 | 74.89 | 1,979 | 477 | 8,206 |
| Ocean | 0.01 | 0.00 | 0.07 | 105.46 | 714 | 124 | 4,107 | |||
| Total | 0.04 | 0.01 | 0.12 | 64.94 | 2,693 | 782 | 9,277 | |||
| Neutral | Uniform (Cosine) | -73.67 (5) | Coast | 0.38 | 0.23 | 0.63 | 25.51 | 5,048 | 3,081 | 8,270 |
| Ocean | 0.15 | 0.08 | 0.31 | 36.38 | 9,592 | 4,786 | 19,224 | |||
| Total | 0.19 | 0.11 | 0.33 | 28.18 | 14,640 | 8,496 | 25,225 | |||
| Warm | Uniform (Cosine) | -82.51 (5) | Coast | 0.24 | 0.10 | 0.55 | 44.12 | 3,162 | 1,378 | 7,258 |
| Ocean | 0.14 | 0.08 | 0.24 | 28.51 | 8,543 | 4,921 | 14,829 | |||
| Total | 0.16 | 0.09 | 0.25 | 25.38 | 11,705 | 7,161 | 19,132 | |||
| Mixed | Uniform (Cosine) | -49.20 (5) | Coast | 0.39 | 0.23 | 0.66 | 27.12 | 5,150 | 3,049 | 8,700 |
| Ocean | 0.17 | 0.08 | 0.36 | 39.50 | 10,513 | 4,962 | 22,274 | |||
| Total | 0.21 | 0.11 | 0.38 | 31.04 | 15,663 | 8,621 | 28,458 | |||
| Stratified | Uniform (Cosine) | -98.12 (5) | Coast | 0.23 | 0.11 | 0.50 | 39.97 | 3,092 | 1,449 | 6,598 |
| Ocean | 0.10 | 0.06 | 0.16 | 26.84 | 6,006 | 3,573 | 10,097 | |||
| Total | 0.12 | 0.08 | 0.19 | 23.87 | 9,098 | 5,729 | 14,448 | |||
Within the oceanic stratum, density and abundance estimates were highest during seasonal mixed periods (D = 0.17 dolphins·km-2, N = 10,513 dolphins) and interannual neutral periods (D = 0.15 dolphins·km-2, N = 9,592 dolphins) (Table 1) and lowest during seasonal startified periods (D = 0.10 dolphins·km-2, N = 6,006 dolphins) and interannual cold periods (D = 0.01 dolphins·km-2, N = 714 dolphins). The same pattern was observed for the coastal stratum, with the highest density and abundance estimates during mixed seasonal periods (D = 0.39 dolphins·km-2, N = 5,150 dolphins) and interannual neutral periods (D = 0.38 dolphins·km-2, N = 5,048 dolphins) and the lowest during stratified periods (D = 0.23 dolphins·km-2, N = 3,092 dolphins) and cold periods (D = 0.15 dolphins·km-2, N = 1,979 dolphins) (Table 1). Overall, the coastal stratum showed higher density estimates during all seasonal and interannual periods (Table 1). The oceanic stratum showed higher abundance estimates during both seasonal periods and interannual neutral and warm periods, while estimated abundance was higher during cold periods in the coastal stratum (Table 1).
DISCUSSION
Spatial distribution and abundance
The results of this research showed predominant coastal distribution of spotted dolphins in the MCP, which could be associated with the presence of the coastal subspecies, S. a. graffmani, as its boundary distribution covers up to 200 km offshore (Dizon et al. 1994). Most field observations of dolphin characteristics during the study coincided with those of the coastal subspecies, like heavy spotting and large body size (Perrin et al. 1985). However, the offshore subspecies (Stenella attenuata attenuata) has also been documented in coastal areas (Perrin 1975, Dizon et al. 1994). In general, the absence of clear differences in distribution and habitat between the subspecies hinders generalizations on ecological aspects; therefore, continued studies on the subspecies are encouraged.
Regardless of the established subspecies, the high sighting rate and density of spotted dolphins observed in the coastal stratum of the MCP (Table 1, Fig. 3) is consistent with the coastal distribution reported in previous studies (Juárez-Ruiz 2014, Kono-Martínez et al. 2017). Such a distribution aggregating towards coastal areas could be a result of the abrupt topography of the MCP, since the narrow and irregular continental margin favors deep (De la Lanza-Espino 1991) and productive waters close to shore (Juárez-Ruiz 2014, Kono-Martínez et al. 2017), where foraging activities are likely since there is no competition with other coastal cetaceans (i.e., Tursiops truncatus; García and Dawson 2003). Furthermore, studies on spotted dolphins carried out in Central and South America suggested prey availability as the main reason for their distribution and abundance patterns (Acevedo and Burkhart 1998, Cubero-Prado 1998, May-Collado 2001, García and Dawson 2003).
Our results suggest that the spotted dolphin in the MCP region is relatively abundant compared to other tropical areas. For example, our sighting rate (0.024 sightings·km-1) and density estimates (0.04-0.40 dolphins·km-2) are above those reported for the Gulf of Mexico, where the spotted dolphin is reportedly the most abundant (0.011 sightings·km-1 and 0.09 ind·km-2; Ballance and Pitman 1998, Baumgartner et al. 2001, Dolar et al. 2006). Moreover, the MCP is part of the Eastern Tropical Pacific, where marine productivity is high and attributively the reason the spotted dolphin is one of the most abundant cetacean species there, with a total sighting rate of 0.006 sightings·km-1 and density estimates of 0.04 ind·km-2 (Fiedler et al. 1991, Ballance and Pitman 1998, Ballance et al. 2006, Dolar et al. 2006). Specifically, Au and Perryman (1985) indicated that in the Eastern Tropical Pacific, the spotted dolphin tends to be more abundant from central/southern Mexico to Costa Rica, with decreased abundance towards the equatorial line. The range preference has been linked to favorable oceanographic characteristics like the acute and shallow thermocline, surface temperatures above 25 °C, and surface salinities below 34 (Au and Perryman 1985, Ballance et al. 2006). These characteristics, in the MCP, are reinforced by the influence of the Cabo Corrientes Dome (Gómez-Valdivia et al. 2015) and the seasonal variability in SST and coastal upwellings (Ambriz-Arreola et al. 2012, 2018), which probably contribute to the enhanced presence of the spotted dolphin in the coastal area of the MCP.
Time-scale variability in distribution and abundance
Seasonal patterns
The mean spotted dolphin sighting rate was significantly higher in the stratified periods (warmer and rainy conditions) than in the mixed periods in both survey platforms (Fig. 3). This coincides with the pattern found in coastal waters of Panama, where the higher spotted dolphin sighting rate during the rainy season was associated with offshore movements and a scattered distribution that favored the availability of pelagic prey (García and Dawson 2003). Additionally, Pardo et al. (2013) indicated that odontocetes in the Gulf of California could be taking advantage of the coastal spawning season of pelagic fish species, which happens during periods of high SST, and this phenomenon is likely occurring in the MCP. In the Gulf of California the distribution and abundance patterns of bottlenose dolphins resemble those described here for spotted dolphins, with increased abundances being associated with warm and less productive periods and dolphin movements to deeper waters (Flores-Ramírez et al. 1996, Salvadeo et al. 2009). These results were hypothesized to reflect the entry of the oceanic bottlenose dolphin ecotype to the study area (Flores-Ramírez et al. 1996). Something similar could be happening in the MCP with the oceanic subspecies of spotted dolphins.
Density and abundance estimates were higher during the mixed periods in comparison with the stratified periods (Table 1). The differences between sighting rates (distribution) and density/abundance patterns found in this study could be due to the difference in data used to analyze each ecological parameter. Considering that density/abundance estimates were calculated using only data obtained during active observations in the LB surveys, fewer sightings (202) were used in these calculations than in the sighting rate analyses (746). Additionally, the differences between these parameters could be indicative of larger groups in fewer sightings during the mixed periods, and vice versa; this may be related to the incursion of the subspecies, since spatial differences in group size between both subspecies have been reported (Perrin et al. 1985). Specifically, the data used to calculate density and abundance estimates showed an average group size of 19 ± 28 individuals during the mixed periods and 13 ± 16 individuals during the stratified periods. Spotted dolphin group sizes are determined by various factors, including social interactions, predator defense, and prey type and availability, with larger groups forming to hunt smaller and more abundant prey and single individuals or smaller groups hunting larger and more dispersed prey (May-Collado and Morales-Ramírez 2005). The coastal upwelling noted during the mixed periods (Fig. 2) would support the formation of larger groups to take advantage of smaller, more-abundant prey (like jacks) within the coastal stratum; on the other hand, during the stratified periods larger, more-dispersed pelagic prey (like squids) could be driving smaller group formations. Moreover, several studies have indicated an increase in spotted dolphin abundance, as well as reporting an increase in feeding activities during the dry season, which was associated with dolphin movements from oceanic waters to coastal waters as a result of coastal upwelling favoring an increase in potential prey (Cubero-Prado 1998, May-Collado 2001, May-Collado and Morales-Ramírez 2005).
Interannual scale patterns
Spotted dolphin sighting rate, density, and abundance were high during the neutral-warm periods, with increments in the oceanic stratum (Fig. 3, Table 1). Spotted dolphins seemed to prefer warm conditions, as the majority of sightings occurred in waters ≥25 °C (Fig. 2) and SST values showed a significant positive correlation with sighting rates; this coincides with the established habitat preferences of spotted dolphins, including warm waters (above 25 °C) with sharp thermoclines (Au and Perryman 1985, Ballance et al. 2006). Furthermore, sightings during the warm periods were associated with low Chla concentrations and upwelling rates (Figs. 2, 4). Such environmental conditions could lead to changes in the patterns of distribution and abundance of spotted dolphins, which could be in search of available preferential prey. The higher sighting rate during warm anomalies could be a direct effect of The Blob leading to a powerful El Niño starting in early 2014 (Tseng et al. 2017). Interannual movements of spotted dolphins outside their nominal distribution range have been reported as a probable expansion of their “coastal-tropical” habitat during warm El Niño events (Anganuzzi and Buckland 1989, Reilly 1990, Fiedler and Reilly 1994).Ecological ENSO-related research on other odontocete species described similar results; for example, common dolphins (Delphinus spp.) in Monterey Bay, USA, showed an increase in density during an El Niño event, which suggests that the prey base may have changed to include species that were not otherwise available (Benson et al. 2002). On the other hand, the effects of The Blob on cetacean ecology have not been fully investigated, but an increase in coastal abundance of yellowfin tuna (Thunnus albacares) was found to occur during The Blob period (2013-2015) (Cavole et al. 2016). Furthermore, Torres-Orozco et al. (2006) reported that high yellowfin tuna catches correlated with positive SST anomalies during El Niño 1991 and El Niño 1997 events at the entrance to the Gulf of California; these authors also reported that low catches correlated with negative SST anomalies. Therefore, considering that the tuna-spotted dolphin association in the Eastern Tropical Pacific is linked to similar environmental preferences (Scott et al. 2012), a similar pattern could be inferred for spotted dolphins in the study area. Thus, the high abundance of spotted dolphins, which were distributed farther from the coast in deeper waters within the oceanic strata during warm conditions, could be related to the probable expansion of their preferential habitat toward zones with favorable conditions for their ecological activities, such as feeding (Anganuzzi and Buckland 1989, Fiedler and Reilly 1994).
The lowest sighting rate, density, and abundance for both platforms occurred during the cold periods (Table 1, Fig. 3). The drop in density and abundance along with the changes in distribution pattern could be an indication of dolphins migrating outside the study areas looking for other regions with optimal conditions (Cubero-Pardo 2007). Similar results were reported for resident bottlenose dolphins (Tursiops aduncus) in western Australia, where the decrease in abundance was associated with negative SST anomalies, which could have led to the temporal displacement from the study area of dolphins in search of their preferred prey (Sprogis et al. 2018). During the cold periods the spotted dolphins that remained in the MCP showed a narrow coastal aggregation. This aggregating pattern was associated with areas where low SST values and high Chla concentrations were dominant. Chla is considered an indicator of primary productivity and phytoplankton abundance (Pelayo-Martínez et al. 2017). Zooplankton could serve as food for spotted dolphin potential prey, a hypothesis supported by the fact that other top predators, such as the dolphinfish (Coryphaena hippurus), showed abundance patterns that were similar to those of zooplankton (May-Collado 2001). In the MCP, a study of zooplankton biomass (dominated by copepods) variability during the ENSO phases of 2010 found that the highest biomass was associated with neutral conditions and the lowest with La Niña (Pelayo-Martínez et al. 2017), which is coincident with the spotted dolphin density and abundance reported here. Although no direct relationship was found, primary production modulates the distribution and abundance of zooplankton, and the availability of spotted dolphin potential prey, as has been reported for other cetaceans, including the spotted dolphin in Costa Rica (May-Collado 2001, Davis et al. 2002, Fiedler 2002, Ballance et al. 2006).
Anomalies such as ENSO have been predicted to be more frequent and intense in the coming years (IPCC 2014). Ecological studies (i.e., trophic niche) on cetacean species are therefore urgently needed to increase knowledge and to contribute to future conservation strategies.

