


 texto en
  Inglés (pdf)
 Artículo en XML
 Referencias del artículo
 Enviar artículo por email
 Citado por SciELO
  Similares en
SciELO
Similares en
SciELO 
 Permalink
INTRODUCTION
The Pacific hake, Merluccius productus (Ayres, 1855), is distributed along the coasts of Canada and the United States of America and along the coast of Mexico down to the Gulf of Tehuantepec, even in the Gulf of California (Lloris et al. 2005). It is a demersal species whose habitat extends from the continental shelf down to 1,000 m depth (FAO 1995). Considering its population structure, more than 3 stocks have been identified throughout its distribution range: the first, called the coastal stock, is distributed from southern California to Queen Charlotte Strait, Canada; the second is found in the south-central portion of Puget Sound, United States of America; and the third is located in the Strait of Georgia, Canada (Iwamoto et al. 2004). In the California Current hake show migratory movements, to the north for feeding and to the south for reproduction (Bailey et al. 1982). These movements are associated with anomalies in subsurface temperature, the intensity of the northbound subsurface current, and changes in the distribution of their prey during warm and cold years (Smith et al. 1990, Dorn 1995).
Swartzman (1997) used generalized additive models to analyze the relationship between hake schools and bottom temperature along the coast of the United States of America and observed a latitudinal spatial pattern, where aggregations in northern latitudes were located at greater depths and far from the coast. Similarly, Benson et al. (2002) explored the relationship between ocean conditions and mature hake biomass in Canadian waters using linear regressions and found an inverse relationship between biomass and upwelling anomalies, which explained 77% of the variance of such biomasses. Using a geostatistical regression model, Agostini et al. (2006, 2008) found a significant relationship between hake migratory movements and the subsurface current and depth.
In the Gulf of California there are 4 water masses with circulation patterns that are related to the local wind system and tidal currents, which generate constant upwelling and high productivity (Torres-Orozco 1993, Alvarez-Borrego 2007). Consequently, the Gulf of California is the most important fishing region in Mexico (Lluch-Cota et al. 2007), and numerous investigations and explorations have been carried out in it over decades. As a result, in the beginning of the 1970s, the presence of hake was documented in the gulf, with preferential habitat north of Tiburón Island, Sonora, and maximum peak abundances in the winter and spring months (Mathews et al. 1974, Padilla-García 1981, Grande-Vidal 1983, Nevárez-Martínez et al. 2007). Hake distribution in the gulf is associated with the largest catches of the resource (INAPESCA 2020) and the reproductive maximum, which indicates that fishing activities are done on reproductive aggregations (Denton-Castillo 2018).
In general, biological knowledge on the Pacific hake inhabiting the Gulf of California is scarce considering that this resource has the potential for fishing development (DOF 2018) and that climatic and oceanic conditions affect its distribution and abundance patterns during its ontogeny (Hammel et al. 2015). This is the first study that relates the spatiotemporal patterns of distribution and abundance of M. productus with environmental variables in the Gulf of California.
MATERIALS AND METHODS
Data collection
Biological material was collected in the central and northern regions of the Gulf of California during exploratory fishing research cruises (Fig. 1), which were carried out in February and April-May 2014, December 2015, October-November 2016, April 2018, and February 2019. In total, 142 fishing sets and 127 CTD sets were made; the CTD sets were made at the end of the fishing set. Cruises were carried out aboard the National Institute of Fisheries and Aquaculture (Mexico) FRV XI, which was equipped with a demersal trawl net (33.8-m headrope, 6-inch mesh size in the body and 3.5-inch mesh size in the codend, metal otter boards) that was cast from the stern. The sampling plan included the survey along the coast from 27.5° N to 31.5° N and between 110.0° W and 114.5° W (Fig. 1), which included the coasts of Sonora and the Baja California Peninsula, down to the 500-m isobath. Trawling was done at an mean speed of 3 knots.
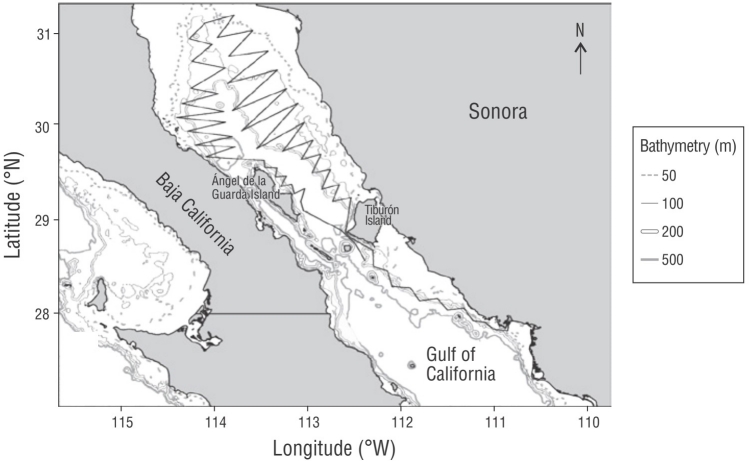
Figure 1 Track of the cruises (thick solid line) carried out from 2014 to 2019 to sample Pacific hake in the Gulf of California.
The total catch in each set was placed on the deck of the boat and it was weighed after separating the organisms into taxonomic groups (mollusks, crustaceans, bony fish, and cartilaginous fish). Pacific hake specimen identification was corroborated using the diagnostic characters described by Robertson and Allen (2002). Each sample consisted of 100 individuals that were measured (total length, TL; ±1 cm) with an ichthyometer and weighed (body mass or total weight, henceforth TW for the purpose of the study; ±1 g) with a Torrey scale. Each organism was eviscerated from the ventral part to macroscopically identify the sex.
Size structure and weight
Pacific hake size structure was analyzed by sex after grouping TL into 2-cm intervals and TW into 200-g intervals. Normality was evaluated with a Shapiro-Wilks test, and size differences between sexes were evaluated with the Kolmogorov-Smirnov test.
Biomass estimates
Biomass was calculated using 2 methodologies. The first used the swept area method (Pierce and Guerra 1994, Hernández-Herrera et al. 1998, Nevárez-Martínez et al. 2000, Rivera-Parra 2001). Biomass (kg) was estimated with the following formula:
with variance
where Y
i
is the total catch in the i-th stratum,
A
i
is the total area in the i-th stratum,
a
i
is the area swept in the i-th stratum,
In order to increase precision in biomass estimation, the stratified random method was applied as a second option (Schaeffer 1987, Nevárez-Martínez et al. 2000) using a bathymetric criterion. The number of strata was defined using Sturges’ rule (1926):
and interval size (IS) was estimated as follows:
where n is the number of stations, pmax is maximum depth by station, and pmin is minimum depth by station.
Spatial distribution
The initial geographic location (start) was recorded for each fishing set. This information was used to determine the spatial distribution and mean size distribution of Pacific hake. Graphic representations were made with the QGIS 3.6.1 software.
Selection of environmental variables
To analyze the abundance and size distribution patterns for Pacific hake in the Gulf of California in relation to the environment, the Swartzman (1997) criterion was considered for variable selection. The coordinates of the initial geographic position of each fishing set (latitude, longitude) were considered spatial variables. Bottom temperature, salinity, and depth, obtained from the CTD sets at the end of the fishing sets, were considered environmental variables. In addition, month and year were used as time variables (Table 1).
Table 1 Explanatory variables that were explored for predicting hake abundance in the Gulf of California.
| Variable | Unit | Description |
| Latitude, longitude | Degrees and decimal degrees | Geographic position at the start of a fishing set. |
| Month | Days | Month in which the survey took place; abundance seasonality assessment. |
| Year | Months | Year in which the survey took place. |
| Bottom temperature | Degrees Celsius | Bottom temperature obtained from each CTD set. |
| Salinity | Bottom salinity obtained from each CTD set. | |
| Depth | Meters | Bottom depth obtained from each CTD set. |
Model elaboration
To evaluate the environmental characteristics of Pacific hake occurrence areas in the Gulf of California, generalized additive models (GAMs) were built. This methodology has the advantage of modeling nonlinear relationships between response variables and predictor variables by using covariate smoothing functions (s) (Kainge et al. 2017). The following is the general equation of a GAM:
where g is the monotonic link function; μ i , the fitted value; X i , the predictor variable; and f j , a smoothing function with Gaussian distribution, an identity type link, and a thin plate basis, which has shown good performance when not very large databases are used (Zuur et al. 2009). First, the catch (kg) in each fishing set was used as response variable, for which the natural logarithm was used to stabilize the mean/variance ratio, and as a first approach, the environmental variables (bottom temperature and salinity), spatial variables (latitude, longitude, and depth), and time variables (month and year) were used as predictor variables. A second GAM was then created, where the response variable was mean size in each fishing set and the predictor variables were the same variables used in the previous approach.
Selection of the best model
GAMs were constructed using a stepwise approach, that is, adding one variable at a time to evaluate the degree of contribution of each covariate. For this, the likelihood ratio test and the Akaike information criterion (AIC) were used. Variables that resulted in a significant contribution (P < 0.05) and caused an AIC decrease of more than 2 units were retained in the final model (Burnham and Anderson 2002). The spatial and temporal distribution of the model residuals were explored visually with an autocorrelation function. Because using variables that are highly correlated with each other can generate errors in the modeling process, a concurvity test was performed in each step of the model construction process. Concurvity can be interpreted as a nonlinear extension of multicollinearity (Wood 2006). The entire modeling process was done using the functions in the mgcv package (Wood 2006) of the R environment (R Core-Team 2018).
RESULTS
Size structure and weight
Of the 142 stations, 126 were positive for Pacific hake presence (88.7%) and 16 were negative (11.3%). In total, 2,795 organisms were captured, 1,254 of which were males (44.4%), 1,396 females (49.9%), and 145 indeterminate (5.2%). The recorded length interval ranged from a minimum size of 12.0 cm TL, for a male captured during the October-November 2016 cruise, to a maximum size of 105.0 cm TL, for a female captured in the February 2019 survey, with a mean size of 42.0 cm TL. In females, size fluctuated between 16.0 and 105.0 cm TL, with a mean size of 44.6 cm TL; the minimum length prevailed in February 2014, December 2015, and October-November 2016, and the maximum size in February 2019. In males, lengths ranged from 12.0 to 79.0 cm TL, with a mean size of 34.8 cm TL; the minimum length was found in December 2015, and the maximum in February 2014. Significant differences were observed only in the February and December cruises (Kolmogorov-Smirnov: P < 0.05). Total weight ranged from 9.8 to 7,500.0 g; the lightest weight corresponded to a male captured in December 2015, and the heaviest to a female captured in February 2014. Total weight in females ranged from 21.0 to 7,500.0 g; in males, from 9.8 to 4,200.0 g. The heaviest females and males were observed during the month of February in 2014 and 2019, respectively (Table 2). In general, males reached smaller lengths and weights compared to females.
Table 2 Numerical summary of weight (body mass or total weight; TW) and size (total length; TL) of hake individuals caught during scientific cruises from 2014 to 2019. Min., minimum; Max., maximum.
| February 2014 | April-May 2014 | December 2015 | ||||||||||
| Males | Females | Males | Females | Males | Females | |||||||
| TL (cm) | TW (g) | TL (cm) | TW (g) | TL (cm) | TW (g) | TL (cm) | TW (g) | TL (cm) | TW (g) | TL (cm) | TW (g) | |
| Min. | 16.1 | 24.0 | 16.0 | 23.0 | 16.4 | 25.0 | 16.5 | 25.0 | 12.5 | 9.8 | 16.0 | 21.1 |
| Mean | 45.0 | 841.9 | 50.9 | 1,379.3 | 39.8 | 501.8 | 49.9 | 789.4 | 22.2 | 81.2 | 42.0 | 996.8 |
| Max. | 85.5 | 4,200.0 | 99.5 | 7,500.0 | 73.0 | 1,920.0 | 93.2 | 5,100.0 | 68.1 | 1,878.5 | 96.0 | 5,446.3 |
| October-November 2016 | April 2018 | February 2019 | ||||||||||
| Males | Females | Males | Females | Males | Females | |||||||
| TL (cm) | TW (g) | TL (cm) | TW (g) | TL (cm) | TW (g) | TL (cm) | TW (g) | TL (cm) | TW (g) | TL (cm) | TW (g) | |
| Min. | 17.1 | 25.8 | 16.0 | 21.2 | 23.0 | 75.0 | 23.1 | 75.0 | 17.8 | 29.3 | 18.3 | 32.0 |
| Mean | 26.1 | 106.3 | 30.4 | 173.8 | 32.6 | 253.3 | 41.7 | 516.6 | 43.1 | 614.3 | 52.5 | 1,219.0 |
| Max. | 41.4 | 402.1 | 48.4 | 653.4 | 47.0 | 750.0 | 59.1 | 1,400.0 | 75.5 | 2,586.4 | 105.0 | 7,190.4 |
Biomass estimates
According to biomass estimates obtained with the swept area method, the lowest biomass corresponded to the October 2016 cruise (6,887.40 ± 127.30 t), and the highest to the February 2019 cruise (64,823.80 ± 1,287.00 t). The lowest coefficient of variation (CV) was obtained in the April 2014 cruise (CV = 2.5), and the highest in the February 2014 cruise (CV = 7.2). Using the stratified method, the highest biomasses occurred between 200 and 300 m depth, except for the October-November 2016 cruise, when the highest biomass occurred at depths between 350 and 400 m (Table 3). The December 2015 and April 2018 cruises were not taken into account because the surveyed area was less than 50%.
Table 3 Biomass estimates by cruise and standard error (SE) for hake in the Gulf of California. CV, coefficient of variation.
| Year | Cruise | Estimated biomass (t) | SE | Stratification (t) | SE | CV |
| 2014 | February | 47,642.60 | 1,448.00 | 48,131.11 | 1,080.60 | 7.20 |
| 2014 | April-May | 41,431.99 | 1,393.00 | 40,019.65 | 139.05 | 2.50 |
| 2016 | October | 6,887.40 | 127.30 | 6,917.80 | 50.60 | 3.10 |
| 2019 | February | 64,823.80 | 1,287.00 | 68,260.37 | 547.38 | 3.65 |
Spatial distribution
The stations with the lowest catches were those close to the coast of Sonora, where the predominant mean sizes of Pacific hake ranged from 25.0 to 50.0 cm TL (Fig. 2). The stations with the highest catches were located near the coast of the Baja California Peninsula, to the north of Ángel de la Guarda Island, and to the north of Tiburón Island (Fig. 2), where the organisms with the smallest (<25.0 cm TL) and largest (>50.0 cm TL) mean sizes were found (Fig. 3).
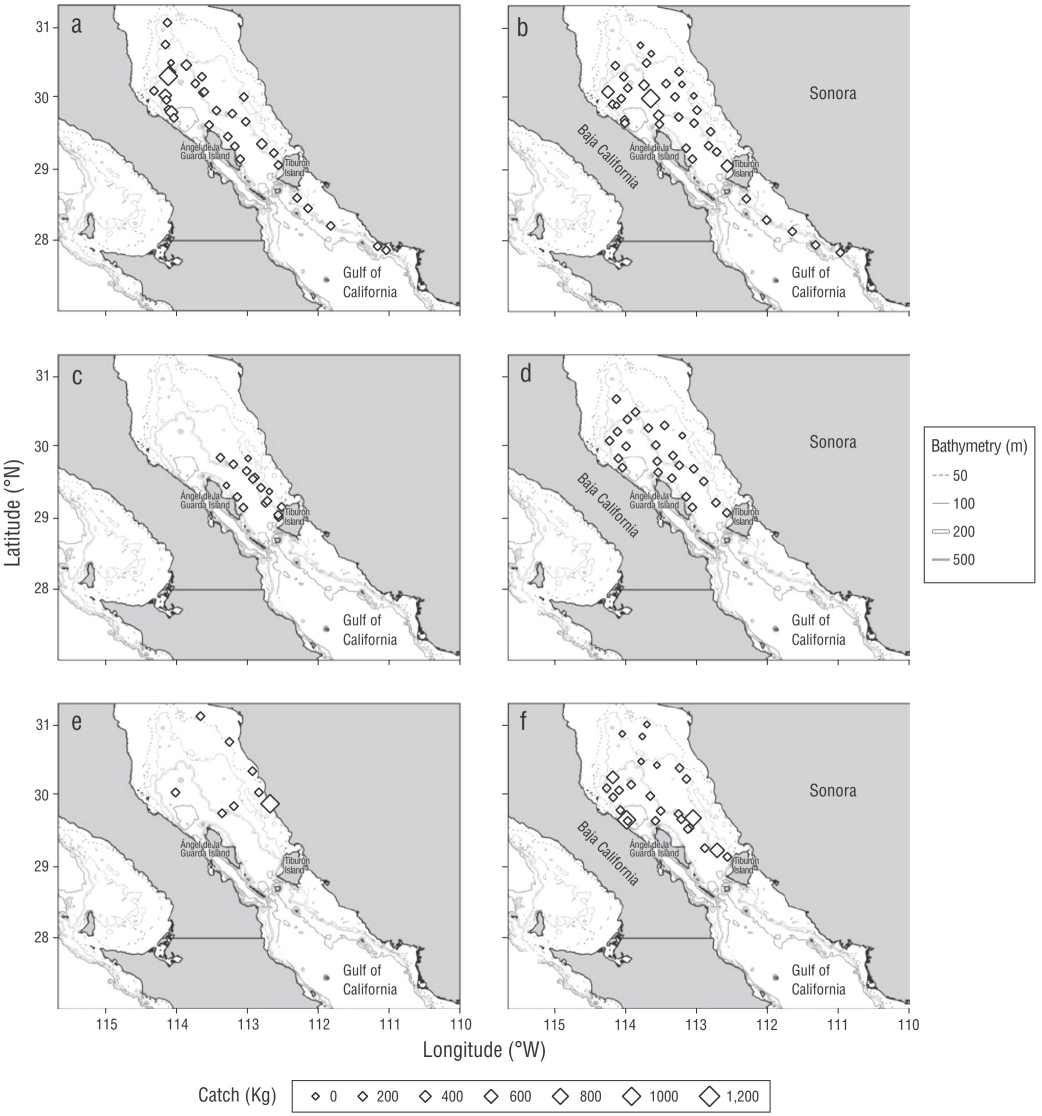
Figure 2 Catch distribution during research cruises carried out in February 2014 (a), April-May 2014 (b), December 2015 (c), October 2016 (d), April 2018 (e), and February 2019 (f).

Statistical modeling
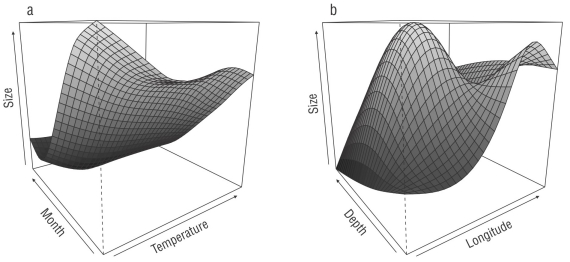
The covariates used in the GAM showed concurvity values of less than 0.3, that is, little collinearity between the variables used. Visual exploration of the spatial distribution of model residuals did not show a clear pattern (Fig. S1). Regarding the temporal analysis, the autocorrelation function showed that there was no correlation with time; that is, data were independent of each other (Fig. S2). Bottom temperature (13-14 °C optimal range) was the most important environmental variable for the abundance of this resource, since it described 20.6% of total variability, followed by the time variable (month = February), which described 15.1%, and the spatial variable (longitude = 13-14° W), which described 11.5%. The GAM described 38.8% of total variability (Fig. 4, Table 4). Regarding the effect of environmental conditions on the size distribution of Pacific hake in the Gulf of California, no single covariate described this relationship significantly, but the interaction of bottom temperature and month explained 51.1% of the variation and the interaction of length and depth explained 21.5% of the variation (Fig. 5, Table 4).
Table 4 Generalized additive models for Pacific hake in the Gulf of California. AIC, Akaike information criterion.
| Abundance model without interaction | Explained deviance (%) | AIC | P |
| +s(Temperature) | 20.60 | 402.20 | <0.01 |
| +s(Salinity) | 2.98 | 416.80 | 0.08 |
| +s(Latitude) | 9.57 | 413.20 | 0.06 |
| +s(Longitude) | 11.50 | 408.20 | <0.01 |
| +s(Depth) | 7.39 | 414.60 | 0.10 |
| +s(Month) | 18.80 | 404.00 | <0.01 |
| +s(Year) | 0.21 | 419.69 | 0.64 |
| Abundance model with interactions | Explained deviance (%) | AIC | P |
| +s(Temperature) | 20.60 | 402.20 | <0.01 |
| +s(Month) | 18.80 | 403.00 | <0.01 |
| +s(Longitude) | 11.50 | 408.20 | <0.01 |
| +te(Longitude, month) | 32.50 | 387.90 | <0.01 |
| Total | 39.30 | ||
| Size model without interactions | Explained deviance (%) | AIC | P |
| +s(Temperature) | 0.11 | 869.21 | 0.73 |
| +s(Salinity) | 4.63 | 864.26 | 0.02 |
| +s(Latitude) | 3.39 | 865.64 | 0.05 |
| +s(Longitude) | 1.66 | 867.54 | 0.18 |
| +s(Depth) | 3.53 | 865.49 | 0.05 |
| +s(Month) | 34.90 | 823.46 | <0.01 |
| +s(Year) | 0.35 | 868.47 | 0.80 |
| Size model with interactions | Explained deviance (%) | AIC | P |
| +s(Longitude, depth) | 21.50 | 863.80 | <0.01 |
| +te(Temperature, month) | 51.10 | 814.70 | <0.01 |
| Total | 61.70 |
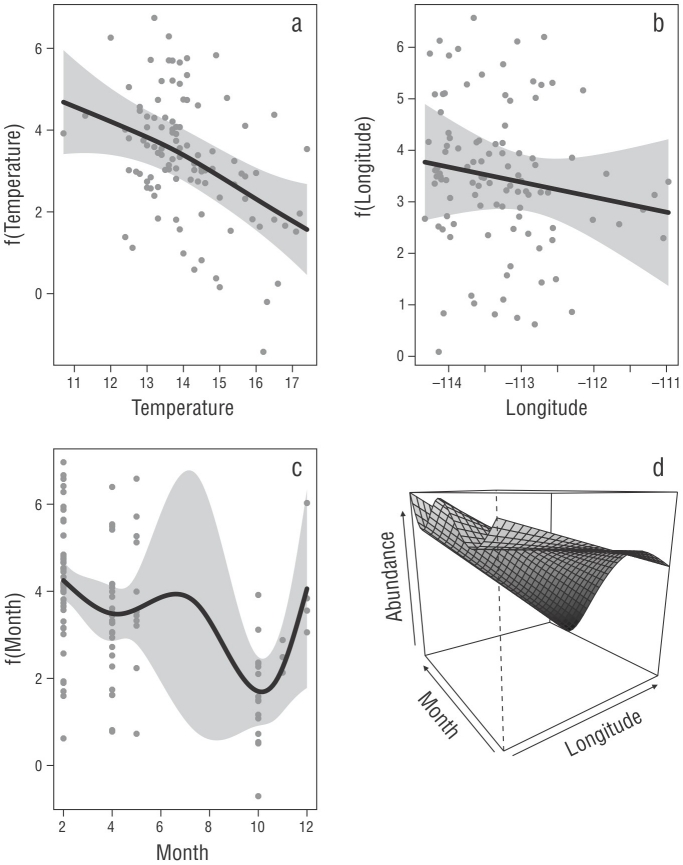
Figure 4 Generalized additive model response plots showing the effect of the significant functions on describing the spatial, environmental, and temporal distributions of hake in the Gulf of California. Temperature (a), longitude (b), month (c), and month/longitude interaction (d). The y-axis represents the effect of the covariate with respect to abundance. The gray area represents the 95% confidence intervals.
DISCUSSION
Size structure and weight
Located in the northwestern Pacific coast of Mexico, the Gulf of California is a highly productive area that sustains 2 of the most important fisheries in Mexico, the Shrimp fishery and the Small Pelagics fishery (Lluch-Cota et al. 2007). However, in recent years, Pacific hake has gained importance because of its catch volumes and its biological characteristics, such as attainable sizes. In the present study, we found organisms with maximum lengths of 105.0 cm TL, which is close to the maximum size of 112.0 cm TL reported by Nevárez-Martínez et al. (2007) for the Gulf of California but different from the maximum size of 27.5 cm standard length (32.5 cm TL) reported by Salinas-Mayoral (2018) for the western coast of the Baja California Peninsula.
For the coasts of the United States of America, Saunders and McFarlane (1997), Dark (1974), and Best (1962) reported maximum mean sizes of 46.3, 61.8, and 80.0 cm TL, respectively. Regarding maximum lengths, when comparing size by sex for each cruise, we found that females predominated at sizes >73.0 cm TL, whereas males reached smaller sizes. Our results suggest that the Pacific hake inhabiting the Gulf of California exhibits sexual dimorphism. This characteristic was reported by Best (1962) for M. productus and for Merluccius hubbsi, with asymptotic sizes of 90.0 cm for females and 60.0 cm for males (Lorenzo and Defeo 2015). In addition, visually, females were more robust (round) compared to males, and those measuring >73.0 cm TL weighed more than males.
Biomass estimates
Pacific hake biomass in the Gulf of California has been estimated from a series of fishery survey cruises since the 1970s and 1980s. Mathews et al. (1974) and Grande-Vidal (1983) reported volumes between 4,000.0 and 28,000.0 t and between 22,000.0 and 35,600.0 t, respectively. These estimates were lower than those obtained in this work, which fluctuated between 6,887.1 and 64,823.8 t, but were similar to those reported by Nevárez-Martínez et al. (2007), except for the estimate for April 2006, which was 145,000.0 t; this last biomass maximum was the result of Nevárez-Martínez et al. (2007) making 20 more fishing sets. Given the above, the Pacific hake population in the Gulf of California has notably been exploited in a sustainable way, and it has been classified as a resource with development potential (DOF 2018, INAPESCA 2020).
Regarding the centers of abundance of Pacific hake in this study, the concentration of organisms was higher at the stations of 3 cruises (Fig. 2a, b, f) where bottom temperature was 13.2 to 14.1 °C and depth was 176-216 m. Mathews et al. (1974) and Nevárez-Martínez et al. (2007) reported the same pattern, with the largest volumes at similar depths (184-366 m and 138-275 m, respectively). In the October 2016 cruise the centers of abundance occurred at stations with a bottom temperature of 12.8 °C and greater depth (350-462 m). Something similar was reported by Nevárez-Martínez et al. (2007), who found that the highest biomass occurred at 413 m depth in November 2006. In this respect, Acevedo-Cervantes et al. (2009) reported the presence of Pacific hake at depths of 360-450 m in September 2004.
During the October-November 2016 cruise, the centers of abundance shifted to depths greater than 300 m. Acevedo-Cervantes et al. (2009) mentioned that in the Gulf of California there are 2 fish communities, the first formed by coastal species and the second by typical deep-water species, with the latter being characterized as not very diverse but very abundant. These authors considered the Pacific hake as part of the second community because they found it at depths greater than 360 m, which is consistent with the vertical distribution of abundances found in the surveys analyzed from the October-November 2016 cruise.
Spatial distribution
The north-central region of the Gulf of California has different topographic and bathymetric characteristics that are suitable for the distribution of Pacific hake. Tiburón Basin is located in the central region, between Ángel de la Guarda Island and Tiburón Island, and Delfín Basin is located to the north of Ángel de la Guarda Island; both basins have nearly flat seafloors and depths of 500 and 900 m, respectively (Arrellano-Peralta and Medrano-González 2013). In addition, the north-central region of the Gulf of California is characterized by high productivity, with enrichment in the water column originating from the intense mixing of water masses due to strong tidal currents (Lluch-Cota and Arias-Aréchiga 2000).
In this study we found that the range of Pacific hake is wide, from 50 to 500 m depth. However, the concentration of organisms was higher in areas with depths between 200 and 300 m and bottom temperatures between 13 and 14 °C (Fig. 4a). These depth and temperature ranges are optimal for locating the centers of abundance of this species in the north-central region of the Gulf of California, and this is consistent with the depth at which the hake fleet operates in the gulf (110-330 m) (EDF 2017). Another variable worth considering is seasonality, as the centers of abundance were recorded at the beginning of the year (Fig. 4c), and this is consistent with peak catch dates for the resource (INAPESCA 2020).
Statistical modeling
GAMs evaluate nonlinear relationships and have the ability to relate data using smoothing functions (Wood 2006). In this sense, Swartzman (1997) used a GAM to evaluate the effect of the environment on the biomass of Pacific hake schools in the north-central region of the Pacific coast of the United States of America; in that study, Swartzman (1997) found that schools were larger and had higher biomasses in the north than in the south and that the maximum biomass occurred at temperature of 7 °C. Our model indicated that bottom temperature (optimal range 13-14 °C), time (February), and longitude (113-114 °W) were, in that order, the most important variables explaining the centers of abundance of Pacific hake in the Gulf of California. Ressler et al. (2007) indicated that temperature determines Pacific hake population dynamics, with 2 possible effects: current advection and active swimming in response to environmental signals. Agostini et al. (2006) reported that abundance distribution of adult Pacific hake in the California Current is more closely related to the subsurface current flow than to temperature range.
Some studies have associated the environment with biological aspects of resources. For example, Kainge et al. (2017) associated the environment (temperature, oxygen, depth, and geographic position) with the size structure of Merluccius capensis and Merluccius paradoxus in Namibia, Africa, and found that small-sized organisms inhabited shallow areas, unlike large individuals. In this sense, the present study showed that large specimens of Pacific hake in the Gulf of California showed affinity for low temperatures (13.2-14.0 °C).
In general, in the Gulf of California, M. productus exhibits sexual dimorphism, and females reach greater sizes (105.0 cm TL) and weights (7,500.0 g) than males. The highest abundances were recorded during the February cruises (47,642.0 and 64,823.8 t) and the center of abundance was located near the coast of the Baja California Peninsula, at depths between 200 and 300 m and temperatures between 13.2 and 14.0 °C. Since the most significant environmental variable that affected hake distribution was bottom temperature, it is important to continue monitoring this resource to detect changes in its distribution associated with changes in the environment. This study is the first to report on the relationship between distribution and abundance and the habitat of Pacific hake in the Gulf of California.

