


 texto en
  Inglés (pdf)
 Artículo en XML
 Referencias del artículo
 Enviar artículo por email
 Citado por SciELO
  Similares en
SciELO
Similares en
SciELO 
 Permalink
INTRODUCTION
The Campeche Bank region located off the state of Campeche is economically and ecologically important due to its high richness in natural resources (Manzano-Sarabia and Salinas-Zavala 2008). Martínez-López and Parés-Sierra (1998) described an east-west current off the coast of northern Yucatán, which branches off to the south, off Campeche. The currents derived from the bifurcation carry upwelled waters from the Yucatan Current; however, the limit of the effects is the area off the northern portion of the peninsula (Merino 1997). Zavala-Hidalgo et al. (2003, 2006, and 2014) and Morey et al. (2005) described a similar circulation pattern, with southwesterly currents in the Campeche Bank during most of the year and a convergence zone southeast of the bank (between the states of Campeche and Tabasco); this generates a seasonal supply of nutrients and, therefore, chlorophyll in the northwest, which is enhanced by the presence of a semipermanent cyclonic eddy. Meteorological events (e.g., cold fronts, tropical storms, precipitation, hurricanes), depending on their periodicity and intensity, also have an effect on the region because of the changes they cause in environmental characteristics (Walker et al. 2005, Shropshire et al. 2016). Phytoplankton biomass (chlorophyll a [Chla]) and primary productivity (PP) show maximum values from September to December and minimum values from February to June (Manzano-Sarabia and Salinas-Zavala 2008, Salmerón-García et al. 2011).
The use of remote sensing data (e.g., satellite-derived chlorophyll [Chlsat]) is a common technique to describe phytoplankton variability at large temporal and spatial scales because of the advantages it provides (Kirk 1994, Gaxiola-Castro et al. 2010). Even with this technique, few studies have been done on variations in Chlsat and PP at large scales in the study region, so the objective of this work was to characterize the spatiotemporal variability in phytoplankton Chla and PP off the state of Campeche and relate it to the physical processes that control these variables at large spatial and temporal scales. The analyses were performed with sea surface temperature (SST), sea surface height (SSH), Chlsat, and PP data that were obtained from monthly composites generated by satellite sensors from July 2002 to December 2018. The SST and SSH are indicative variables of physical processes that affect phytoplankton; for example, low SST and SSH values can indicate divergent flows that carry water vertically to the surface, such as upwelling or cyclonic eddies, causing fertilization of the euphotic zone (Mann and Lazier 2013). Conversely, high SST and SSH values indicate convergent flows with relatively poor euphotic zones, such as the center of anticyclonic eddies.
MATERIALS AND METHODS
The study area is located in the southeast Gulf of Mexico and covers the portion of the Campeche Bank off the area between the Calkiní and Palizada municipalities (Fig. 1). This area is characterized by a continental shelf ~250 km wide, with a gentle slope that reaches maximum depths of ~200 m in the outer part. The area has a warm subhumid to a warm humid climate, and the annual average environmental temperature varies between 26 and 27 °C, with maximum values of >30 °C and a minimum of 18 °C. Total precipitation varies between 1,200 and 2,000 mm per year in the southern and central parts and is ~800 mm per year in the northern region (Mendoza-Vega and Ku-Quej 2010). Three seasons are described for this zone: dry (March-May), rainy (June-October), and cold fronts or “nortes” (November-February). Tropical storms and hurricanes are common in July-October, and the intensification of winds and marine currents in this season interrupts the supply of sediment from underground freshwater blooms, rivers, and mangroves located along the coast (Morales-Ojeda 2010). The region is characterized as a karstic zone because of its composition of mostly calcium carbonate rocks that form water tables, underground rivers, and underwater outcrops along the coast (Álvarez-Góngora and Herrera-Silveira 2006, Valle-Levinson 2011).
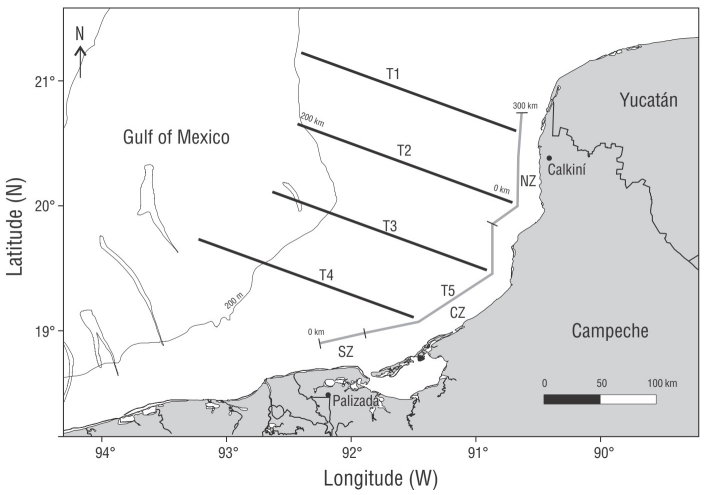
Figure 1 Study area and location of the transects (T) in the Bank of Campeche, off the state of Campeche. NZ: northern zone; CZ, central zone; SZ, southern zone.
We used spatiotemporal data series from monthly composites of SST, SSH, Chlsat, and PP from July 2002 to December 2018. The composites of SST and Chlsat were downloaded from the “Ocean Color” website (https://oceancolor.gsfc.nasa.gov/, accessed in 2019) of the National Aeronautics and Space Administration (NASA), with a spatial resolution of 9 × 9 km2 and a processing level of 3. The SST data were 11-µm wavelength diurnal radiance measurements. We downloaded PP data from the “Ocean Productivity” website (https://www.science.oregonstate.edu/ocean.productivity/, accessed in 2019) of Oregon State University; the spatial resolution was 18 × 18 km2. SSH data were obtained from the “MULTIOBS_GLO_PHY_REP_015_002” product that is available on the “COPERNICUS” website (http://marine.copernicus.eu/services-portfolio/access-to-products/, accessed in 2019) of the European Union; the resolution was 27 × 27 km2. We processed the images with the SeaWiFS Data Analysis System program (SeaDAS 7.5.3) that was downloaded from the same NASA website.
To describe the spatiotemporal variation in SST, SSH, Chlsat, and PP, we sampled four 200-km transects perpendicular to the coast (T1 to T4) and one 300-km transect parallel to the coast (T5) (Fig. 1). Hovmöller diagrams were constructed for each variable and each transect. Furthermore, due to the difference in Chlsat and PP values, the transects that were perpendicular to the coast were divided into an inner neritic zone (0-60 km) and an outer neritic zone (60-200 km). The transect parallel to the coast was divided into 3 zones: north (NZ, 200-300 km), center (CZ, 40-200 km), and south (SZ, 0-40 km). We obtained time series (2002-2018) data from the average SST, SSH, Chlsat, and PP values corresponding to each month in each of the zones and in each transect. The distributions of SST, SSH, Chlsat, and PP did not show normality or homoscedasticity. Therefore, for the statistical analysis, Bayesian analyses of variance (ANOVAs) were performed (a priori and a posteriori) to explore differences between areas and seasons in R Studio (v.1.1.463, 2009-2018). The Bayes factors (BFs) were interpreted according Jeffreys (1967).
RESULTS
With respect to the complete transects, the SST showed a seasonal behavior with maximum values (>30 °C) in the rainy season (June to October) and minimum values (<22.5 °C) in the cold front season (November to February) (Fig. 2a). The time series showed, in many cases, the mean SST values for each zone had double maxima in the same year (Fig. 3a, b). The interannual differences in the time series of the T1 to T4 transects were ~1 °C for both neritic zones, whereas the general intra-annual interval for the entire series was up to ~8 °C (from 22.5 to 30.5 °C) (Fig. 3a, b). The SSH had a similar spatial behavior from 0 to 200 km in the entire time series, with maximum (0.400−0.500 ± 0.006 m) (the number after the ± is the standard error) and minimum (<0.200 m) periodic values, which indicated a marked seasonality that was different from that of the SST. The maximum SSH values occurred in shorter periods than those of the SST during the last part of the rainy season and the cold front season; the minimum SSH values occurred during the dry season and lasted longer than the low SST values (Figs. 2a-b, 3a-d). The overall intra-annual variation range of SSH for the T1 to T4 series was ~0.4 m (Fig. 3c-d). The SSH time series showed more variations than those for the SST, with multiple maxima and minima in the same year (Fig. 3). The maximum and minimum values of SSH increased since 2016 (~0.05 m) (Figs. 2b, 3c-d).
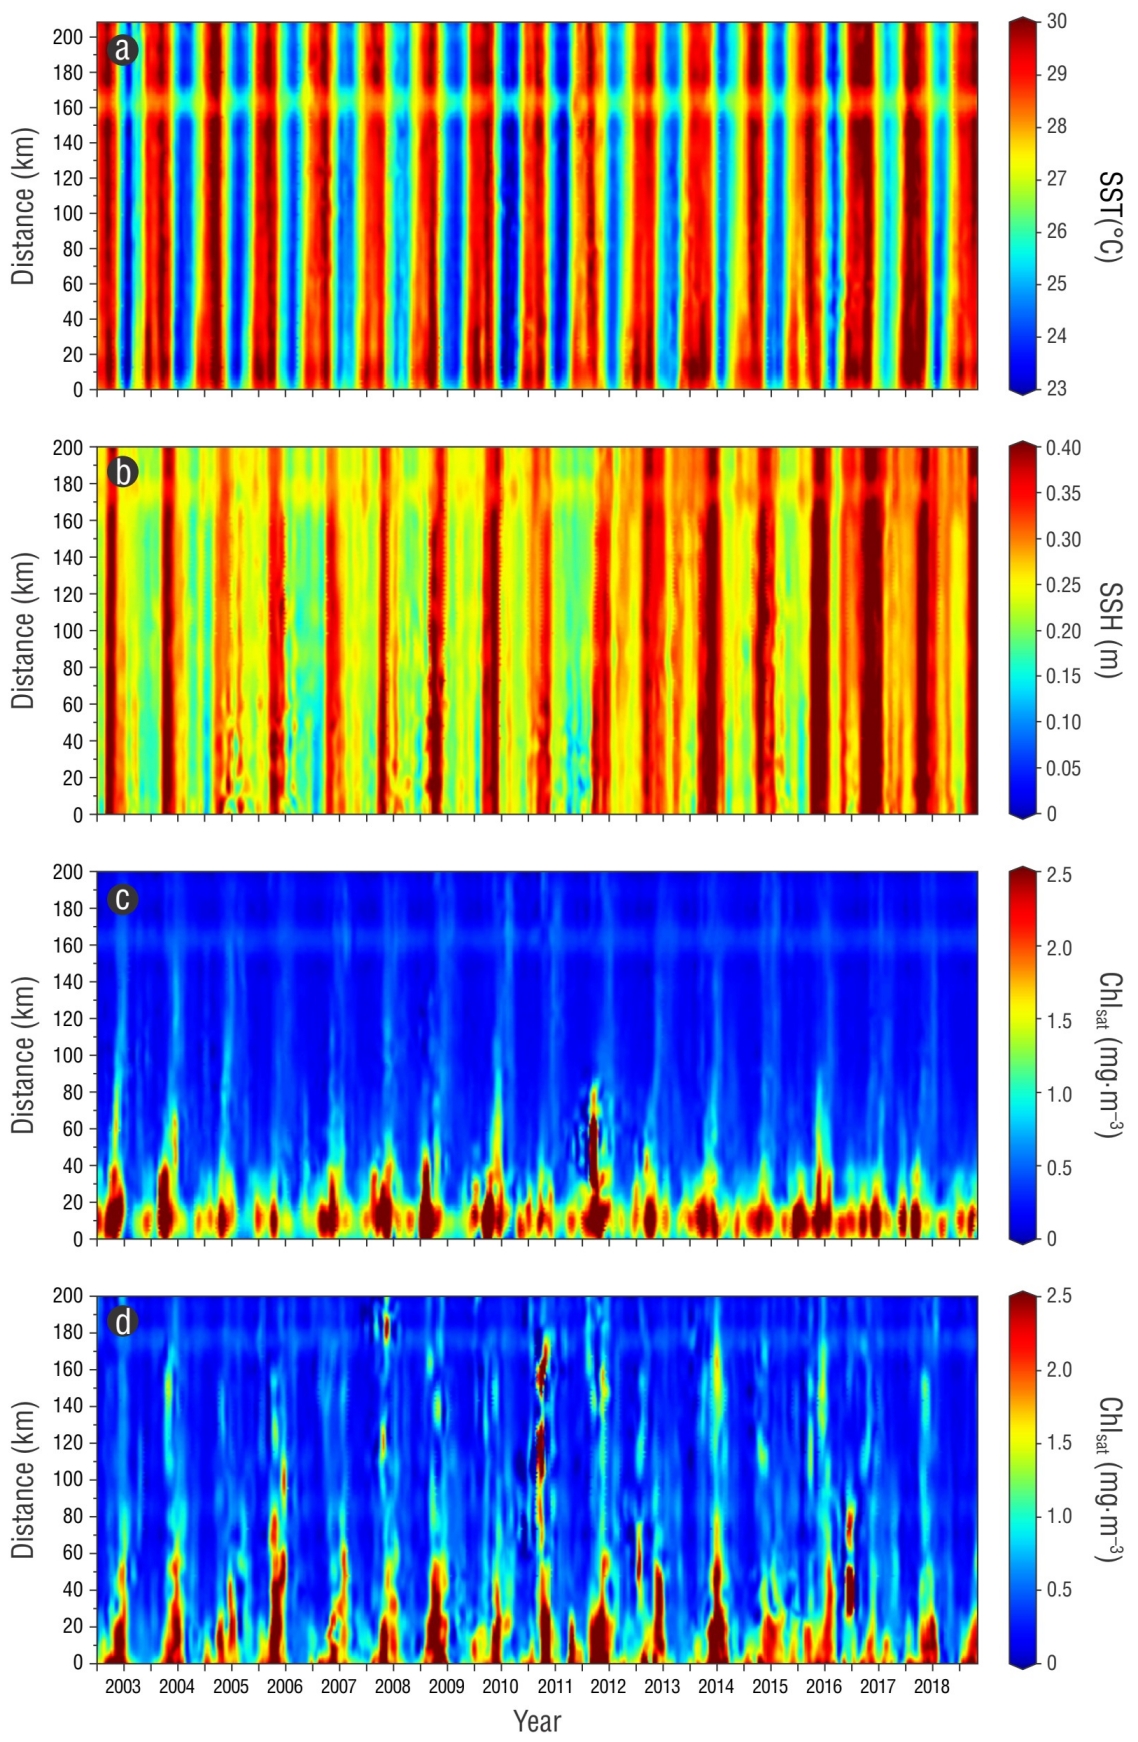
Figure 2 Hovmöller diagrams for sea surface temperature (SST) (a) and sea surface height (SSH) (b) in the T4 transect, and of satellite-derived chlorophyll (Chlsat) concentration in the T1 (c) and T4 (d) transects. The numbers 02, 03, etc., on the horizontal axes represent the years 2002, 2003, etc. The tick above each number indicates the start of each year.
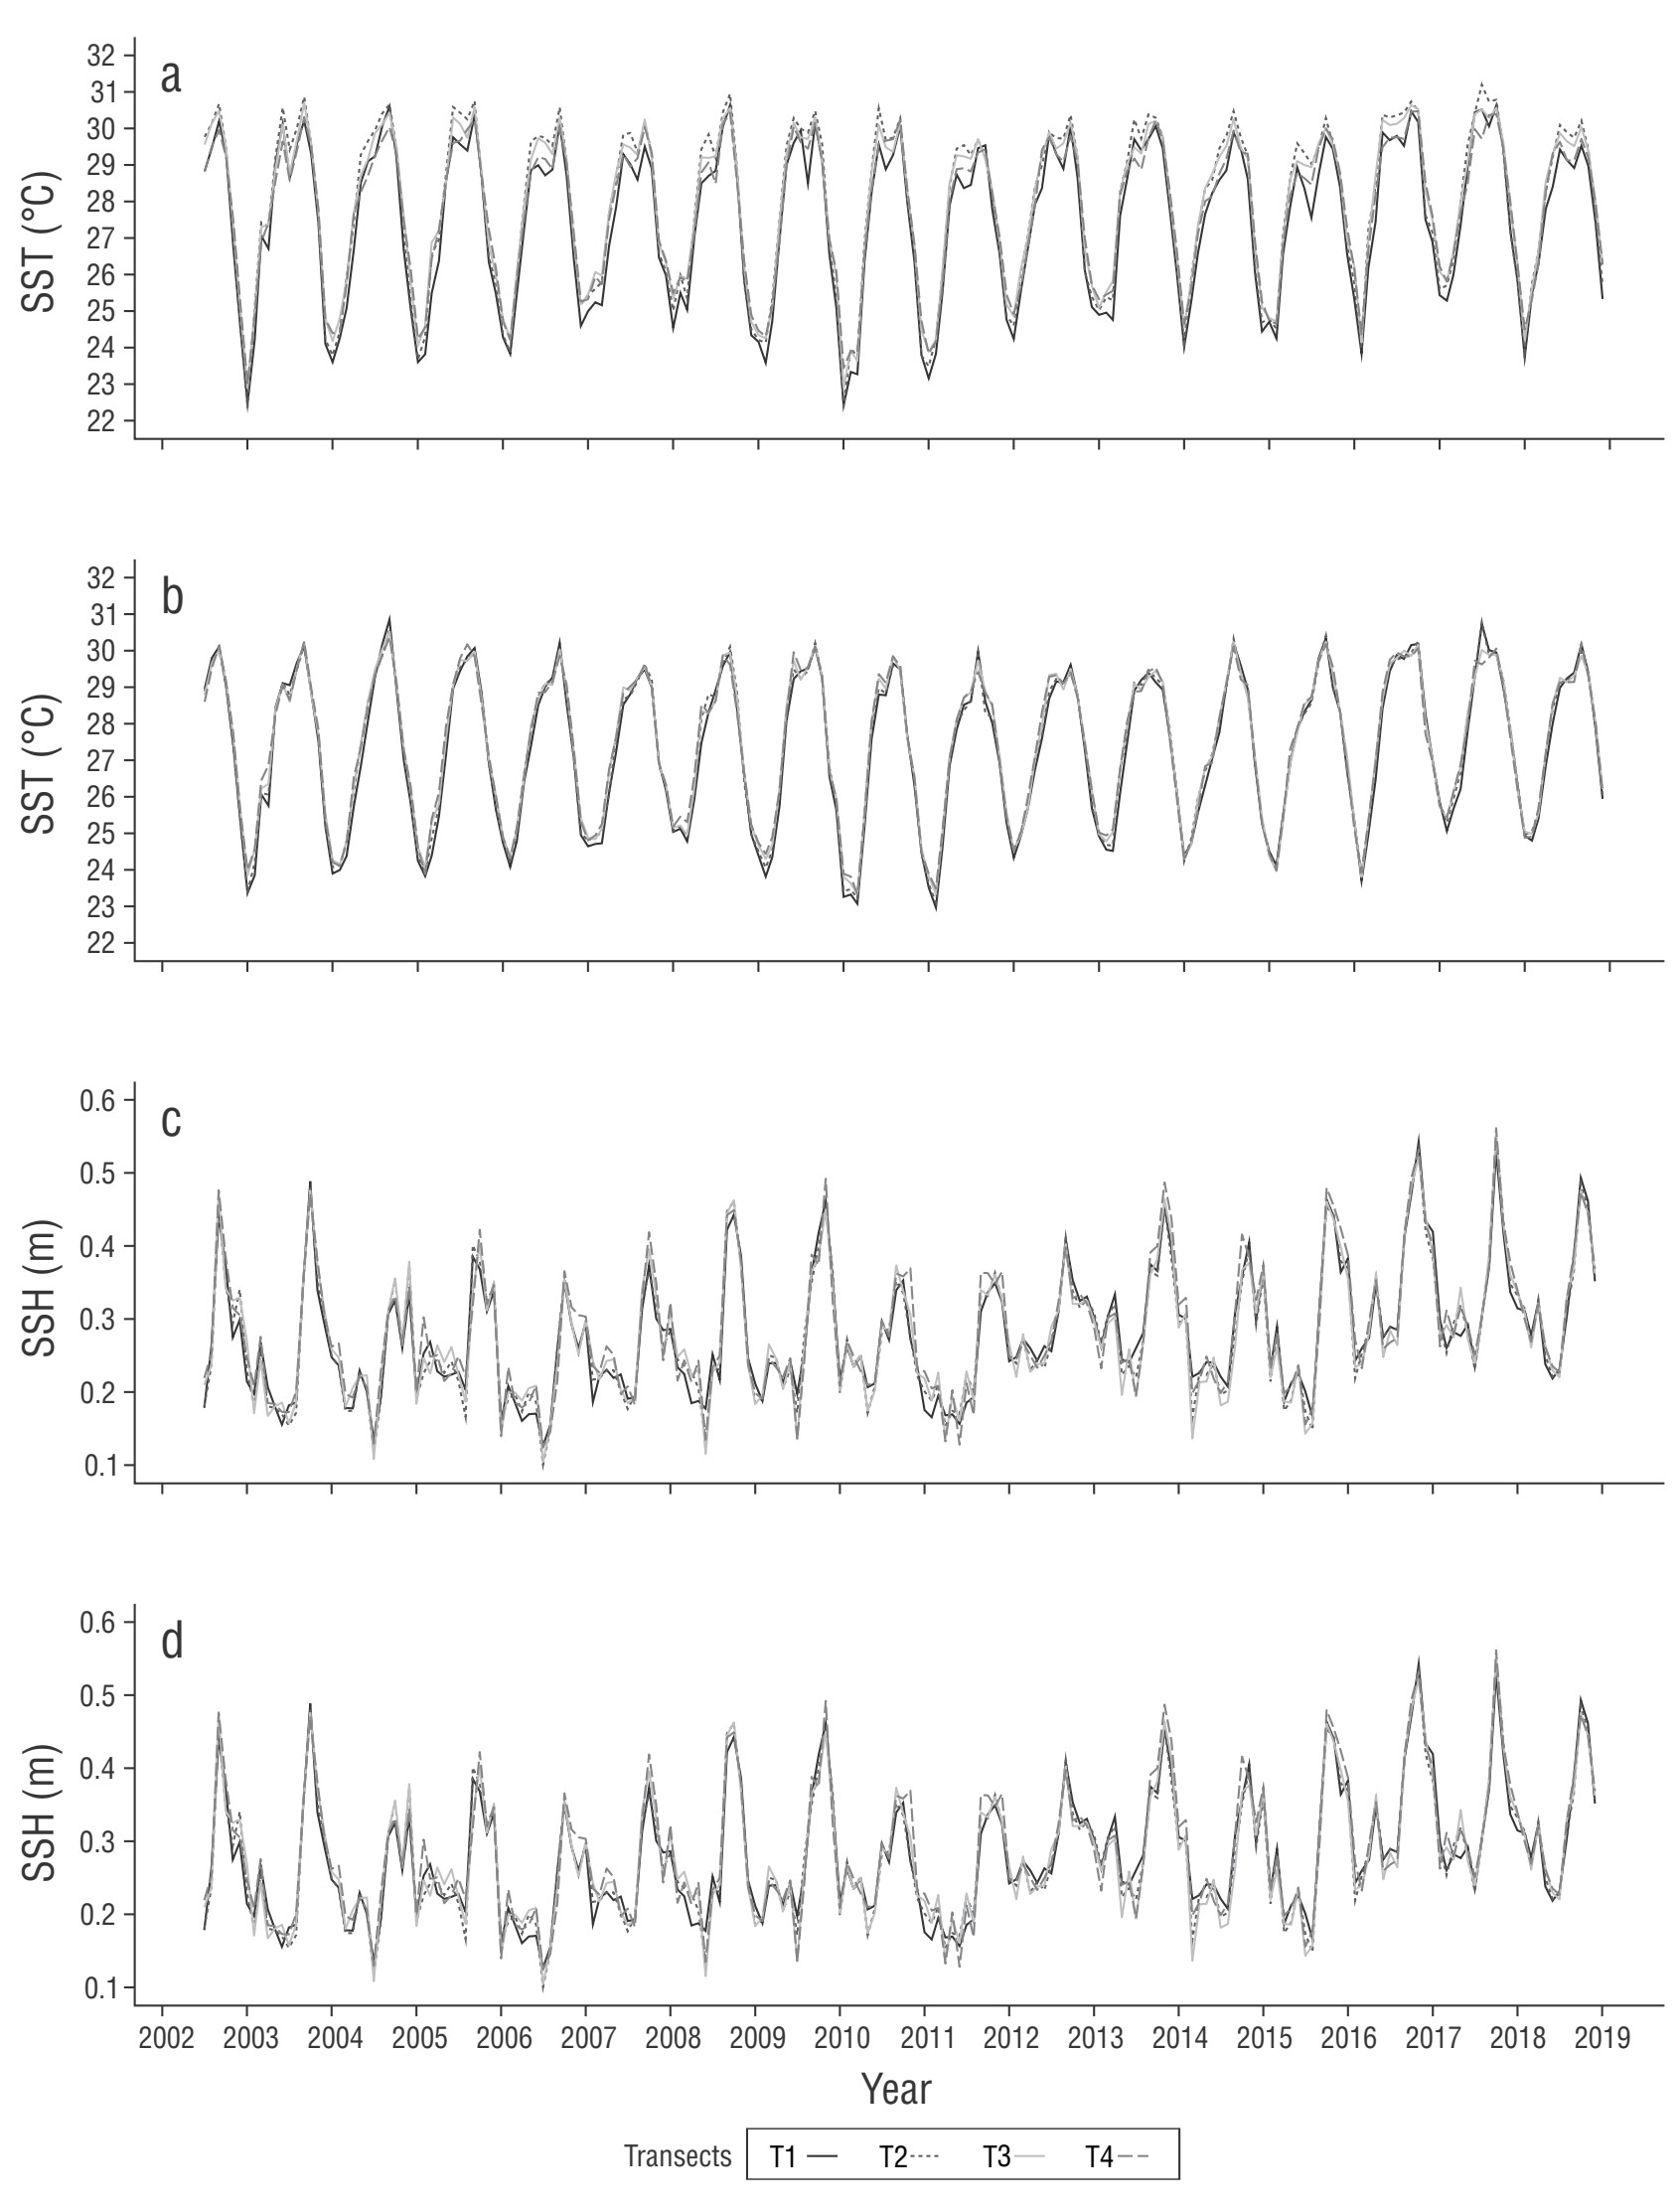
Figure 3 Mean time series for sea surface temperature (SST) and sea surface height (SSH) in the T1-T4 transects (a and c are for the inner neritic zone, and b and d for the outer neritic zone).
At T5, the SST means for the NZ, CZ, and SZ were similar, with a value of 27.9 ± 0.15 °C (Fig. 4a). In general, all the SST series (T1 to T5) had the highest values (>30 °C) in 2016 and 2017 and the lowest values (<22.5 °C) in 2003, 2010, and 2011 (Figs. 3a-b, 4a). The SSH means for the NZ, CZ, and SZ of T5 were similar (0.270 ± 0.006 m). In T5, the maximum annual values (>0.50 m) occurred in 2016 and 2017, and the minimum values (<0.150 m) occurred in 2004 and 2006 (Fig. 4b).

Figure 4 Mean time series for sea surface temperature (SST) (a), sea surface height (SSH) (b), satellite-derived chlorophyll (Chlsat) concentration (c), and primary productivity (PP) (d) in T5. Northern zone, NZ; central zone, CZ; and southern zone, SZ.
The spatial differences for Chlsat and PP were very noticeable in the T1 to T3 transects, with maximum annual values >5 mg·m-3 and >3 g C·m-2·d-1, respectively, in the first 60 km and <1.4 mg·m-3 and <1.4 g C·m-2·d-1, respectively, in areas 60 to 200 km from the coast (Figs. 2c, 5). The PP had a variation that was similar to that of Chlsat. The Hovmöller diagrams showed similar Chlsat and PP behaviors for T1, T2, and T3 (not illustrated for T2 and T3) but clearly different behavior for T4 (Fig. 2c, d). In the inner neritic zone, the mean values of Chlsat and PP in T2 were often higher than those in the other transects, but in the outer neritic zone, the highest mean values occurred in T4 (Fig. 5). In T4, very high values were often observed at very great distances from the coast (in 2007-2008, these high values reached the limit of the study area) (Fig. 2d). The highest Chlsat values in the inner neritic zone occurred during the rainy season (between ~4 and ~8 mg·m-3), and in the outer zone from T1 to T3, the highest Chlsat values occurred during the cold front season (between ~0.6 and ~1.5 mg·m-3). The minimum values of Chlsat occurred during the dry season in the inner zone (<0.5 mg·m-3) and during the rainy season in the outer zone (<0.2 mg·m-3). In general, an interannual variation in Chlsat and PP was observed throughout the transects but was more distinct in the inner neritic zone (Figs. 4c, 5a-b).
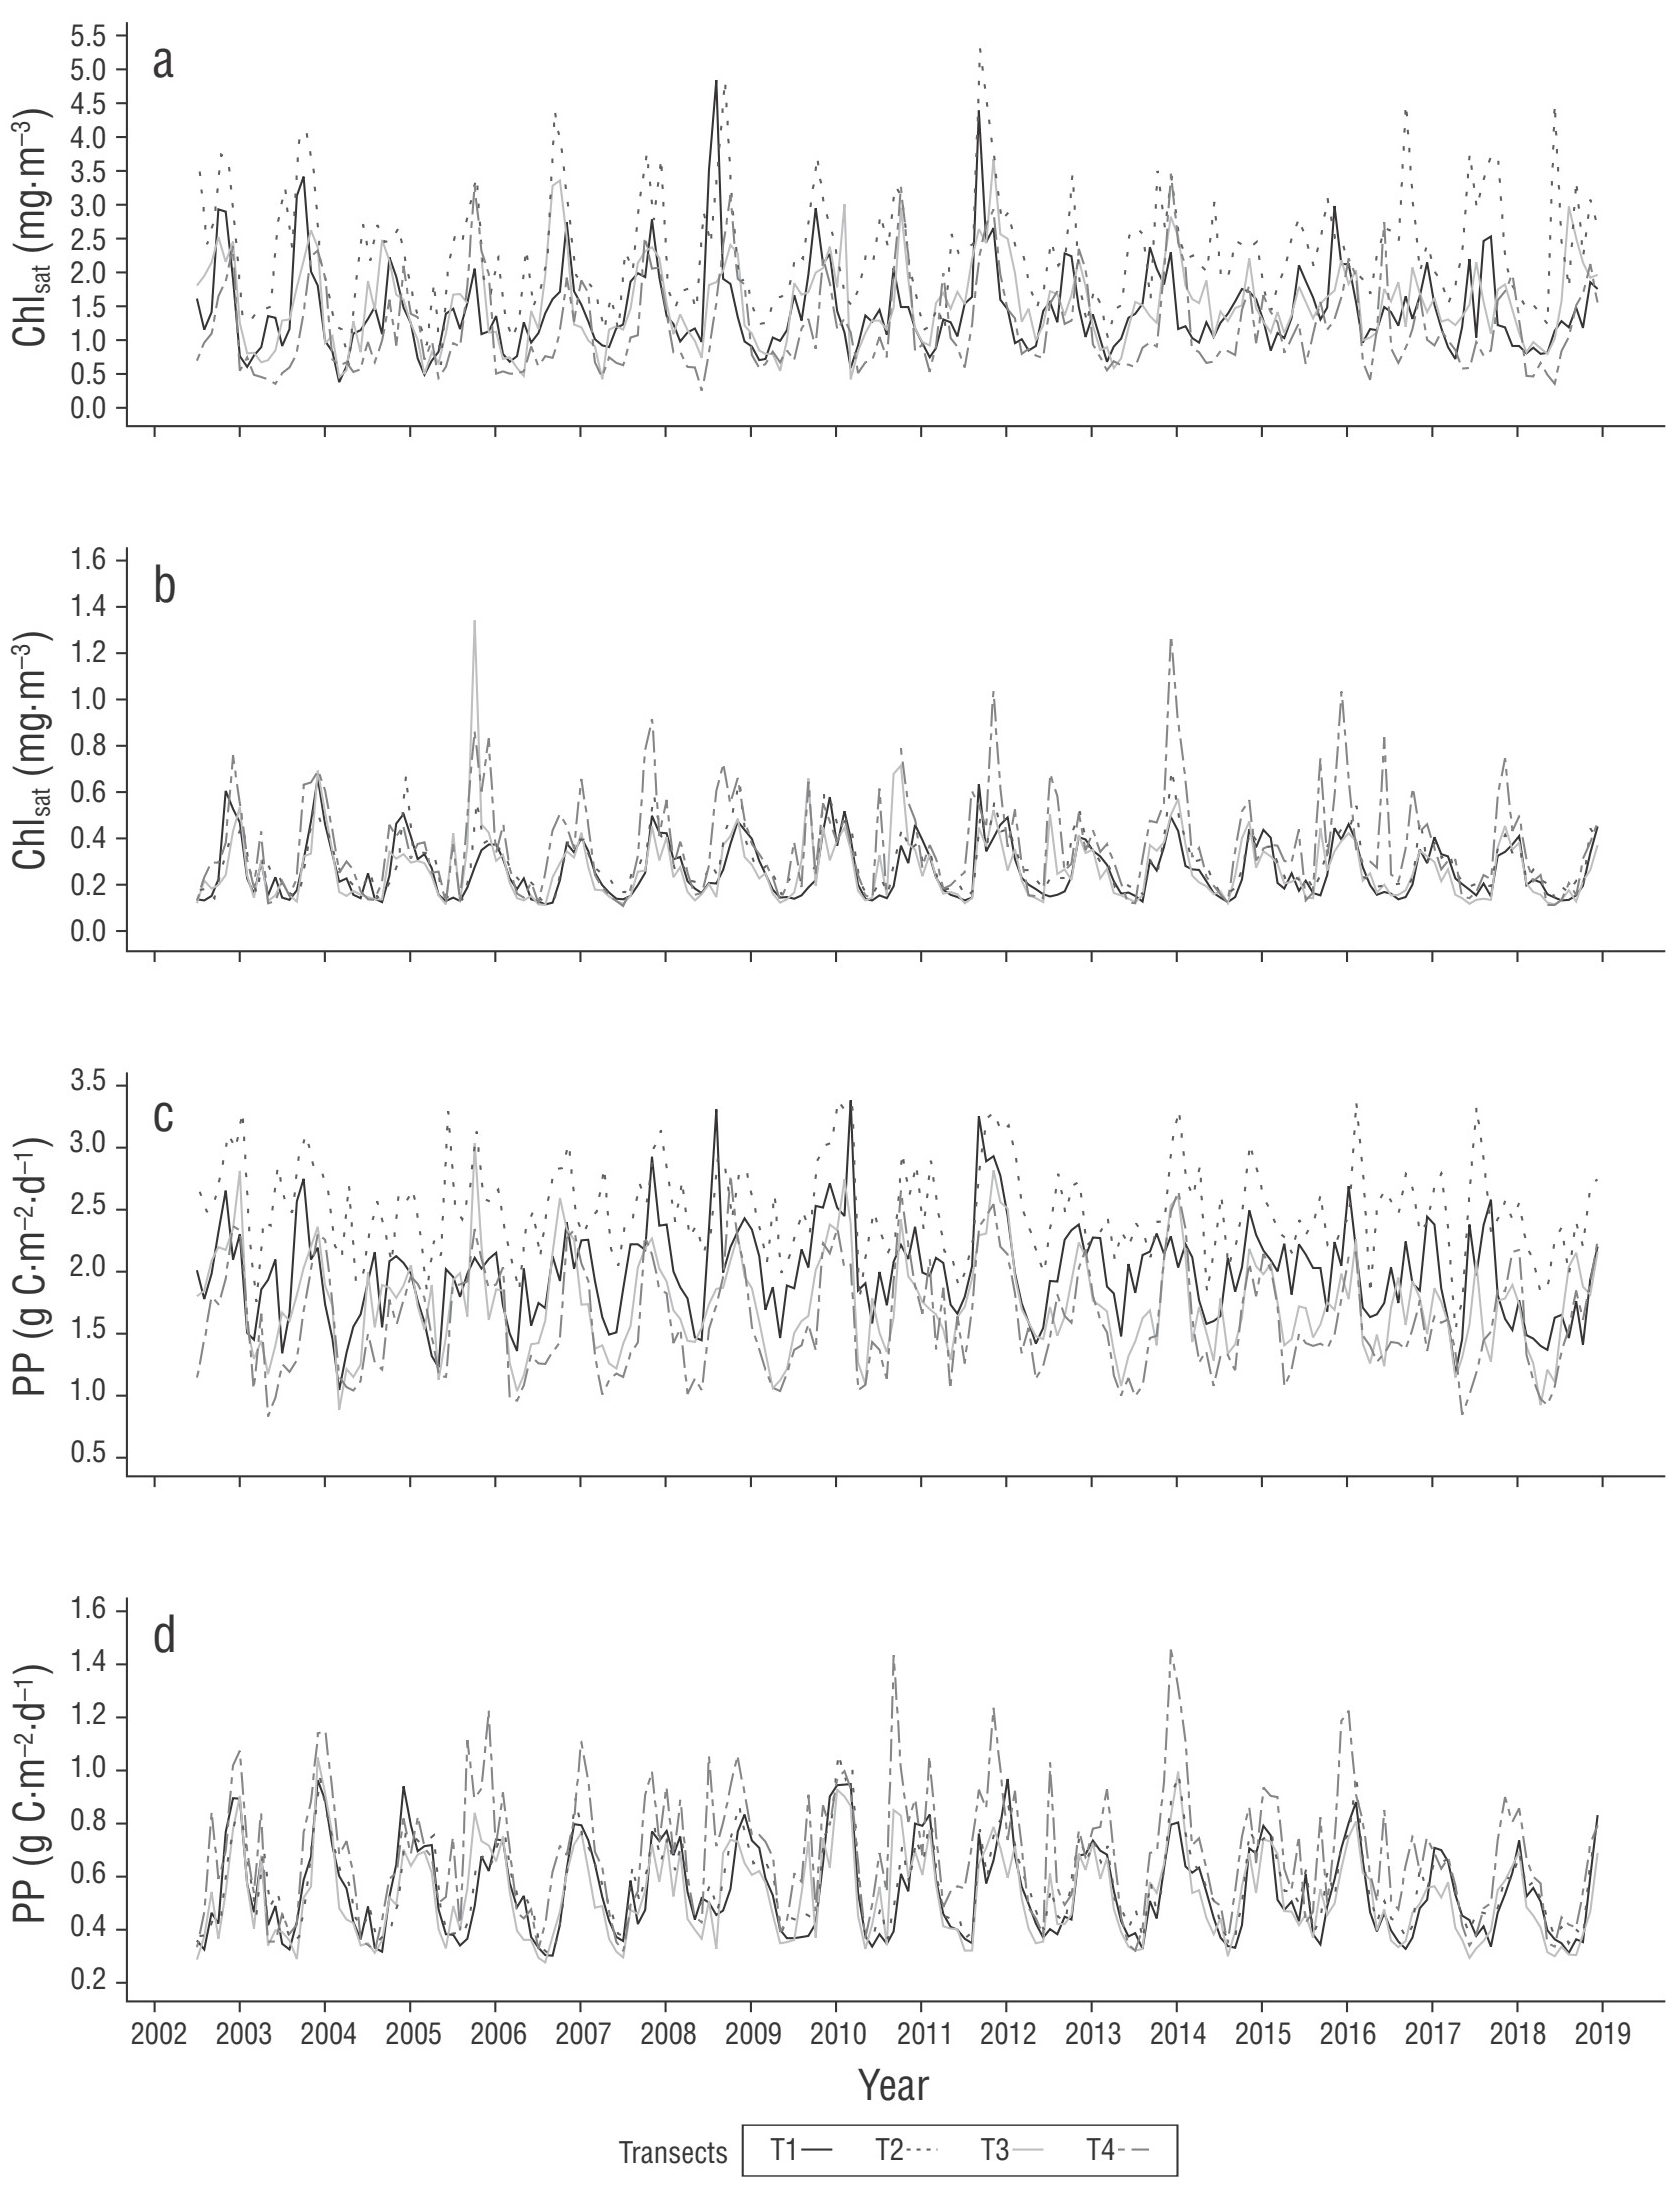
Figure 5 Mean time series for satellite-derived chlorophyll (Chlsat) concentration and primary productivity (PP) in the T1-T4 transects (a and c are for the inner neritic zone, and b and d for the outer neritic zone).
In the case of T5, parallel to the coast, 3 zones were identified according to their Chlsat and PP differences: the north zone (200-300 km), which was clearly distinguished by its annual maximum values of up to ~9 mg·m-3 and >6 g C‧m-2‧d-1, respectively, which were higher than those of the other 2 zones; and the central and south zones, which had similar Chlsat and PP values but lower annual Chlsat minima in the central zone (60-200 km) than in the south zone (0-60 km), with values of up to <1.0 mg·m-3 (Fig. 4c-d). In T5, there was a clear interannual variation, with annual maxima that varied from <4 mg·m-3 to 8−9 mg·m-3 (Fig. 4c); the interannual variation in PP was not as clear as that in Chlsat. In some cases, 2 or more maxima of Chlsat and PP occurred in the same year (Fig. 4c-d).
A priori Bayesian ANOVAs for SST showed spatial differences with substantial evidence (BF = 15) between the inner and outer neritic zones and with null evidence (BF < 3) between the different T5 zones (Fig. 6a). A priori Bayesian ANOVAs of SST showed decisive differences (BF > 100) between seasons (cold fronts, rainy, and dry) for all transects (Fig. 6b). With respect to the SST, the ANOVAs showed no evidence for differences between the inner and outer neritic zones and differences with decisive evidence between seasons for all the transects (Fig. 6c-d).
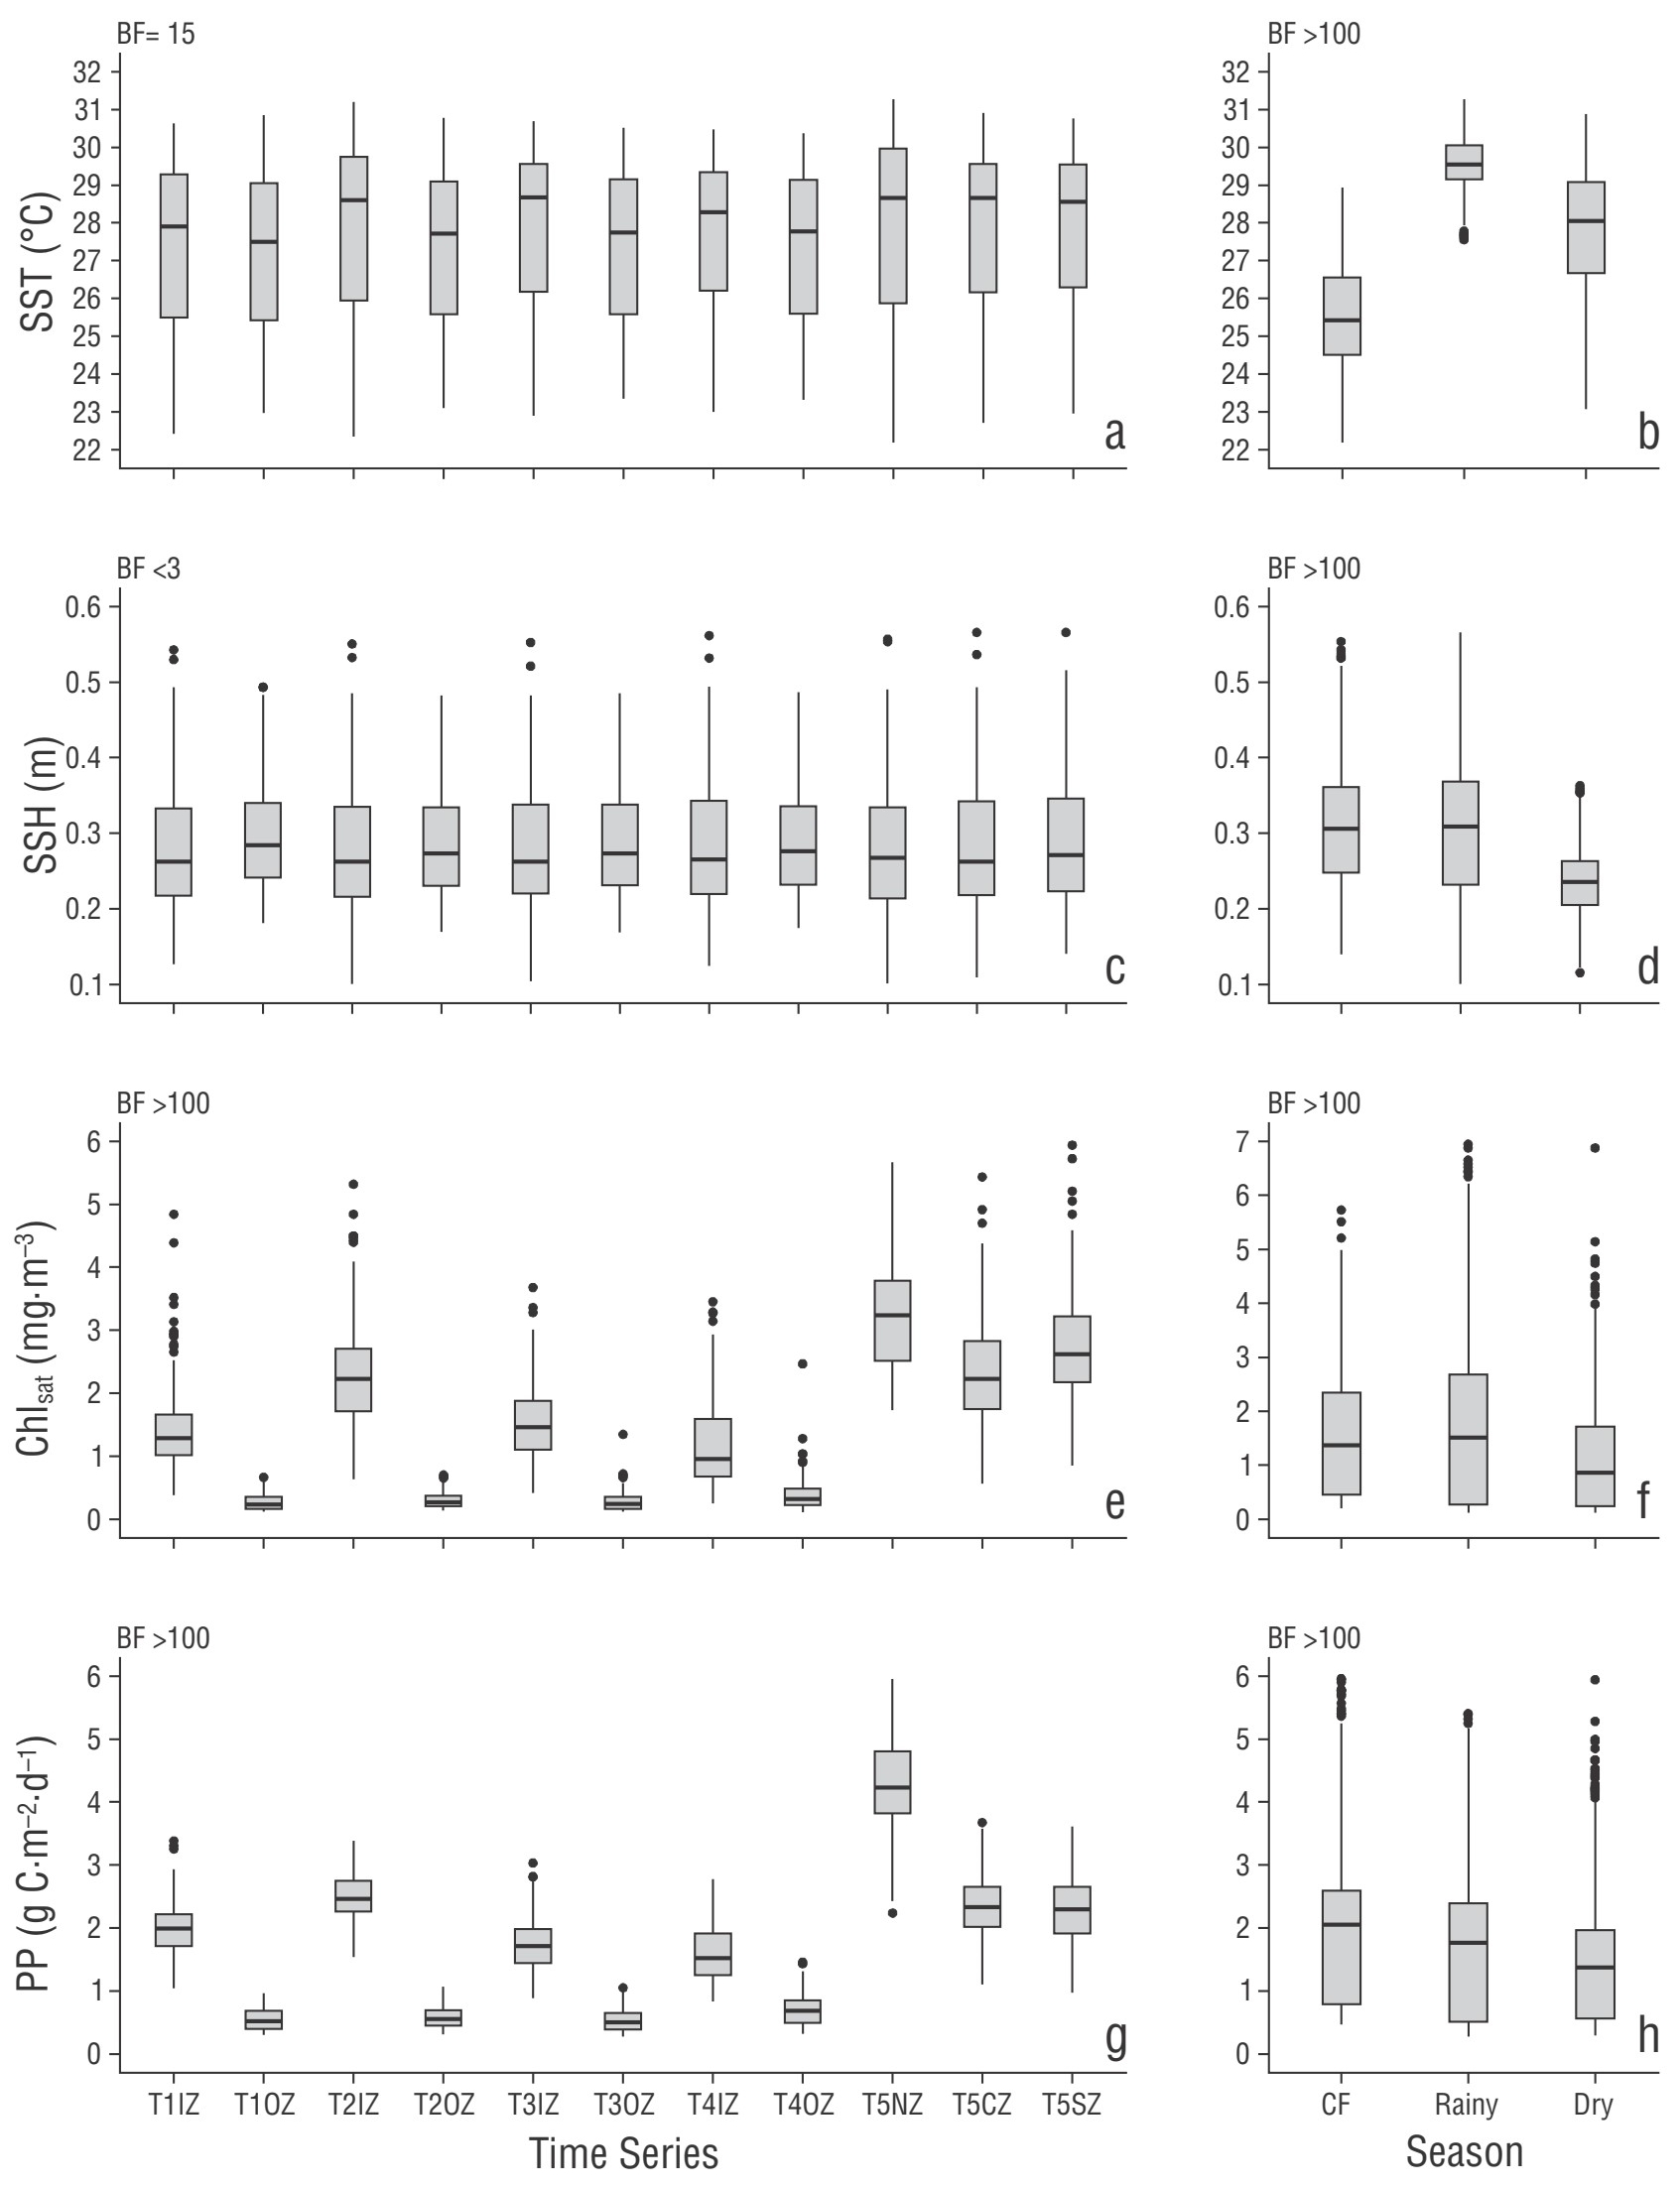
Figure 6 Box plots of the different sets of data as indicated on the horizontal axes. T1IZ is the inner zone of T1, T1OZ is the outer zone of T1, and so on. T5NZ, T5CZ, and T5SZ are the northern zone, the central zone, and the southern zone of T5, respectively. CF is the “cold fronts” season, “Rainy” is the rainy season, and “Dry” is the dry season. BF is the Bayes factor.
In relation to the a priori Bayesian ANOVAs in the Chlsat and PP mean series of the T1 to T4 transects (Fig. 5), differences were found between the inner and outer neritic zones and between seasons, both with decisive evidence (BF > 100) (Fig. 6e-h). A priori Bayesian ANOVAs in the Chlsat and PP mean series of transect T5 found differences between the north, central, and south zones with decisive evidence (Fig. 6e, g).
DISCUSSION
Clear intra-annual, interannual, and spatial variations predominated in the study area for all the analyzed properties. During the dry season, the Chlsat and PP values were minimal due to the high stratification of the water column and low levels of dissolved nutrients (Okolodkov 2003). The maximum values of Chlsat and PP in the rainy season (June-October) were possibly caused by the fact that in the inner neritic zone, the large volume of water produced by precipitation, coupled with the karstic nature of the area, supplied nutrients to the coast through upwelling and runoff (Burnett et al. 2003, Troccoli-Ghinaglia et al. 2004, Mulligan and Charette 2009). The presence of multiple annual Chlsat and PP maxima (Fig. 4c, d) was possibly due to temporal variations in the nutrient supply and variations in the intensity of zooplankton grazing, but there were no data to explore these possibilities.
Oceanographic dynamics, with offshore advection components, cause high Chlsat and PP values to extend tens of kilometers offshore (up to 60 km) throughout the study area (Johannes 1980, Lohrenz et al. 1997, Slomp and Van-Capellen 2004). Okolodkov (2003) described the effect of upwelling that extended beyond the Campeche Bank, which could be a determining factor in the fertilization of the study area. However, the results presented here indicated a biological impact that generally reached only up to 60 km from the coast (Fig. 2c); in addition, the winds are conducive to coastal upwelling more or less year round, but the high values of Chlsat and PP occurred only in the rainy season. The values in the T4 transect were an exception caused by the convergence of the current from the north that ran parallel to the coast of the Yucatan Peninsula and the current from the north that ran parallel to the coast of Tampico and Veracruz. This convergence generates a seaward flow beyond 200 km from the coast (Martínez-López and Parés-Sierra 1998, Martínez-López and Zavala-Hidalgo 2009) that carries high concentrations of Chlsat to locations that are sometimes even farther than the study area (Fig. 2d).
Álvarez-Góngora and Herrera-Silveira (2006) found high concentrations of Chla (up to >12 mg·m-3, measured in water samples) off Celestún (in the northernmost part of our study area) during the rainy season and attributed them to the nutrients supplied by runoff. The values reported by Álvarez-Góngora and Herrera-Silveira (2006) were higher than the maximum values obtained in this study (Chlsat up to >8 mg·m-3). This difference could have resulted from our data being monthly averages of large areas (81 km2), whereas Álvarez-Góngora and Herrera-Silveira (2006) used instantaneous and punctual sampling. Despite the large differences in methodologies, these numbers showed a high concordance, indicating that satellite data are not overestimating Chla. Carranza-Edwards et al. (1993) reported a gradient in the concentration of suspended sediments (which also translates into dissolved nutrients) from the coast toward the sea caused by the currents of the Campeche Bank. These authors suggested that suspended sediments are closely related to biological communities, especially phytoplankton.
Nutrients that are carried to the sea by runoff are not able to reach the outer neritic zone (>60 km), as they precipitate (e.g., iron) or are consumed by phytoplankton, but phytoplankton biomass can be carried much further offshore by rip currents, such as the one observed in T4 (Fig. 2c-d). The differences in Chlsat and PP values between the inner and outer neritic zones and the time lag in which the maximum values occurred suggested that there were different fertilization processes in these 2 zones. As indicated above, in the outer neritic zone, maximum values of these properties occurred during the cold front season (November-February). With cold fronts, the water column tends to homogenize, which leads to lower surface temperatures and a greater availability of nutrients in the euphotic zone (Müller-Karger et al. 1991, Liceaga and Luna 1999). The fact that the values of Chlsat and PP in the outer neritic zone were lower than those in the inner zone indicated that in the outer zone, cold front mixing fertilizes the euphotic zone to a much lesser degree than freshwater runoff in the inner zone. Another possible factor is the difference in zooplankton grazing in each region (Pal and Choudhury 2014), but there are no data to explore this effect. The Chlsat results from water samples during the cold front season in the outer neritic zone (0.5-0.9 mg·m-3) were similar to those reported by Liceaga and Luna (1999) (0.4−0.9 mg·m-3), which also indicated a high degree of agreement, despite the difference in the 2 methodologies.
Oceanographic conditions in the inner zone were favorable during the cold front season for high values of Chlsat and PP, but these were not the maximum values. The highest values of Chlsat and PP coincided with the maximum values of SSH, contrary to what was expected in an oceanic area without freshwater input. In the inner zone of our study area, freshwater input causes an increase in nutrients and an increase in SSH due to a lower water density in the upper part, as well as lower atmospheric pressure during storms.
The decisive evidence of the differences in Chlsat and PP between the T5 zones could be related to the existence of different coastal ecosystems (Arreola-Lizárraga et al. 2018). The northern zone has mangroves, which export large amounts of dissolved nutrients offshore (Jennerjahn and Ittekkot 2002). The south area has the Grijalva-Usumacinta System and the Terminos Lagoon; however, fewer nutrients are exported to the sea from here than from the mangroves in the north (Hernández-Arana et al. 2003). The central zone lacks very productive coastal ecosystems, and the contribution of the Champotón River is much less than that of the Grijalva-Usumacinta System, so its effects are very localized (Rebolledo-Vieyra 2010).
The SSH tended to increase in the last years that were sampled (Figs. 2b, 3c-d, 4b), which coincided with the results reported by Tamisiea et al. (2014), who mentioned that the SSH annually increased in the Gulf of Mexico by ~6 mm in association with climate change. Seasonal variations and interannual changes in SST have been reported by Muller-Karger et al. (2015), although these authors did not include data from 2013 onward. The temporal variation patterns in Chlsat did not coincide with those in SST, which suggested that in this study region, there are other physical and biological factors that affect the behavior of the phytoplankton biomass. Muller-Karger et al. (2015) reported that the maximum values of Chlsat occurred when the lowest temperatures coincided with greater than average anomalous winds. The Chlsat maxima that did not coincide with the lowest temperatures in the study area may have been due to the occurrence and intensity of cold fronts, hurricanes, and tropical storms in the region, which cause high rainfall.
The performed analyses confirmed the reported seasonality of Chlsat for the region off Campeche (Martínez-López and Zavala-Hidalgo 2009). However, although in most regionalizations of the Gulf of Mexico, the study area is considered a single region, our results show that it is highly heterogeneous due to local and regional physical phenomena that occur there.

