


 text in
  English (pdf)
 Article in xml format
 Article references
 Send this article by e-mail
 Cited by SciELO
  Similars in
SciELO
Similars in
SciELO 
 Permalink
Introduction
Coral reefs are the most diverse marine ecosystems (Plaisance et al. 2011, Fisher et al. 2015), and they are considered to be the most vulnerable (Bridge et al. 2013, Hughes et al. 2018a). Coral reefs have decreased over 50% over the past 40 years (Jackson et al. 2014, Hughes et al. 2018b), and an estimated one-third of the reef-building coral species are in danger of extinction (Carpenter et al. 2008, Plaisance et al. 2011). The ongoing and growing degradation of these ecosystems has been reflected by the loss of biodiversity (Ostrander et al. 2000, Tratalos and Austin 2001, Munday 2004), and it has greatly affected the fish fauna that inhabit and depend on these systems (Mumby et al. 2004, Graham et al. 2015, Samoilys et al. 2018). Hixon (2009) indicated that roughly 31% of fish species are in danger of extinction and 24% fall in one of the threatened categories.
Given the critical situation of coral reefs, which involves serious environmental crisis and biodiversity loss (Martínez-Meyer et al. 2014), developing biotic inventories and quantifying biodiversity become essential in developing and implementing pertinent and successful conservation and utilization strategies (Perrings et al. 2011, López-Pérez et al. 2012, Lubchenco and Grorud-Colvert 2015). This is particularly important in areas that are subject to ongoing impacts and where little is known about local biodiversity.
Huatulco Bays, in the state of Oaxaca, is considered one of the most important coral reef regions on the Pacific coast of Mexico, since it is home to a large diversity of echinoderm, coral, and fish species (López-Pérez et al. 2014; Juárez-Hernández and Tapia-García 2017, 2018a). However, as López-Pérez et al. (2019) reported, information about its biodiversity is still scarce and fragmented. It is important to note that the coral communities in this region have undergone a variety of alterations due to both natural (Glynn and Leyte-Morales 1997; Lirman et al. 2001; López-Pérez et al. 2002, 2016) and anthropogenic factors (López-Pérez et al. 2002, Granja-Fernández and López-Pérez 2008, Juárez-Hernández and Tapia-García 2018b). In particular, coastal development in the region has been reported to have rapidly increased over the past 20 years (Robles-Zavala and Chang-Reynoso 2018), and this has undoubtedly had an adverse impact on the coral communities and their biodiversity.
The ichthyofauna in Huatulco Bays has been estimated to be composed of 150 to 186 species (López-Pérez et al. 2014, 2019; Juárez-Hernández and Tapia-García 2018a). In this bay complex, Maguey Bay is notable for high richness in coral and fish (López-Pérez et al. 2010, 2014; Juárez-Hernández and Tapia-García 2017). While Maguey Bay has been one of the most widely studied areas (2004-2012) (López-Pérez et al. 2012, 2014; Juárez-Hernández et al. 2013; Juárez-Hernández and Tapia-García 2017), information about the ichthyofauna in it is incomplete, since there is no information for the year 2005. Additionally, it is important to mention that this bay experienced siltation disturbance in 2009 because of the entrance of sediments associated with coastal development projects, and this contributed to high mortality in corals and decreased abundance, number of species and diversity in fish communitites (Juárez-Hernández and Tapia-García 2018b).
The present study was designed to provide information about the composition and structure of the fish community in Maguey Bay and its spatiotemporal variation across an annual cycle (2005-2006). This information expands upon existing ichthyofauna records for this area, and since data were taken before any disturbances occurred, it should be helpful for analyzing the magnitude and direction of changes in the fish community.
Materials and methods
The Huatulco Bays region is located in the central portion of the coast of Oaxaca, Mexico (Fig. 1). Given the great coral diversity (11 hermatypic coral species) and the widespread coral coverage (approximately 45.9 ha) of coral communities in this area, these bays have been considered an important part of the Pacific coast of Mexico (López-Pérez and Hernández-Ballesteros 2004; Tapia-García et al. 2007a; López-Pérez et al. 2014, 2019). This region has 2 seasons: the dry season (November-April) and the rainy season (May-October) (López-Pérez et al. 2019). Wind surge occurs between October and April in the central portion of the Gulf of Tehuantepec (Trasviña et al. 2003), resulting in sea surface temperatures ranging from 18 to 25 ºC, and the Costa Rica Coastal Current is dominant between May and October, resulting in sea surface temperatures exceeding 24 ºC (Fiedler and Talley 2006, Tapia-García et al. 2007b). In the Huatulco Bay complex, Maguey Bay is considered one of the richest in coral (8 spp.) and fish (69 spp.) (López-Pérez et al. 2012, Juárez-Hernández and Tapia-García 2017). Its main feature is a coral reef area that is smaller than that in the other zones (0.44 ha) and is composed of small patches alternating with rocky and sandy substrates (Juárez-Hernández and Tapia-García 2017).

Figure 1 Geographic location of Maguey Bay and distribution of sampling points (transects). T1 = rocky habitat, T2 = rocky-coral habitat, T3 = coral-rocky habitat, T4 and T5 = sandy habitats, T6 = mixed habitat, T7 = coral habitat, T8 = coral-rocky habitat, T9 = rocky-coral habitat.
To characterize the fish communities in Maguey Bay, field work was conducted using prospective sampling to identify sampling points, and the sampling points established by Juárez-Hernández et al. (2013) were considered. Each sampling point was characterized using a 10-m transect that was divided into 4 equal parts, and a diagram of each quadrant was obtained; taking the quadrants all together, the percentage of substrates was estimated for each transect. From this, transects were identified as follows: rocky habitat (T1), rocky-coral habitat (T2), coral-rocky habitat (T3), sandy habitats (T4 and T5), mixed habitat (T6), coral habitat (T7), coral-rocky habitat (T8), and rocky-coral habitat (T9) (Fig. 1). The average distance between transects was 60 m. The visual census technique was used to characterize ichthyofauna in transects measuring 10 m long and 2.5 m wide, with a minimum depth of 1 m (T1, T2, T4, and T5) and a maximum depth of 5 m (T3 and T9). This resulted in a total of 47 transects, which were sampled throughout January (5 transects), May (9 transects), July (9 transects), and September (9 transects) 2005, and February (7 transects) and May (8 transects) 2006. Upon completion of the fish census, each transect was measured for rugosity, diversity of substrate, and degree of wave exposure. Rugosity was estimated using the method proposed by Luckhurst and Luckhurst (1978) and that proposed by Cheney and Côté (2003). To determine rugosity, a 10-m long rope was used, which was carefully placed on the substrate following the contour and was then measured in length with a tape measure. The ratio of total length and the length obtained by the contour determined the rugosity. The diversity of the substrate was evaluated by considering the number of elements in each transect (coral, rock, and sand), and the degree of wave exposure was characterized according to the observed intensity of the waves (none, low, moderate, and high) (Table 1). Depending on habitat characteristics, transects with similar substrate proportions (rocky-coral habitat T2 and T9) (rocky-coral habitat T3 and T8) were treated as independent units, since they individually have distinctive features, such as location, degree of exposure to waves, and depth.
Table 1 Habitat characteristics by transect sampled in Maguey Bay during the 2005-2006 cycle.
| Transect | Diversity of substrate | Rugosity (mean) | Depth (mean) | Coral coverage (%) | Rocky coverage (%) | Sandy coverage (%) | Wave exposure |
| T1 (rocky habitat) | 1 | 2.4 | 1.2 | 0 | 100 | 0 | 1 |
| T2 (rocky-coral habitat) | 2 | 3.0 | 1.7 | 30 | 70 | 0 | 2 |
| T3 (coral-rocky habitat) | 2 | 2.1 | 4.8 | 55 | 45 | 0 | 3 |
| T4 (sandy habitat) | 1 | 1.1 | 1.1 | 0 | 0 | 100 | 1 |
| T5 (sandy habitat) | 1 | 1.6 | 1.9 | 0 | 0 | 100 | 3 |
| T6 (mixed habitat) | 3 | 2.4 | 2.2 | 2 | 18 | 80 | 2 |
| T7 (coral habitat) | 1 | 1.3 | 2.5 | 100 | 0 | 0 | 2 |
| T8 (coral-rocky habitat) | 2 | 2.7 | 3.6 | 85 | 15 | 0 | 3 |
| T9 (rocky-coral habitat) | 2 | 3.3 | 5.3 | 40 | 60 | 0 | 4 |
The species were identified according to Allen and Robertson (1998) and Amezcua-Linares (2009). The species taxonomic status was verified with Fricke et al. (2020a), and the taxonomic arrangement was based on Fricke et al. (2020b). The geographic distribution of the species was verified with databases from Fishbase (Froese and Pauly 2019) and the Fish System of the Eastern Pacific (Robertson and Allen 2015). Species accumulation curves were generated using a non-parametric estimator based on abundance (Chao 1), and the maximum value was used to determine the percentage of representativeness of the study (Soberón and Llorente 1993). The curves were constructed with 10,000 randomizations using the EstimateS v.9 program (Colwell 2013). The performance of the Chao 1 estimator was determined by calculating bias and accuracy in accordance with Walther and Moore (2005), where a near-zero value indicated less bias and greater accuracy.
Abundance (N), number of species, diversity of Shannon and Wiener (1963) (Hʹn), and diversity of Fisher et al. (1943) (α) were calculated. Spatial and temporal analyses of these characteristics were performed using one-way analysis of variance (ANOVA) or the Kruskal-Wallis test, with the respective multiple comparison tests (Tukey, Dunn). The application relevance of the variance analysis was determined depending on whether the normality and homoscedasticity assumptions were met. The degree of similarity of the ichthyofauna among transects and months was assessed using the Bray-Curtis index (Clarke and Warwick 1994). The existence of spatial differences (transects) and temporal differences (months) was determined by generating a non-metric multidimensional scale (nMDS) for visual detection. An analysis of similarities (ANOSIM) was used to identify significant differences in the spatiotemporal composition and abundance of fish. When ANOSIM indicated significant differences, a similarity percentage (SIMPER) analysis was conducted to identify the species responsible for the differences. These analyses were performed using a similarity matrix and the Bray-Curtis index, with the PRIMER v.5 packet (Clarke and Gorley 2006).
The Spearman coefficient correlation was used to evaluate how community characteristics and species abundance were related with the characteristics of the habitat (diversity of substrate, rugosity, depth, degree of wave exposure, and percentage of rock, coral, and sand). The degree of correlation between the species abundance matrix and the habitat characteristics matrix was analyzed using the RELATE routine (Clarke 1993) with 999 permutations in the PRIMER v.5 packet (Clarke and Gorley 2006). Finally, a canonical correspondence analysis was performed to analyze the influence of habitat characteristics on species. Before proceeding with this analysis, habitat attributes were standardized using ranges. The significance of the canonical axes and the first axis were evaluated using the Monte Carlo test with 999 permutations. These analyses were performed with the PAST v.4.05 packet (Hammer et al. 2001).
Results
A total of 4,030 fishes corresponding to 60 species, 47 genera, 29 families, 15 orders, and 2 classes were identified during this study (Table 2). The order Perciformes had the most species, of which 8 and 6 species belonged to the families Pomacentridae and Labridae, respectively (Table 2). The genera with the most number of species were Halichoeres with 4 species, and Haemulon, Lutjanus, and Stegastes with 3 species each (Table 2). Regarding the number of species indicated by the Chao 1 richness estimator, the maximum expected richness value was 64 species. The performance of the estimator was optimal given that bias and accuracy were close to zero (0.0670 and 0.0044, respectively).
Table 2. Systematic list of the Maguey Bay ichthyofauna during the 2005-2006 cycle
| Class | Order | Family | Species |
| Elasmobranchii | |||
| Myliobatiformes | Dasyatidae | Hypanus longus (Garman, 1880) | |
| Urotrygonidae | Urobatis concentricus Osburn & Nichols, 1916 | ||
| Urotrygon rogersi (Jordan & Starks, 1895) | |||
| Gymnuridae | Gymnura marmorata (Cooper, 1864) | ||
| Actinopteri | |||
| Anguilliformes | Muraenidae | Gymnomuraena zebra (Shaw, 1797) | |
| Muraena lentiginosa Jenyns,1842 | |||
| Ophichthidae | Quassiremus nothochir (Gilbert, 1890) | ||
| Clupeiformes | Clupeidae | Harengula thrissina (Jordan & Gilbert, 1882) | |
| Siluriformes | Ariidae | Cathorops dasycephalus (Günther, 1864) | |
| Aulopiformes | Synodontidae | Synodus lacertinus Gilbert, 1890 | |
| Holocentriformes | Holocentridae | Sargocentron suborbitale (Gill, 1863) | |
| Syngnathiformes | Fistularidae | Fistularia commersonii Rüppell, 1838 | |
| Carangiformes | Carangidae | Caranx caballus Günther, 1868 | |
| Caranx caninus Günther, 1867 | |||
| Selar crumenophthalmus (Bloch, 1793) | |||
| Trachinotus rhodopus Gill, 1863 | |||
| Beloniformes | Hemirhamphidae | Hemiramphus saltator Gilbert & Starks, 1904 | |
| Mugiliformes | Mugilidae | Mugil curema Valenciennes, 1836 | |
| Blenniiformes | Bleniidae | Ophioblennius steindachneri Jordan & Evermann, 1898 | |
| Acanthuriformes | Pomacanthidae | Holacanthus passer Valenciennes, 1846 | |
| Chaetodontidae | Chaetodon humeralis Günther, 1860 | ||
| Johnrandallia nigrirostris (Gill, 1862) | |||
| Zanclidae | Zanclus cornutus (Linnaeus, 1758) | ||
| Acanthuridae | Acanthurus xanthopterus Valenciennes, 1835 | ||
| Prionurus laticlavius (Valenciennes, 1846) | |||
| Tetraodontiformes | Diodontidae | Diodon holocanthus Linnaeus, 1758 | |
| Diodon hystrix Linnaeus, 1758 | |||
| Tetraodontidae | Arothron meleagris (Anonymous, 1798) | ||
| Canthigaster punctatissima (Günther, 1870) | |||
| Balistidae | Balistes polylepis Steindachner, 1876 | ||
| Sufflamen verres (Gilbert & Starks, 1904) | |||
| Centrarchiformes | Kyphosidae | Kyphosus elegans (Peters, 1869) | |
| Kyphosus vaigiensis (Quoy & Gaimard, 1825) | |||
| Cirrhitidae | Cirrhitichthys oxycephalus (Bleeker, 1855) | ||
| Cirrhitus rivulatus Valenciennes, 1846 | |||
| Oxycirrhites typus Bleeker, 1855 | |||
| Perciformes | Serranidae | Cephalopholis panamensis (Steindachner, 1877) | |
| Epinephelus labriformis (Jenyns, 1840) | |||
| Lutjanidae | Lutjanus argentiventris (Peters, 1869) | ||
| Lutjanus colorado Jordan & Gilbert, 1882 | |||
| Lutjanus novemfasciatus Gill, 1862 | |||
| Gerreidae | Eucinostomus currani Zahuranec, 1980 | ||
| Gerres simillimus Regan, 1907 | |||
| Haemulidae | Haemulon maculicauda (Gill, 1862) | ||
| Haemulon scudderii Gill, 1862 | |||
| Haemulon sexfasciatum Gill, 1862 | |||
| Pomacentridae | Abudefduf concolor (Gill, 1862) | ||
| Abudefduf troschelii (Gill, 1862) | |||
| Chromis atrilobata Gill, 1862 | |||
| Microspathodon bairdii (Gill, 1862) | |||
| Microspathodon dorsalis (Gill, 1862) | |||
| Stegastes acapulcoensis (Fowler, 1944) | |||
| Stegastes flavilatus (Gill, 1862) | |||
| Stegastes rectifraenum (Gill, 1862) | |||
| Labridae | Bodianus diplotaenia (Gill, 1862) | ||
| Halichoeres chierchiae Di Caporiacco, 1948 | |||
| Halichoeres dispilus (Günther, 1864) | |||
| Halichoeres nicholsi (Jordan & Gilbert, 1882) | |||
| Halichoeres notospilus (Günther, 1864) | |||
| Thalassoma lucasanum (Gill, 1862) |
According to the temporal analysis, abundance (N) ranged from 416 to 1,235 individuals, with the minimum value in May (x̅ = 46.22) and the maximum in January (x̅ = 153.20) (Fig. 2). The largest number of species (x̅ = 12.11) and diversity (Hʹn: x̅ = 1.80; α: x̅ = 4.51) occurred in September, while the lowest values for number of species (x̅ = 9.14) and diversity (Hʹn, x̅ = 1.61; α: x̅ = 2.96) occurred in February (Fig. 2). Four species (Stegastes acapulcoensis, Thalassoma lucasanum, Microspathodon dorsalis, and Chromis atrilobata) were the most abundant in July, September, February, and May 2006 (Fig. 3).
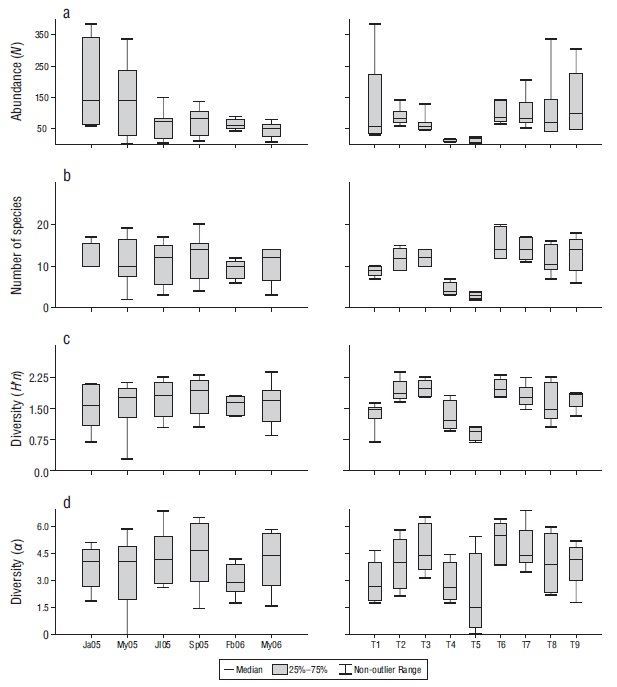
Figure 2 Temporal (months) and spatial (transects) variations in the abundance (number of individuals, N) (a), number of species (b), and diversity according to the Shannon-Wiener index (Hʹn) (c) and the Fisher index (α) (d) of the fish community in Maguey Bay. Ja05 = January 2005, My05 = May 2005, Jl05 = July 2005, Sp05 = September 2005, Fb06 = February 2006, My06 = May 2006. T1 = rocky habitat, T2 = rocky-coral habitat, T3 = coral-rocky habitat, T4 and T5 = sandy habitats, T6 = mixed habitat, T7 = coral habitat, T8 = coral-rocky habitat, T9 = rocky-coral habitat.

A significant difference in species abundance was found (ANOVA = 3.146, P = 0.010), which was evidenced by the abundance in January vs. May (2006) (Tukey = 4.335, P < 0.050). No temporal differences were found in the number of species (Kruskal-Wallis, P > 0.05) or Hʹn (ANOVA, P > 0.050) (α) (ANOVA, P > 0.050). The order of the months did not present a clear pattern of differentiation (Fig. 4), which is consistent with the findings in ANOSIM (ANOSIM = 0.034, P > 0.050).
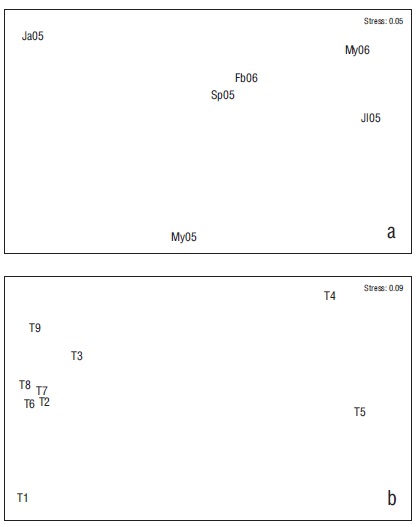
Figure 4 Non-metric multidimensional scale of months (a) and transects (T) (b). Ja05 = January 2005, My05 = May 2005, Jl05 = July 2005, Sp05 = September 2005, Fb06 = February 2006, My06 = May 2006. T1 = rocky habitat, T2 = rocky-coral habitat, T3 = coral-rocky habitat, T4 and T5 = sandy habitats, T6 = mixed habitat, T7 = coral habitat, T8 = coral-rocky habitat, T9 = rocky-coral habitat.
In terms of the spatial analysis, species abundance (N) by type of habitat ranged from 45 to 649 individuals, with the minimum in sandy habitats (T5) (x̅ = 9.250) and (T4) (x̅ = 11.000) and the maximum in a rocky-coral habitat (T9) (x̅ = 129.600) (Fig. 2). The largest number of species value was found in the coral habitat (T7) (x̅ = 15.400) and the smallest in the sandy habitats (T5) (x̅ = 3.000) and (T4) (x̅ = 4.500) (Fig. 2). The mixed habitat (T6) had the highest diversity (Hʹn: x̅ = 1.990; α: x̅ = 5.100) and one of the sandy habitat (T5) had the lowest (Hʹn: x̅ = 0.910; α: x̅ = 2.110) (Fig. 2). Stegastes acapulcoensis, T. lucasanum, C. atrilobata, and M. dorsalis had the largest relative abundances in the transects with rock and coral (T2, T3, T6, T7, T8, and T9) (Fig. 5), while Mugil curema and Diodon holocanthus had the greatest abundance in sandy habitats (Fig. 5).
A statistical comparison of the transects showed significant differences for species abundance (Kruskal-Wallis = 24.020, P < 0.010), richness (ANOVA = 9.792, P < 0.001), and diversity (Hʹn: Kruskal-Wallis = 24.980, P < 0.050; α: Kruskal-Wallis = 23.890, P < 0.050). These differences were associated with sandy (T4, T5) and rocky (T1) habitats (Table 3).
The order of the transects indicated that sandy and rocky habitats (T4, T5, T1) had low similarity to the other habitats (ANOSIM = 0.310, P < 0.001) (Fig. 4). The comparison test for ANOSIM also found that the greatest differences occurred between sandy habitats (T4 and T5) and the other habitats (Table 4). This corresponded to the average dissimilarity values (over 80%) in the SIMPER analysis, which indicated that the dominant species were mostly responsible for this difference (Table 4). One aspect worth noting on this analysis, as well as on the nMDS, is the dissimilarity between the transects located in the inner part of the bay (T2 and T8) versus those in the outer areas that were subject to more wave exposure (T9 and T3). The larger abundance of C. atrilobata and Prionurus laticlavius was responsible for this dissimilarity (Fig. 5).
Table 3 Results of the multiple comparison tests (Tukey, Dunn) between transects (T) by community parameters. *: P < 0.050; **: P < 0.010; ***: P < 0.001; T1: rocky habitat; T2: rocky-coral habitat; T3: coral-rocky habitat; T4 and T5: sandy habitats; T6: mixed habitat; T7: coral habitat; T8: coral-rocky habitat; T9: rocky-coral habitat.
| Abundance (N) (Dunn's test) | Number of species (Tukey's test) | Diversity (Hʹn) (Dunn's test) | Diversity (α) (Dunn's test) |
| T4 vs. T1* | T1 vs. T6** | T1 vs. T3** | T1 vs. T6* |
| T4 vs. T2** | T4 vs. T2*** | T1 vs. T6** | T1 vs. T7* |
| T4 vs. T6*** | T4 vs. T3*** | T4 vs. T2* | T4 vs. T6* |
| T4 vs. T7** | T4 vs. T6*** | T4 vs. T3** | T5 vs. T3*** |
| T4 vs. T8* | T4 vs. T7*** | T4 vs. T6* | T5 vs. T6** |
| T4 vs. T9** | T4 vs. T8** | T5 vs. T2*** | T5 vs. T7* |
| T5 vs. T1** | T4 vs. T9*** | T5 vs. T3*** | |
| T5 vs. T2** | T5 vs. T2*** | T5 vs. T6*** | |
| T5 vs. T6*** | T5 vs. T3*** | T5 vs. T7** | |
| T5 vs. T7*** | T5 vs. T6*** | T5 vs. T8* | |
| T5 vs. T8* | T5 vs. T7*** | T5 vs. T9** | |
| T5 vs. T9** | T5 vs. T8*** | ||
| T5 vs. T9*** |
Table 4 Results of the analysis of similarity (ANOSIM) and the similarity percentage (SIMPER) analysis by transect sampled in Maguey Bay during the 2005-2006 cycle.
| ANOSIM (pairwise test) | SIMPER analysis | ||||
| Transects | R | P | Average dissimilarity | Species that made up 80% of the diffeerentiation | |
| TI | T4 | 0.996 | 0.005 | 98.92 | Stegastes acapulcoensis, Harengula thrissina, Thalassoma lucasanum, Microspathodon dorsalis |
| T1 | T5 | 0.742 | 0.005 | 98.53 | S. acapulcoensis, Harengula thrissina, T. lucasanum, M. dorsalis |
| T1 | T9 | 0.256 | 0.039 | 77.18 | Harengula thrissina, Chromis atrilobata, Prionurus laticlavius, M. dorsalis, S. acapulcoensis |
| T2 | T4 | 1.000 | 0.005 | 99.71 | S. acapulcoensis, M. dorsalis, C. atrilobata, T. lucasanum, Synodus larcetinus |
| T2 | T5 | 0.762 | 0.005 | 99.19 | S. acapulcoensis, M. dorsalis, C. atrilobata, T. lucasanum |
| T2 | T9 | 0.295 | 0.024 | 62.86 | C. atrilobata, P. laticlavius, S. acapulcoensis, T. lucasanum, M. dorsalis |
| T3 | T4 | 1.000 | 0.008 | 98.79 | S. acapulcoensis, M. dorsalis, C. atrilobata, T. lucasanum |
| T3 | T5 | 0.688 | 0.008 | 98.77 | S. acapulcoensis, M. dorsalis, C. atrilobata, T. lucasanum |
| T4 | T6 | 1.000 | 0.008 | 99.61 | S. acapulcoensis, T. lucasanum, M. dorsalis, Abudefduf troschelii |
| T4 | T7 | 1.000 | 0.005 | 99.56 | T. lucasanum, S. acapulcoensis, M. dorsalis, C. atrilobata, |
| T4 | T8 | 1.000 | 0.005 | 99.91 | S. acapulcoensis, M. dorsalis, C. atrilobata, T. lucasanum |
| T4 | T9 | 1.000 | 0.008 | 98.95 | M. dorsalis, C. atrilobata, P. laticlavius, S. acapulcoensis |
| T5 | T6 | 0.770 | 0.008 | 99.16 | S. acapulcoensis, T. lucasanum, M. dorsalis, A. troschelii |
| T5 | T7 | 0.770 | 0.005 | 99.30 | T. lucasanum, S. acapulcoensis, M. dorsalis, C. atrilobata, |
| T5 | T8 | 0.770 | 0.005 | 99.24 | S. acapulcoensis, T. lucasanum, C. atrilobata, M. dorsalis, |
| T5 | T9 | 0.688 | 0.008 | 98.72 | M. dorsalis, C. atrilobata, P. laticlavius, S. acapulcoensis |
| T6 | T9 | 0.284 | 0.048 | 65.53 | C. atrilobata, T. lucasanum, P. laticlavius, S. acapulcoensis, M. dorsalis |

The analysis of relative abundance and the frequency of the spatiotemporal occurrence showed that S. acapulcoensis, T. lucasanum, M. dorsalis, and C. atrilobata were the dominant species, since they accumulated over 75% of the total abundance in the system and presented a spatial and temporal frequency of more than 80%. Abundance was found to be related to rugosity (ρ = 0.383, P < 0.010), diversity of substrate (ρ = 0.374, P < 0.010), depth (ρ = 0.361, P < 0.010), coral coverage (ρ = 0.315, P < 0.050), and rocky coverage (ρ = 0.307, P < 0.050). The number of species was related to coral coverage (ρ = 0.553, P < 0.001), depth (ρ = 0.517, P < 0.001), diversity of substrate (ρ = 0.485, P < 0.001), and wave exposure (ρ = 0.386, P < 0.010). Diversity according to Hʹn was related to the diversity of substrate (ρ = 0.541, P < 0.001), depth (ρ = 0.457, P < 0.010), coral coverage (ρ = 0.406, P < 0.010), and wave exposure (ρ = 0.324, P < 0.050), while diversity according to α was related to coral coverage (ρ = 0.378, P < 0.010), diversity of substrate (ρ = 0.541, P < 0.050), and depth (ρ = 0.457, P < 0.050). This study found that abundance, number of species, and diversity (Hʹn) were negatively related to sandy coverage (ρ = -0.456, P < 0.010; ρ = -0.410, P < 0.010; ρ = -0.315, P < 0.050; respectively).
An abundance of over 49% of species was correlated with certain habitat characteristics (Table 5). The abundance of Holacanthus passer, Kyphosus elegans, Lutjanus novemfasciatus, P. laticlavius, and Suflamen verres was related to depth and wave exposure (Table 5). The abundance of Haemulon sexfaciatum, Kyphosus vaigiensis, and Microspathodon bairdii was related to depth (Table 5). The abundance of Arothron meleagris, Cephalopholis panamensis, Canthigaster punctatissima, Cirrhitus rivulatus, Lutjanus colorado, Ophioblennius steindachneri, T. lucasanum, and Zanclus cornutus was influenced by the coral coverage (Table 5). Coral coverage and wave exposure also affected the abundance of C. atrilobata.
Table 5 Relation between abundance of species and habitat characteristics in Maguey Bay during the 2005-2006 cycle. *: P < 0.05.
| Species | Diversity of substrate | Rugosity | Depth | Coral coverage | Rocky coverage | Sandy coverage | Wave exposure |
| Abudefduf concolor | 0.736* | 0.158 | 0.115 | –0.275 | –0.107 | 0.309 | –0.081 |
| Arothron meleagris | –0.123 | –0.051 | 0.250 | 0.881* | –0.358 | –0.447 | 0.243 |
| Abudefduf troschelii | 0.680* | 0.227 | 0.397 | 0.029 | –0.031 | 0.000 | 0.028 |
| Bodianus diplotaenia | 0.556 | 0.443 | 0.429 | 0.520 | 0.339 | –0.689* | 0.226 |
| Chromis atrilobata | 0.297 | 0.601 | 0.613 | 0.697* | 0.061 | –0.620 | 0.653* |
| Caranx caballus | –0.354 | 0.113 | –0.360 | –0.337 | 0.680* | –0.248 | –0.500 |
| Cephalopholis panamensis | 0.354 | 0.172 | 0.396 | 0.783* | –0.344 | –0.378 | 0.417 |
| Canthigaster punctatissima | –0.354 | –0.420 | 0.120 | 0.634* | –0.354 | –0.248 | –0.125 |
| Cirrhitus rivulatus | –0.158 | –0.029 | –0.143 | 0.715* | –0.186 | –0.444 | 0.000 |
| Diodon holocanthus | –0.521 | –0.690* | –0.470 | –0.496 | –0.521 | 0.810* | –0.295 |
| Haemulon maculicauda | –0.069 | –0.524 | –0.436 | –0.450 | –0.409 | 0.685* | –0.534 |
| Halichoeres nicholsi | 0.702* | 0.263 | 0.000 | 0.153 | 0.019 | –0.141 | –0.018 |
| Holacanthus passer | 0.572 | 0.622 | 0.882* | 0.196 | 0.122 | –0.256 | 0.644* |
| Haemulon sexfaciatum | 0.177 | 0.549 | 0.840* | 0.052 | 0.266 | –0.248 | 0.625 |
| Kyphosus vaigiensis | 0.622 | 0.574 | 0.748* | –0.159 | 0.176 | –0.004 | 0.456 |
| Kyphosus elegans | 0.265 | 0.576 | 0.875* | 0.092 | 0.263 | –0.278 | 0.682* |
| Lutjanus argentiventris | 0.672* | 0.346 | 0.070 | –0.235 | 0.345 | –0.073 | –0.240 |
| Lutjanus colorado | –0.354 | –0.420 | 0.120 | 0.634* | –0.354 | –0.248 | –0.125 |
| Lutjanus novemfasciatus | 0.177 | 0.549 | 0.840* | 0.052 | 0.266 | –0.248 | 0.625* |
| Microspathodon bairdii | 0.264 | 0.173 | 0.832* | 0.561 | –0.064 | –0.412 | 0.484 |
| Mugil curema | –0.549 | –0.563 | –0.318 | –0.534 | –0.441 | 0.779* | –0.049 |
| Microspathodon dorsalis | 0.421 | 0.580 | 0.714* | 0.533 | 0.335 | –0.696* | 0.332 |
| Ophioblennius steindachneri | 0.495 | 0.549 | 0.250 | 0.736* | 0.154 | –0.724* | 0.332 |
| Prionurus laticlavius | 0.193 | 0.551 | 0.843* | 0.045 | 0.263 | –0.240 | 0.624* |
| Stegastes acapulcoensis | 0.403 | 0.473 | 0.029 | 0.453 | 0.413 | –0.691* | –0.141 |
| Stegastes rectifraenum | 0.739* | 0.279 | –0.025 | –0.313 | 0.049 | 0.219 | –0.182 |
| Sargocentron suborbitalis | 0.267 | 0.573 | 0.544 | 0.408 | 0.051 | –0.375 | 0.661* |
| Suflamen verres | 0.177 | 0.549 | 0.840* | 0.052 | 0.266 | –0.248 | 0.625* |
| Thalassoma lucasanum | 0.309 | 0.136 | 0.174 | 0.707* | –0.227 | –0.406 | 0.074 |
| Zanclus cornutus | –0.354 | –0.420 | 0.120 | 0.634* | –0.354 | –0.248 | –0.125 |
There was a correlation between the matrix for species abundance and the matrix for habitat characteristics (ρ = 0.512, P < 0.008). According to the canonical correspondence analysis, habitat attributes explained more than 86% of the fish community variation in Maguey Bay. According to the Monte Carlo test, the first axis and the sum of all canonical axes were significant (P < 0.05). In this sense, the first and second axes explained more than 65% of the variation. The first axis was related to sandy coverage, while the second axis was related to wave exposure, depth, coral coverage, and substrate diversity. The ordering diagram allowed us to distinguish 3 associations related to the type of coverage (sandy, rocky, and mixed) and the set of species associated with each of these (Fig. 6). The first association corresponded to sandy habitats (T4 and T5) and their characteristic species (Fig. 6). The second association was related to rocky cover and rocky habitat (T1) and the set of associated species (Fig. 6). The third association was related to rocky-coral/coral-rocky (T2, T9, T3, T8), coral (T7), and mixed (T6) habitats. In this regard, certain species (P. laticlavius, L. novemfasciatus, K. elegans, K. vaigiensis, and H. passer) were associated with the depth and wave exposure attributes, with both attributes having a greater magnitude in the rocky-coral habitat (T9) (Fig. 6). From this perspective, the relationship was observed for the habitats with the greatest coral coverage and rugosity (T7, T3, and T8) and the set of species related to these habitat characteristics (Fig. 6).

Acon = Abudefduf concolor, Amel = Arothron meleagris, Atros = Abudefduf troschelii, Axan = Acanthurus xanthoptherus, Bpol = Balistes polylepis, Bdip = Bodianus diplotaenia, Catr = Chromis atrilobata, Ccab = Caranx caballus, Ccan = Caranx caninus, Cdas = Cathorops dasycephalus, Chum = Chaetodon humeralis, Coxi = Cirrhitichthys oxicephalus, Cpan = Cephalopholis panamensis, Cpun = Canthigaster punctatissima, Criv = Cirrhitus rivulatus, Dhol = Diodon holocanthus, Dhys = Diodon hystrix, Ecur = Eucinostomus currani, Elab = Epinephelus labriformis, Fcom = Fistularia commersonii, Gcin = Gerres cinereus, Gmar = Gymnura marmorata, Gzeb = Gymnomuraena zebra, Hchi = Halichoeres chierchiae, Hdis = Halichoeres dispilus, Hmac = Haemulon maculicauda, Hnic = Halichoeres nicholsi, Hnot = Halichoeres notospilus, Hlon = Hypanus longus, Hpas = Holacanthus passer, Hsal = Hemiramphus saltator, Hscu = Haemulon scudderii, Hsex = Haemulon sexfaciatum, Hthr = Harengula thrissina, Jnig = Johnrandallia nigrirostris, Kvag = Kyphosus vaigiensis, Kele = Kyphosus elegans, Larg = Lutjanus argentiventris, Lcol = Lutjanus colorado, Lnov = Lutjanus novemfasciatus, Mbai = Microspathodon bairdii, Mcur = Mugil curema, Mdor = Microspathodon dorsalis, Mlen = Muraena lentiginosa, Oste = Ophioblennius steindachneri, Otyp = Oxycirrhites typus, Plat = Prionurus laticlavius, Qnot = Quassiremus notochchir, Saca = Stegastes acapulcoensis, Scru = Selar crumenophtalmus, Sfla = Stegastes flavilatus, Slac = Synodus lacertinus, Srec = Stegastes rectifraenum, Ssub = Sargocentron suborbitalis, Sver = Suflamen verres, Tluc = Thalassoma lucasanum, Trod = Trachinotus rodopus, Ucon = Urobatis concentricus, Urog = Urotrygon rogersi, Zcor = Zanclus cornutus
Figure 6. Canonical correspondence analysis showing the species distribution per site and their relationship with habitat characteristics in transects (T) sampled in Maguey Bay during the 2005-2006 cycle. WE = wave exposure. T1 = rocky habitat, T2 = rocky-coral habitat, T3 = coral-rocky habitat, T4 and T5 = sandy habitats, T6 = mixed habitat, T7 = coral habitat, T8 = coral-rocky habitat, T9 = rocky-coral habitat.
Discussion
Maguey Bay has been considered one of the most important bays in the Huatulco Bay complex because of the diversity of coral and fish in it (López-Pérez et al. 2010; Juárez-Hernández and Tapia-García 2017, 2018a). The present study confirms this, having identified a total of 60 fish species. Initially 61 species were considered, as Prionurus punctatus was included; however, the count was reduced to 60 species because according to Ludt et al. (2019), P. punctatus is a junior synonym of P. laticlavius. The number of species identified in the present study represents over 35% of the composition of ichthyofauna in the Huatulco Bays complex (Juárez-Hernández and Tapia-García 2018a). The comparison of the expected richness value (Chao 1) and the number of recorded species indicated that this study included 93.75% of the global richness that has been estimated for this bay, which is considered a satisfactory percentage.
Of the 60 fish species found in this study, 59 have been previously reported in the study area (Ramírez-Gutiérrez et al. 2007; López-Pérez et al. 2010; Juárez-Hernández et al. 2013; Ramos-Santiago and Tapia-García 2017; Juárez-Hernández and Tapia-García 2017, 2018a), and Cathorops dasycephalus had not been previously reported. According to Robertson and Allen (2015), Cathorops dasycephalus is distributed from the Gulf of California to Ecuador and is known to be part of the Oaxaca ichthyofauna (del Moral-Flores et al. 2017) and to be characteristic of sandy bottoms (Robertson and Allen 2015, Froese and Pauly 2019). Our study also recorded the presence of Cathorops dasycephalus in the sandy environment (T5).
With regard to the dominant families and species in our study, the findings are consistent with what has been reported for this locality (Juárez-Hernández et al. 2013), adjacent bays (Ramírez-Gutiérrez et al. 2007; López-Pérez et al. 2010, 2012; Ramos-Santiago and Tapia-García 2017; Juárez-Hernández and Tapia-García 2017, 2018a), and other regions on the Pacific coasts of Central Mexico (Chávez-Comparán et al. 2010; Galván-Villa et al. 2011, 2016) and Central America (Dominici-Arosemena and Wolff 2006, Benfield et al. 2008, Myers et al. 2011). Selar crumenophthalmus and Harengula thrissina were not considered to be dominant because of their limited temporal and spatial representation.
A relevant aspect worth mentioning is the similarity between the number of species identified in Maguey Bay and the number of species found in larger regions having more coral coverage (e.g., San Agustin and La Entrega; López-Pérez et al. 2010, Juárez-Hernández and Tapia-García 2017). This is primarily attributed to the patchy distribution of the coral coverage (Juárez-Hernández and Tapia-García 2017), which creates complex three-dimensional areas (Acosta and Robertson 2002; Gratwicke and Speight 2005a, b; Tokeshi and Arakaki 2012), and to the richness of coral species, which is one of the highest in Huatulco Bays (Juárez-Hernández and Tapia-García 2017). In this regard, Álvarez-Filip et al. (2011) noted the relationship between the number of coral species and topographical complexity, where a larger number of coral species increases the topographic complexity, thereby increasing rugosity.
Temporal differences were found in abundance but not in composition, structure, number of species, or diversity. This is primarily attributed to the scarce representation of sampled months in the dry season and secondarily to the low variability in the number of species and the continuous representation of dominant species (S. acapulcoensis, T. lucasanum, and M. dorsalis). The latter is consistent with reports by Juárez-Hernández et al. (2013) and Ramírez-Gutiérrez et al. (2007). The greater abundance in the dry season (January) and the larger number of species and diversity in the rainy season (July and September) are in concordance with other studies (Ramírez-Gutiérrez et al. 2007, López-Pérez et al. 2012, Juárez-Hernández et al. 2013, Ramos-Santiago and Tapia-García 2017). Regarding maximum abundance, this was the result of an increase in the abundance of resident species (C. atrilobata and T. lucasanum) and the migration of species considered to be cyclic visitors (S. crumenophthalmus and Harengula thrissina) (López-Pérez et al. 2012, Juárez-Hernández and Tapia-García 2017), which was favored by the increased plankton production driven by the effect of the “Tehuano” winds that transport nutrient-rich water to the region (Monreal-Gómez and Salas de León 1998). Regarding maximum species richness and diversity, both were likely the result of high temperatures and large production due to regional coastal processes that increased the availability of resources (Lluch-Cota et al. 1997, Lara-Lara et al. 1998). Ramos-Santiago and Tapia-García (2017) have reported a positive relation between species richness and temperature.
One variation in the identified abundance pattern is that the second highest value occurred during the rainy season (in May 2005), because of an increase in the abundance of resident species (C. atrilobata and T. lucasanum) and the presence and abundance of species considered cyclic visitors (S. crumenophthalmus and Harengula thrissina). This is different from the findings by Ramírez-Gutiérrez et al. (2007) and Ramos-Santiago and Tapia-García (2017), who indicated that an increase in the abundance of resident species and the presence of cyclic visitor species were characteristic of the dry season (November to April). Rodríguez-Sánchez (2006) reported a prolonged effect of the gulf surge during the 2005 dry season, with the final effects being observed as late as May of that year. A factor that supports this statement is that a prolonged surge effect was not observed in May 2006 (Rodríguez-Sánchez 2006), when the abundance of C. atrilobata, T. lucasanum, and S. crumenophthalmus decreased and Harengula thrissina was not found.
The lowest species richness and diversity occurred during the dry season (January and February), a finding also reported by Juárez-Hernández et al. (2013) for this area and by other studies in the region (Ramírez-Gutiérrez et al. 2007, Ramos-Santiago and Tapia-García 2017). Ramírez-Gutiérrez et al. (2007) indicated that the decreased number of species and diversity during the dry season was due to low temperatures and the migration of species from gregarious habitats (i.e., S. crumenophthalmus), which can affect abundance and the presence of resident ichthyofauna because of intense competition for resources.
Spatial differences were detected in the community parameters and in the composition and structure of the fish community. According to the different analyses carried out, these differences were primarily attributed to sandy habitats, where abundance, number of species, and diversity were lowest, as was previously found (Juárez-Hernández et al. 2013). These habitats are characterized by the lack of rugosity and shallow depths, resulting in homogeneous habitats that attract fewer fish species because they provide little variety in refuge and fewer resources (Giakoumi and Kokkoris 2013).
Abundance was found to be related to habitat characteristics (rugosity, diversity of substrate, depth, and proportion of coral and rocky substrates). The largest abundance was found in the rocky-coral habitat (T9), where the highest degree of wave exposure and deepest depth were found. Rugosity has been considered the most important factor explaining species abundance (Gratwicke and Speight 2005a, Messmer et al. 2011, Mazzuco et al. 2020). Two species (C. atrilobata and P. laticlavius) were primarily responsible for the greater abundance in this habitat (T9). In particular, as a daytime planktivore, C. atrilobata is known to prefer areas with more wave exposure (Hobson 1991), and our correlation analysis confirmed this, as T9 has this characteristic. The distribution pattern we found for this species was consistent with reports by Ramírez-Gutiérrez et al. (2007) and Galván-Villa et al. (2010). Many authors have indicated that both wave exposure and depth affect composition and structure (Garpe and Öhman 2003, Nanami et al. 2005, Samoilys et al. 2018). Both characteristics were also found to affect the abundance of certain species (H. passer, K. elegans, L. novemfasciatus, P. laticlavius, Suflamen verres, Haemulon sexfaciatum, K. vaigiensis, and M. bairdii). In this regard, Thomson et al. (2000) reported that the distribution pattern for P. laticlavius was influenced by depth and wave exposure, while Floeter et al. (2007) and Oakley-Cogan (2020) associated species of the family Kiphosidae (K. vaigiensis and K. elegans) with habitats that had more wave exposure. The relationship between these species and the above-mentioned habitat characteristics was confirmed by the correlation analysis and the canonical correspondence analysis in the present study.
The number of species was associated with coral coverage, depth, diversity of substrate, and wave exposure. A larger number of species was found in the coral habitat (T7), as was also shown by Juárez-Hernández et al. (2013). Several studies have indicated that coral coverage has a large effect on species richness and diversity (Garpe and Öhman 2003, Komyakova et al. 2013), since it provides sites for foraging, spawning, and nesting, as well as providing abundant refuge for fish (Munday 2000, Nanami et al. 2005, Almany 2004). This habitat was found to have a large degree of live coral coverage with little signs of alterations or disturbances. Nevertheless, Juárez-Hernández and Tapia-García (2018b) reported that this habitat was one of the most impacted by the entrance of sediments from coastal development projects in 2009, resulting in coral mortality of over 95%. They also observed a decrease in the abundance, richness, and diversity of fish, particularly in the abundance of P. laticlavius, Cirrhitichthys oxycephalus, M. dorsalis, and S. acapulcoensis, which in this study had the largest spatiotemporal abundance (Figs. 4, 5).
The greatest diversity (Hʹn, α) was identified for mixed habitats (T6, T2, and T3), which were characterized by the combination of more than 2 types of substrate (rock, coral, and sand). This was consistent with the correlation analysis, which indicated that diversity of substrate was the most influential characteristic. This relationship is explained by the fact that combined substrates make more heterogeneous structures with more diverse microhabitats, resulting in more shelter areas and food and allowing for the coexistence of fish that are characteristic of each substrate (Acosta and Robertson 2002; Gratwicke and Speight 2005a, b; Harborne et al. 2011; Tokeshi and Arakaki 2012; Juárez-Hernández et al. 2013; Ferrari et al. 2018), thereby influencing fish diversity (Levin et al. 2000, Nanami and Nishihira 2002, Mazzuco et al. 2020).
The abundance of fish species and the community parameters evaluated in the present study were influenced by a set of habitat characteristics (diversity of substrate, coral coverage, rocky coverage, rugosity, depth, and wave exposure). The combination of these characteristics resulted in highly complex habitats (Gratwicke and Speight 2005a, b; Tokeshi and Arakaki 2012; Ferrari et al. 2018; Samoilys et al. 2018; Mazzuco et al. 2020) that supported a larger number of individuals and species (Acosta and Robertson 2002, Almany 2004, Lingo and Szedlmayer 2006, Graham and Nash 2013).
Coral reefs are considered the most vulnerable ecosystems, because of ongoing and growing degradation due to natural and anthropocentric causes (Munday 2004, Bridge et al. 2013, Hughes et al. 2018a). Therefore, biodiversity assessments and knowledge of the processes that influence the composition and structure of their communities are key to the development and implementation of relevant and successful management and conservation strategies (Harborne et al. 2011, Perrings et al. 2011, López-Pérez et al. 2012, Lubchenco and Grorud-Colvert 2015). The information provided in the present study contributes to knowledge about regional ichthyofauna, and having used data taken before disturbances occurred in the study area, it should be helpful for analyzing the magnitude and direction of changes in the fish community.

