


 texto en
  Inglés (pdf)
 Artículo en XML
 Referencias del artículo
 Enviar artículo por email
 Citado por SciELO
  Similares en
SciELO
Similares en
SciELO 
 Permalink
Introduction
The red octopus (Octopus maya) is an endemic benthic species caught along the coasts of the states of Campeche, Yucatan, and Quintana Roo (DOF 2014) as part of the octopus fishery in Mexico. This fishery targets red octopus and common octopus (Octopus vulgaris). It generates around 15,000 direct jobs and an annual economic profit of Mex$360 million, considering the export of more than 80% of total octopus catch to the European and Japanese markets (Juárez et al. 2010). The octopus fishery has become one of the main economic activities in Campeche and Yucatan. Regarding catch magnitude, this fishery occupies 12th place at the national level. In the Gulf of Mexico, it is the 4th most important fishery, and from the economic point of view, it is the 3rd most important in the country, only behind the tuna and shrimp fisheries (SEMARNAP 2001).
The Mexican octopus fishery is made up of 3 fleets. Two of these fleets, one in Campeche and the other in Yucatan, are artisanal fleets (small boats measuring 5.5-9.0 m long) that operate in shallow waters, and the third is a fleet of mid-sized ships (12.0-22.0 m long) that operates in deep waters and targets both red octopus and common octopus. In the artisanal fleet, small boats function as mother ships carrying 1 or 2 smaller boats (3.0 m long) called “alijos.” The mid-sized ships in the fleet operating in deep waters carry on board between 7 and 9 alijos and between 10 and 12 people, including a crew of 3 sailors and 1 fisherman per alijo (SEMARNAP 2001). Fishing effort in the octopus fishery is not systematically reported, but sporadic data are available. According to the Octopus Fishery Management Plan, in 2006 there were 3,676 small boats in Yucatan; in 2007 the number increased to 5,610 fishing boats (DOF 2014). In Campeche there were 1,591 small fishing boats in 2008 (DOF 2014). The Mexican National Fisheries Chart (Carta Nacional Pesquera) reported 5,290 small fishing boats in 2004 (3 states) (DOF 2004) and 5,444 small fishing boats in 2014 (DOF 2018).
All 3 fishing fleets operate during the day, adrift, with a fishing gear locally known as “jimba,” which consists of a 5-m rod with 6 lines, with live crab as bait (Arreguín-Sánchez et al. 2000). The 2 artisanal fleets catch about 80% of total red octopus annual landings. In the case of the fleet of mid-sized boats, red octopus makes up 70% to 80% of its landings. Regarding catch records, according to the Mexican Official Standard NOM-008-SAG/PESC-2015 (DOF 2016), fishermen must register catches in fishing logbooks that must be delivered monthly to the regional fishing offices (fishing subdelegation and fishing offices), where the data is processed and reported.
The Mexican Official Standards NOM-008-SAG/PESC-2015 (DOF 2016) and NOM-009-PESC-1993 (DOF 1993) regulate the octopus fishery. The former establishes minimum mantle size (110 mm) and the latter defines season closure (16 December to 31 July). Since 2002, managers have established an annual quota based on annual biomass estimates; it is worth noting that this fishery is one of the few that are regulated by quotas in Mexico. To estimate octopus biomass, the Mexican National Institute for Fisheries and Aquaculture (INAPESCA, for its acronym in Spanish; formerly known as Instituto Nacional de la Pesca, INP) carries out sampling campaigns from May to July in a 5,200-km2 area that is divided into 5 strata: Champotón-Seybaplaya, Campeche-Tenabo, isla Arenas-Celestún, Telchac-Dzilam, and Río Lagartos-El Cuyo (INP 2002). INAPESCA uses the biomass estimates, catch data, effort, Schaefer model, and maximum likelihood estimation (MLE) approach to estimate the maximum sustainable yield, which is used to determine the annual quota, maintain the same biomass levels, and ensure the sustainability of the fishing resource (Fig. 1) (INP 2002, 2004, 2007; INAPESCA 2008, 2013).
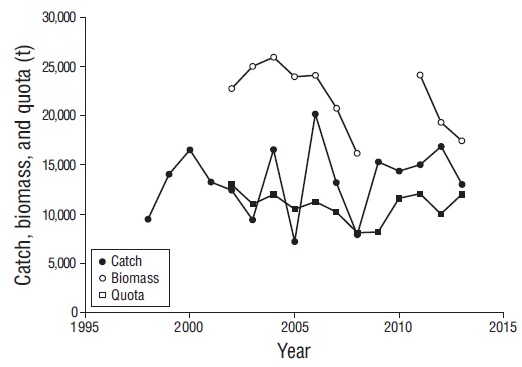
Figure 1 Temporal trend of estimated biomass, proposed annual quota, and annual catch (tons) for the red octopus on the Yucatan Peninsula. Catch and quota data taken from INP (2002-2007) and INAPESCA (2008, 2011-2014).
The Octopus Fishery Management Plan went into force on 28 February 2014, and it establishes sociopolitical, general management, economic, and product quality objectives (DOF 2014). It also establishes strategies and management measures (minimum size, fishing closures, and quota) and suggests indicators and reference points for management. Although fisheries management authorities dedicate a great deal of effort to the management of the octopus fishery, they do not incorporate economic aspects. The gray literature includes 2 publications on the economics of this fishery. In one of these two, Gómez (2016) compared the technical and economic aspects of the Chilean and the Mexican octopus fisheries and concluded that productivity was higher in Chile but production in Mexico exceeded Chilean catches by more than 80%, implying that the net present value and return rate were higher for Mexico. In the other, Consultores en Ecosistemas (2009) developed the “Master program for octopus in the state of Yucatan,” which included an analysis of several economic aspects, such as product presentation, price, costs, storage capacity, safety, and quality certifications. In the present study, we develop 2 bioeconomic models (deterministic and stochastic) to estimate the maximum sustainable income (π), the maximum sustainable profit (β), and the fishing effort for the economic equilibrium point (a). In the stochastic model we include the uncertainty for the r and K parameters to make simulations with Bayesian methods in order to estimate the posterior distribution of r, K, π, β, α and their corresponding fishing effort. This approach allows the exploration of some economic implications in the management of this fishery resource.
Materials and methods
We modeled the red octopus population dynamics with 3 different expressions. In the first we used the Schaefer model (Schaefer 1954):
where B t is biomass in year t, r is the intrinsic growth rate, K is the carrying capacity, and C t is the annual catch. For the second, we used the modified Fox model (Fox 1970, Haddon 2001):
The third model we used was the Pella-Tomlinson model (Pella and Tomlinson 1969):
where p is an asymmetry term. We assumed that the 1998 initial population, B 0 , was a percentage of K. Model fitting assumed observation error in log-normally distributed annual abundance index estimates, I obs,t (Hilborn and Mangel 1997):
where LL is the negative log likelihood, σ is the standard error associated with the estimation of the abundance index, and I est,t is the estimated abundance index. The total negative log-likelihood is the sum of the n components. I obs,t was sampled during the middle of the year; therefore, we estimated I est,t as follows:
We used landings from 1998 to 2013 (INAPESCA 2013, 2014; DOF 2014). We also used the abundance index estimates reported by INP (2002-2007) and INAPESCA (2008, 2011-2013). We used the subroutine “optim” in the R statistical package to fit the model. Estimated parameters included r, K, B 0 , p, q, σ, and their standard errors. We used the Akaike information criterion (AIC) (Akaike 1973) for model selection:
where L max is the maximum likelihood value and P is the number of parameters in the model.
Once we determined the best model, we used the deterministic Gordon-Schaefer bioeconomic equilibrium model, which states that the net sustainable profit (Π) depends on the difference between total sustainable income (TSI) and total cost (TC):
where the TSI depends on fishing effort (f):
where C eq is the equilibrium catch, P* is the retail price per ton, and q* is the fishery catchability. TC is a linear function of f:
where C ship is the cost per boat per season. We conducted a total of 10 surveys with fishermen from the artisanal fleet in the states of Yucatan (4 surveys) and Campeche (6 surveys) and used that data (ice, bait, oil, gasoline, jimba, boat maintenance, permits, collection center, and sale price) to estimate C ship and P*. It is worth noting that the low number of surveys is due to the difficulty fishermen have disclosing economic information they consider private. According to the interviewed fishermen, there is no difference in the sale price of red and common octopuses. This result agrees with the opinion of Consultores en Ecosistemas (2009).
We used 3 reference points: π, β, and α. The fishing effort for a (f α ) is given by:
The fishing effort for maximum sustainable income (f π ) was estimated by maximizing Equation 8:
The fishing effort for maximum sustainable profit (f β ) requires maximizing Equation 7:
We set up the deterministic Gordon-Schaefer model in Microsoft Excel using the MLEs for r, K, q*, the value of C ship , and the value of P* for the red octopus.
We did not include the uncertainty for P* and C ship . Instead, we carried out a sensitivity analysis for the deterministic bioeconomic model, where we perturbed these 2 predictors by ±10%. Following the methodology of the International Council for the Exploration of the Sea Multispecies Group (Report...c1991, Jurado-Molina et al. 2004), a response variable was considered not sensitive to a 10% perturbation if the produced effect was smaller than 3%. The scenarios are shown in Table 1. The relative percent changes of π, β, f α , and f β were selected as response variables.
Table 1 Scenarios for the sensitivity analysis with the Gordon-Schaefer deterministic model for the red octopus fishery on the Yucatan Peninsula.
| Disruption to the retail price per ton | Disruption in the cost per boat per season | Percentage change in fα | Percentage change in fβ | Percentage change in π | Percentage change in β |
| 10% | 0% | –4.3 | –4.3 | –10.0 | –19.7 |
| –10% | 0% | 5.3 | 5.3 | 10.0 | 19.3 |
| 0% | 10% | 4.8 | 4.8 | 0.0 | 9.3 |
| 0% | –10% | –4.8 | –4.8 | 0.0 | –9.8 |
| 10% | 10% | 0.0 | 0.0 | –10.0 | –10.0 |
| 10% | –10% | –8.7 | –8.7 | –10.0 | –29.9 |
| –10% | 10% | 10.6 | 10.6 | 10.0 | 28.0 |
| –10% | –10% | 0.0 | 0.0 | 10.0 | 10.0 |
We set up a stochastic model based on Equations 7-10. We used the Markov chain Monte Carlo approach assuming a normal distribution for the K and r parameters and using the MLE estimates and their standard errors. We estimated the posterior distribution, Pr{H i |data}, for β, π and their efforts following Hilborn and Mangel (1997):
where L is the data likelihood given the hypothesis and Prior is the prior probability distribution of each hypothesis (parameter values) summarizing previous knowledge. We assumed fixed values for q, C ship , and the retail price. Due to the lack of prior information on r and K for the red octopus, we decided to use non-informative uniform distributions for those parameters. We assumed r ~ U(0.8, 1.47) and K ~ U(35,000, 60,000). Random values from the K and r uniform distributions were plugged into Equations 7, 8, and 11-13 to estimate the posterior distribution for the r and K parameters and the bioeconomic indicators β, π, f α , f β , and f π . Posterior probability distributions of parameters and economic indices were estimated using Markov chain Monte Carlo simulations. We did a total of 1 million runs using Excel-Visual Basic with a “burn-in” of 2,000 parameter vectors.
Results
All models fit the INP/INAPESCA observed abundance index well (Fig. 2). The estimated parameters and their uncertainties are shown in Table 2. The estimated K had the same order of magnitude in all models. A similar scenario resulted for q and σ. The highest r corresponded to the Pella-Tomlinson model, while the smallest r corresponded to the Fox model. The results suggest that red octopus biomass in 1998 was above 50% of the carrying capacity (Table 2). We selected the Schaefer model considering the AIC (Table 2).

Figure 2 Model fitting to the INAPESCA observed abundance index for the red octopus on Yucatan, Mexico. Obs, observed biomass index data.
Table 2 Maximum likelihood estimates of the model parameters (± SE) for the red octopus population dynamics on the Yucatan Peninsula, Mexico. K, carrying capacity; r, growth rate; %K, initial biomass in the year 1998; q, catchability coefficient; σ, standard error; p, asymmetry term for the Pella-Tomlinson model; AIC, Akaike information criterion for model selection.
| Parameter | Schaefer | Fox | Pella–Tomlinson |
| K | 47,282 ± 6,228 | 49,595 ± 4,892 | 47,435 ± 7,538 |
| r | 1.14 ± 0.17 | 0.77 ± 0.09 | 1.61 ± 1.24 |
| %K | 0.71 ± 0.22 | 0.62 ± 0.16 | 0.88 ± 0.69 |
| q | 0.85 ± 0.11 | 0.92 ± 0.09 | 0.76 ± 0.13 |
| s | 0.03 ± 0.01 | 0.03 ± 0.01 | 0.03 ± 0.01 |
| p | _ | _ | 2.51 ± 3.49 |
| AIC | –24.44 | –23.80 | –21.72 |
Regarding the bioeconomic model, the results from the interviews suggest that the average daily cost during the 2017 fishing season was Mex$1,099.00, and the season cost (137 d) was $150,562.67. The average value for a ton of octopus was $63,333.33. The estimated q* for the fleet was 1.56 × 10⁻⁴. The deterministic Gordon-Schaefer model indicated that π was $851.70 million (f = 3,650 fishing boats), β was $390.80 million (f = 2,472 fishing boats), and f α was 4,945 fishing boats (Fig. 3).

Figure 3 Deterministic bioeconomic model (Gordon-Schaefer) for the red octopus fishery on the Yucatan Peninsula.
With respect to the sensitivity analysis for the deterministic model, f α and f β were sensitive to perturbations on C ship and P*. The maximum relative percent change for both response variables was 10.6% and the minimum was 0.0%; most of the values were greater than 3.0% (Table 1). The π variable depends directly on P*, so any perturbation on the retail price affects the response variable. Furthermore, β was sensitive to perturbations; the minimum percent change was 9.3% and the maximum was 29.9% (Table 1).
Regarding the stochastic model, no coincidence between the priors and the posteriors of r and K could be observed (Fig. 4); their modes were 1.35 and 47,000 t, respectively. These values agree with previous MLEs. The π posterior distribution had an average of $856.80 million (SE 2.10); its mode was $850.90 million and the 95% probability interval ranged from $831.70 to $883.40 million. The probability that π was between $840 and $880 million was 0.81 (Fig. 5). The f π distribution had a mean of 3,462.20 fishing boats (SE 12.30) and a mode of 3,428.50 fishing boats (Fig. 6).
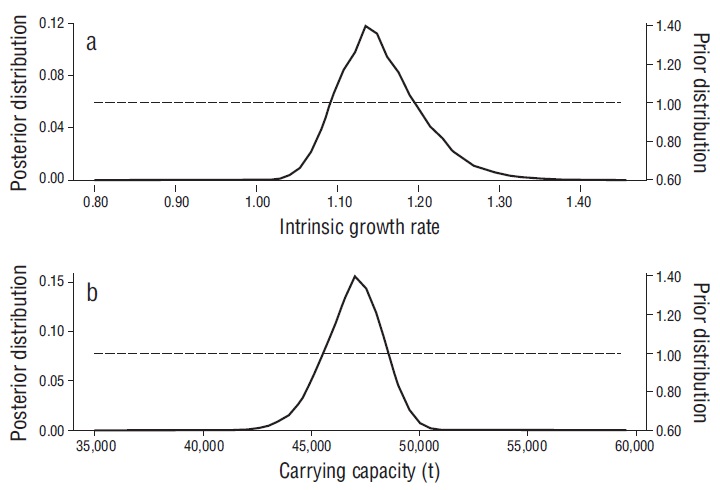
Figure 4 Posterior distribution of the intrinsic growth rate (a) and the carrying capacity (b) with the Schaefer model.

Figure 5 Posterior cumulative distribution of the maximum sustainable income for the red octopus fishery on the Yucatan Peninsula.

Figure 6 Posterior distribution of the fishing effort corresponding to the maximum sustainable income for the red octopus fishery on the Yucatan Peninsula.
The β distribution had an average of $389.80 million (SE 0.75) and a mode of $389.90 million. The cumulative distribution (Fig. 7) suggests that the 95% probability interval ranged from $378.60 to $397.80 million). Furthermore, the probability that β was between $380.00 and $400.00 million was 0.94. The f β distribution had a mean of 2,577.20 fishing boats (SE 3.50) and a mode of 2,571.40 fishing boats.
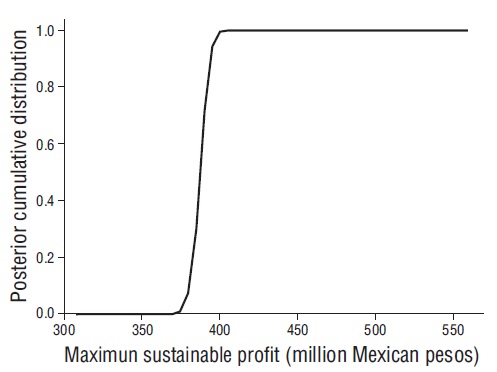
Figure 7 Posterior cumulative distribution of the maximum sustainable profit for the red octopus fishery on the Yucatan Peninsula.
The f α distribution had a mean of 4,995.80 fishing boats (SE 1,760.50) and a mode of 4,935.00 fishing boats. The f α cumulative frequency suggests that the 95% probability interval ranged between 4,708.00 and 5,336.00 fishing boats. The probability of f α being between 4,700.00 and 5,200.00 fishing boats was 0.92, and the probability of it being between 4,800.00 and 5,100.00 fishing boats was 0.72.
Discussion
Fisheries management traditionally uses single-species models. However, a fishery is an economic activity, so managers must incorporate economic factors and objectives into their fishery resource regulations. For example, Timmermann et al. (2014) developed a bioeconomic model to explore the consequences of nutrient load reductions for a mussel fishery and evaluate potential management options that would make the fishery economically and ecologically sustainable. Larkin et al. (2011) proposed and discussed the use of bioeconomic models in fisheries management to develop rebuilding strategies for fisheries and stocks. In the present study, we explored some economic aspects of the red octopus fishery.
The estimated red octopus biomass showed a decreasing trend. In 2013 biomass was 49.9% of the carrying capacity. This decreasing trend might be the result of high catches. For several years catches were greater than 50.0% of the estimated biomass; for example, 63.7% of the stock was taken in 2004 and 83.5% of the stock, in 2006. Our results suggest that additional measures should be implemented to decrease f and stop the current decreasing biomass trend.
When analyzing the economic aspects, our estimates of daily cost agree with information reported by Consultores en Ecosistemas (2009). On the other hand, the price of red octopus per ton varies greatly within the season and between seasons (Consultores en Ecosistemas 2009). Our sensitivity analysis indicated that π and β were sensitive; therefore, improvements to the present study should take this aspect into account. Furthermore, red octopus catches vary significantly, so it is necessary to analyze how catch variation affects price given low offer and high demand and to incorporate this information into the bioeconomic model.
The results from the bioeconomic models suggest that is in the same order of magnitude as the values reported by the Mexican National Commission on Aquaculture and Fisheries (CONAPESCA, for its acronym in Spanish) (CONAPESCA 2015). Likewise, is in the same order of magnitude as the values reported for the annual income (Juárez et al. 2010). It is important to mention that f β and f π are smaller than the number of boats currently operating in the fishery. Furthermore, since 2012 permits have been available for 5,444 artisanal boats operating in the fishery (INAPESCA 2012; DOF 2014, 2018), a number that surpasses the estimated mode for f α , suggesting that the fishery might be operating at a loss. However, the actual f value for each season is unknown. Management improvement in the red octopus fishery would require estimating f in terms of fishing trip per alijo or the number of jimbas used.
Although we cannot project our results as a true scenario because of the equilibrium assumption, we can identify general trends suggesting f should be decreased in order for the annual profit to increase and the stock status to improve. Implementing this approach would be difficult, because according to Berkes et al. (2001), fishery objectives fall into 3 groups: resource sustainability, efficiency, and equity. In this regard, the normativity for the red octopus fishery (NOM-008-SAG/PESC-2015, DOF 2016) does not include economic objectives (efficiency or equity) and nor does the National Fisheries Chart (DOF 2018).
The Octopus Fishery Management Plan (DOF 2014) focuses on the sustainability of octopus fishing in the Gulf of Mexico and the Caribbean Sea. It also targets 2 points that could be considered general equity objectives: the profitability and economic benefits for society and the good quality of fishery products. Establishing efficiency objectives such as maximizing profit will probably face resistance from some fishermen and managers and will require wide consensus among stakeholders.
Under an open-access regime, there is no restriction on the entry to or exit from a fishery, and f can thus expand to the point where natural resource rents could be reduced to zero. On the other hand, with optimal management, fishery economic returns could be maximized. In between, there are various mixed regimes, such as regulated open access (Homans and Wilen 1997). Currently, some regulations have been set on the octopus fishery to protect species reproduction (minimum size and closing seasons) and control effort (fishing permits). Although there is a quota, the annual catch exceeds it most of the time because f and catches increase until the season is over (Jurado-Molina 2010). To our knowledge, there is no harvest control rule triggering fishing season closure when the fishery reaches the quota or limit reference point. This is a central aspect in the potential certification process for this fishery, and the lack of a harvest control rule could mean an impediment to certification approval. Developing a monitoring program that provides catch data in real time and allows the closure of the fishing season once the annual quota is reached could improve the management of the fishery. That real-time catch data could also be useful in establishing a harvest control rule. In Mexico this type of monitoring program has been implemented for the croaker fishery in the northern Gulf of California (IAES 2014), so managers could adopt this approach for the octopus fishery. Management of the fishery could also improve by assigning individual quotas that would help achieve optimal allocation of the resource (Schmid 1978). Under this scenario, the rights would be completely specified and effectively monitored. This approach has been successful in the loco fishery in Chile (Hilborn and Hilborn 2012) and would help establish efficiency objectives such as maximizing profit.
Regarding model improvements, management should take into account 5 sources of uncertainty (Francis and Shotton 1997), namely process uncertainty, observation uncertainty, model uncertainty, error structure uncertainty, and implementation uncertainty. According to Nøstbakken and Conrad (2007), most bioeconomic studies focus on the first 2 types of uncertainty. In our work, we added model uncertainty. The main flaw in our analysis is the equilibrium assumption. Although this assumption facilitates calculation and analysis, populations are not at equilibrium. According to Haddon (2001), fisheries assessments should avoid equilibrium methods. When using surplus-production models, if a fish stock is declining, equilibrium methods persistently overestimate sustainable yield. The bioeconomic models developed in our work could have a similar effect. The approach taken in our work can be used to establish some key reference points and it is a first step in developing a more complex dynamic bioeconomic model that does not assume equilibrium. Such a model could include observation error, model error, implementation error, and use of state-of-the-art technology, as well as including stock assessment and decision analysis within a Bayesian framework, as proposed by Jurado-Molina (2010). Moreover, since the equilibrium assumption will be discarded, the new approach will need to explore and adopt new reference points. This approach will allow managers to re-evaluate the fishery periodically and establish management strategies. Achieving this task will require improved economic data quality. Currently, it is difficult to gather this information; we need to work collaboratively with fishermen and institutions. We must present the results from the stock assessment and the bioeconomic models so that fishermen and managers understand the advantage of providing more accurate data to develop bioeconomic models that could help ensure the sustainable exploitation of the stock and the economic viability of the fishing fleet.

