


 texto em
  Inglês (pdf)
 Artigo em XML
 Referências do artigo
 Enviar este artigo por email
 Citado por SciELO
  Similares em
SciELO
Similares em
SciELO 
 Permalink
Introduction
Mangroves, which are found in tropical and subtropical coastlines, fulfill various ecological and socioeconomic functions, such as protecting artisanal and offshore fisheries, controlling soil erosion, acting as biological corridors, and providing optimal conditions for aquaculture activities, tourism, and ecotourism (Yáñez-Arancibia et al. 1998, CONABIO 2009, Valdez-Hernández et al. 2009, CONAFOR 2013, MARN 2013, Rodríguez-Zúñiga et al. 2013, Osorio et al. 2017, Sippo et al. 2018, Arifanti et al. 2019, Lagomasino et al. 2020). They are also important carbon reservoirs (Lovelock 2008, Nellemann et al. 2009, Bouillon 2011, Sasmito et al. 2020) because they store carbon in living biomass and, predominantly (up to 95%), in the soil, with roots functioning as biological filters (Boone-Kauffman and Donato 2012, Adame et al. 2018, Sippo et al. 2019). Mangroves, therefore, help mitigate climate change by absorbing atmospheric carbon dioxide (CO2) during photosynthesis (Zhong and Qiguo 2001, FAO 2010, Adame et al. 2018, Sasmito et al. 2020) and by releasing oxygen. However, when changes in land use occur, like deforestation, CO2 is emitted into the atmosphere because of the decomposition of organic matter, in addition to the CO2 contributions induced by high temperatures in the environment; this accelerates plant respiration (Donato et al. 2011, Troxler et al. 2015, Arellano and Andrade 2016) and contributes to climate change (Lovelock et al. 2017; Adame et al. 2018; Alongi 2018; Sippo et al. 2018, 2019; Adams and Rajkaran 2020; Sasmito et al. 2020).
Regarding mangrove coverage, 3.6 million hectares were lost worldwide between 1980 and 2005, which is equivalent to 20% of the global cover (FAO 2007, Rossi et al. 2020). Specifically, Mexico is one of the countries with the highest loss of mangrove cover, with 80,850 ha lost from 1970 to 2015; moreover, it also showed an increase in disturbed mangrove areas (corresponding to dead or regenerating mangroves), with 17,140 ha disturbed in 2015 compared with 1,192 ha in 1970 (FAO 2010, Valderrama-Landeros et al. 2017). The data are alarming since Mexico is one of the 5 countries with the largest extension of mangroves in the world with 775,555 ha (Valderrama-Landeros et al. 2017).
Marismas Nacionales is a mangrove ecosystem in Mexico that constitutes an important carbon sink and functions as a protective barrier against natural phenomena that could put the local human population at risk. In addition, Marismas Nacionales contributes to the local and regional economy in northwestern Mexico, since 32% of marine species in the Gulf of California depend on these mangroves, generating an annual average value of $37,500 US dollars per hectare of mangrove (Aburto-Oropeza et al. 2008). Specifically, mangroves in Marismas Nacionales promote the growth and development of 23 fish species, 2 crustaceans, and 2 bivalve mollusks that are economically important and, together, contribute $80 million pesos per year to the economy, which represents $6.5 million US dollars at a local level and $13.5 million US dollars at a regional level (CONANP 2016). However, the natural resources in this ecosystem have been exploited to such a degree that the National Commission for the Knowledge and Use of Biodiversity (CONABIO, for its acronym in Spanish; Mexico) has declared Marismas Nacionales a site of biological relevance and in need of ecological rehabilitation (Valdez-Hernández et al. 2009).
Acknowledging the importance of mangroves, CONABIO implemented a mangrove monitoring system with which it has generated information on the location and extension of this ecosystem in the Mexican territory over the past 40 years. However, knowledge on the factors that influence the loss, gain, or disturbance of mangrove areas and on the dynamics of land use and vegetation cover at local and regional levels is needed in order to know if the protection programs and actions carried out in recent years have favored the ecosystem and to understand which are the best rehabilitation practices for disturbed areas (Valderrama-Landeros et al. 2017).
With the foregoing, the main objective of this work is to analyze the dynamics of changes in land use and vegetation cover in the Marismas Nacionales area in the 1981-2005 and 2005-2015 periods using official CONABIO cartography and a cross-tabulation matrix, and to estimate losses, gains, net change, total change, and transitions. With these data, this study also aims to estimate the annual rate of deforestation and degradation (disturbed mangrove) for the mangrove forest, as well as estimating the CO2 emissions and absorptions produced by these forest processes, natural recovery, and reforestation using geographic information techniques and methods.
Materials and methods
Study area
Marismas Nacionales is the most extensive mangrove ecosystem in the eastern Pacific. It is inhabited by 99 endemic species and 73 threatened or endangered species and it shelters migratory birds (Cárdenas-Guzmán 2011). Located on the Pacific coast of Mexico, it has a population of 56,349 inhabitants (INEGI 2015) and a land area of 220,000 ha, which are distributed into the municipalities of Escuinapa, in the state of Sinaloa, and Acaponeta, Rosamorada, Santiago Ixcuintla, San Blas, Tecuala, and Tuxpan, in the state of Nayarit (Fig. 1). It has a predominantly warm-subhumid climate, with annual temperature rising over 22 ºC, and its main water contributions come from the Bejuco River, the Cañas River, the Acaponeta River, the Ruíz River, the San Pedro River, and the Pacific Ocean (Valdez-Hernández et al. 2009).
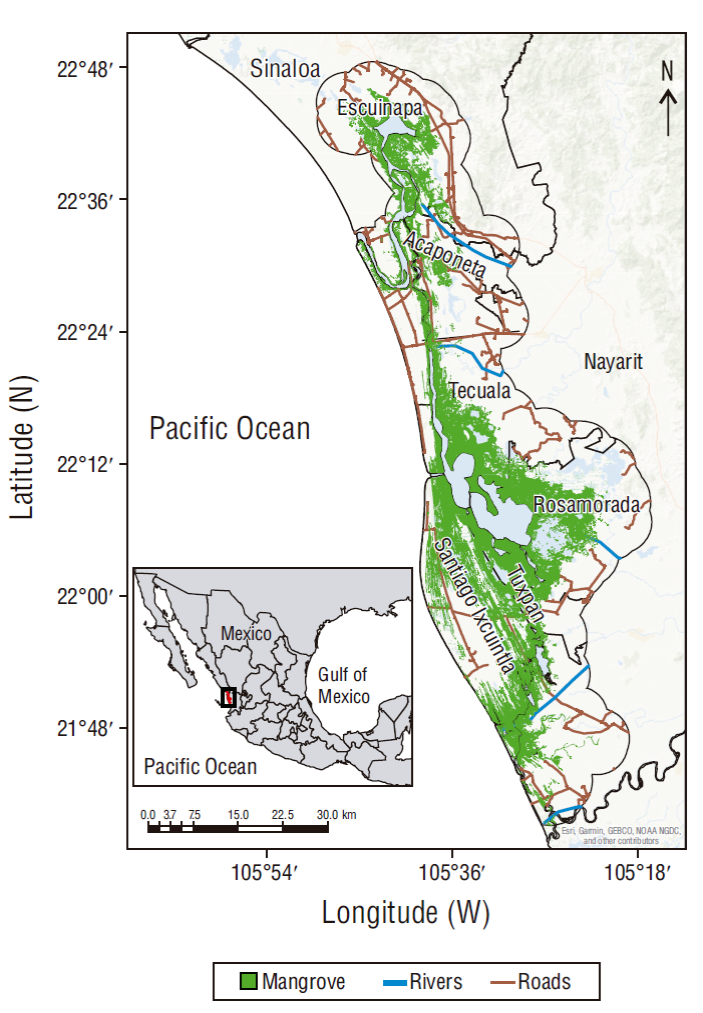
Vegetation is composed of mainly mangroves, predominantly red mangrove (Rhizophora mangle), black mangrove (Avicennia germinans), white mangrove (Laguncularia racemosa), and buttonwood mangrove (Conocarpus erectus) (Rodríguez-Zúñiga et al. 2013). These mangrove species are categorized as threatened species according to NOM-059-SEMARNAT-2010 (DOF 2010). Halophytic vegetation, tropical deciduous forest, tropical thorn deciduous forest, and medium sub-deciduous forest also coexist (Valdez-Hernández et al. 2009).
In 1995, Marismas Nacionales was identified and decreed a Ramsar site (wetland of international importance, No. 732) (CONANP-SEMARNAT 2013). In 1998 it was designated an Important Bird and Biodiversity Area and, given the various natural resources present in this ecosystem, in 2010 it was declared the Protected Natural Area Marismas Nacionales, Nayarit, Biosphere Reserve (CONANP-SEMARNAT 2013). However, marine species in this ecosystem have been used by people for both consumption and a market system built around aquaculture, while mangrove timber resources have been used to build fences and houses and as firewood (Peña-Messina 2009, Rubio-Cisneros and Aburto-Oropeza 2013). Tourism and ecotourism activities and production activities such as cattle ranching, mining, and agriculture are also carried out in this area (CONANP 2008, CONANP-SEMARNAT 2013). These dynamics led CONABIO to decree Marismas Nacionales a site of biological relevance and in need of ecological rehabilitation (Valdez-Hernández et al. 2009).
Data
To understand the dynamics of the mangrove forest, we used the land use and vegetation cartography published by CONABIO (2016), at a scale of 1:50,000, for the periods 1981-2005 and 2005-2015, which was represented in a legend of 8 categories with a degree of validity of 93% (Valderrama-Landeros et al. 2017). The maps were obtained using an interdependent classification method based on the analyzed regions: mangrove (R. mangle, L. racemosa, A. germinans, and C. erectus), disturbed mangrove (dead or regenerating mangrove), anthropic development (villages, aquaculture ponds, shrimp farms, salt mines, roads and highways, and hydraulic infrastructure works that include channels), livestock-agricultural (rainfed and irrigated agriculture, pastures for livestock activity, anthropic cover for food production, and resting agricultural areas), low and medium jungles (tropical deciduous forest, tropical thorny deciduous forest, and medium sub-deciduous forest), without vegetation (eroded areas without apparent vegetation, coastal sand dunes, and beaches), other wetlands (hydrophytic vegetation: popal, tular, reed beds, and flooded grasslands), and water (oceans, bays, estuaries, lagoons, rivers, dams, and cenotes) (CONABIO 2016).
Analysis of change in land use and vegetation cover
For the analysis of land use dynamics, we used the original cartography of land use and vegetation cover published by CONABIO (scale of 1:50,000) (CONABIO 2016). With the data from these charts, a cross-tabulation matrix was created (Pontius et al. 2004); this allowed us to calculate gains and losses in surface areas, net change, total change, exchange, and transitions between each of the categories in the assessed periods (Fig. 2). The columns of the matrix represent the area of each category for time 1 and the rows represent the area of each category for time 2. Row 6 and column 6 represent the total sum of the area of each category for the assessed periods, and the data on the diagonal formed by the matrix represent the persistence of each category between time 1 and time 2. Subsequently, from these data, the gain (G ij ), loss (L ij ), net change (D j ), exchange (S j ), and total change (DT j ) parameters were calculated as follows:
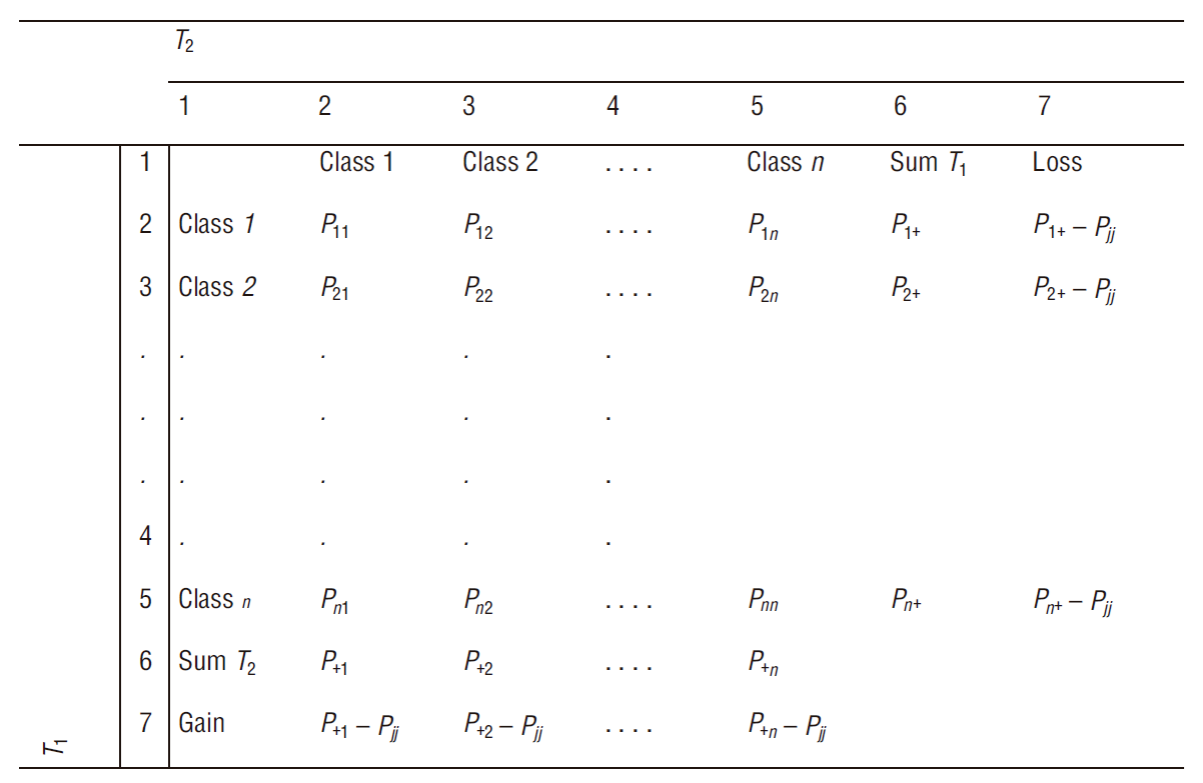
Figure 2 Change matrix. P is the value of the class obtained from the crossing of maps for the 2 evaluated dates (T1 and T2), and Pjj is the persistence of each category between T1 and T2. Source: Pontius et al. (2004).
where P +j is the sum of the column in question, P jj is the value of the main diagonal of the column in question, P j+ is the sum of the row in question, and 2xMIN is twice the minimum value of gains or losses (Pontius et al. 2004).
Change rates
Once total surface areas and changes in each category were obtained for the study periods, the annual change rate was estimated using the equation proposed by FAO (1996), which shows the annual change in mangrove cover at the beginning of each year and is expressed as follows:
where r is the rate of change (multiplied by 100 to express as a percentage), A 1 is the surface area on date 1, D j is the net change, and t is the number of years between the 2 dates. This equation is the most widely used to calculate annual changes in forest area. Although there are other equations for calculating this change (e.g., Sader and Joyce 1988, FAO 1995, Puyravaud 2003), they estimate the net change value, that is, the absolute value of the difference in surface areas between time 1 and time 2 of the assessed period. In order to assess rates from different perspectives, the loss and net change rates were calculated with the values obtained from the cross-tabulation matrix. The equation in FAO (1996) was modified for this purpose. It should be noted that the modified equation is similar to the equation for net change rate, so when estimating loss, only this value was replaced in the following equation:
where rp is the annual rate of change in loss of surface area and P corresponds to the loss in surface area between 2 dates.
CO2 emission and absorption
To analyze CO2 emissions and absorptions, land use transitions and vegetation cover were classified. Changes in vegetation were then taken as reference to estimate CO2 emissions due to deforestation and degradation (disturbed mangrove in the process of regenerating or dying), and CO2 absorption due to the natural recovery, reforestation, and permanence of mangrove, low and medium jungle, and other wetland covers; aerial and root biomass were used for this estimation.
According to the methodology agreed upon in the good practice guidance prepared by the Intergovernmental Panel on Climate Change (IPCC) for the Land Use, Land-Use Change, and Forestry (LULUCF) sector, in order to estimate CO2, the emission factor (EF) and absorption factor (AF) for the vegetation cover under study must be obtained (IPCC 2003). Therefore, we used the National Inventory of Greenhouse Gases and Compounds (INEGEI, for its acronym in Spanish; Mexico) of the LULUCF sector prepared by the National Institute of Ecology and Climate Change (INECC, for its acronym in Spanish) and the Ministry of Environment and Natural Resources (SEMARNAT, for its acronym in Spanish) with data derived from the National Forest and Soil Inventory (INFyS, for its acronym in Spanish; Mexico) (INECC-SEMARNAT 2015). INFyS adheres to the IPCC guidelines and provides information on the surface areas occupied by the different land uses and vegetation covers, as well as providing forest and tree measurement data for each vegetation. Data were obtained by INFyS from cluster samples in the field after dividing the country into 5 × 5-km quadrants. With respect to plant covers estimated in the present study, the 5 × 5-km INFyS quadrants were used for the mangrove and medium jungle categories; the 10 × 10-km quadrants were used for low jungles and other wetlands.
In total, we obtained 341 sampling points for mangrove cover, 2,302 for medium jungle, 1,518 for low jungle, and 161 for other wetlands. We used the sampling subsites and measurement transects from these sampling points to obtain the tree and forest measurements, so that, in subsites with a surface area of 400 m2, tree diameter was equal to or greater than 7.50 cm with respect to the diameter at breast height, which is approximately 1.30 m starting on the ground surface. On the other hand, in subsites measuring 12.56 m2, the frequency of plants or trees measuring at least 25.00 cm high and 7.50 cm in diameter were recorded, and the qualitative variables of natural regeneration were taken as references (CONAFOR 2012).
INECC and SEMARNAT estimated EF for vegetation covers in the country using the “stock change” method with the equation proposed in the IPCC guidelines, which measures carbon stock change (∆C) at 2 points in time as follows:
where i corresponds to the type of climate, j corresponds to the type of forest, k corresponds to land use, Ct 1 is sink carbon stock at time 1 (in tons of carbon), and Ct 2 is sink carbon stock at time 2 (in tons of carbon) (IPCC 2003). To obtain AF, INECC and SEMARNAT used the “gain/loss” method. They also estimated ∆C as a function of loss or gain rates for the area of land use with regard to the activity data (AD) as follows:
where A is the area of the land use, C i is the rate of carbon gain (in tons per year), and CL is the rate of carbon loss (in tons per year) (IPCC 2003). AD were obtained by INECC and SEMARNAT considering the changes that occurred in both plant covers and land uses from 1993 to 2011 (IPCC 2003, INECC-SEMARNAT 2015). Considering this, they produced the INEGEI with the EF and AF data for the vegetation covers in the country, which allows estimating CO2 at a local or regional level. Since AD refer to the changes in land use that occurred in a specific area during an assessed period, for the present study, AD were acquired using data produced by the cross-tabulation matrix. For the CO2 emission estimate (E), the following equation was used:
and for the absorption of CO2 (A), the following equation was used:
both being stipulated by the IPCC guidelines (IPCC 2003).
Results
Analysis of change in land use and vegetation cover
The analysis of the spatiotemporal dynamics of the 8 categories for Marismas Nacionales showed that in 1981 mangrove was the predominant cover (80,071 ha, 26.96%), followed by the livestock-agricultural land use (71,235 ha, 23.98%), other wetlands (48,901 ha, 16.46%), water (46,614 ha, 15.69%), low and medium jungles (45,822 ha, 15.43%), anthropic development (2,505 ha, 0.84%), without vegetation (1,030 ha, 0.34%), and disturbed mangrove (766 ha, 0.25%) (Table 1). However, over the years, 9,207 ha of mangrove cover were lost to deforestation, while the livestock-agricultural category increased by 17,065 ha, becoming the predominant land use in 2015 with 88,300 ha (Table 1).
Table 1 Temporal space of the evaluated categories in Marismas Nacionales, Mexico. Bold font indicates categories with most surface area changes.
| Categories | Total in 1981 (ha) | % | Total in 2005 (ha) | % | Total in 2015 (ha) | % |
| Anthropic development | 2,505 | 0.84 | 7,960 | 2.68 | 12,402 | 4.17 |
| Livestock-agricultural | 71,235 | 23.98 | 86,153 | 29.01 | 88,300 | 29.73 |
| Low and medium jungles | 45,822 | 15.43 | 35,392 | 11.91 | 30,947 | 10.42 |
| Without vegetation | 1,030 | 0.34 | 783 | 0.26 | 701 | 0.23 |
| Mangrove | 80,071 | 26.96 | 74,047 | 24.93 | 70,864 | 23.86 |
| Disturbed mangrove | 766 | 0.25 | 4,498 | 1.51 | 7,282 | 2.45 |
| Other wetlands | 48,901 | 16.46 | 44,057 | 14.83 | 38,662 | 13.01 |
| Water | 46,614 | 15.69 | 44,054 | 14.83 | 47,786 | 16.09 |
| TOTAL | 296,944 | 100 | 296,944 | 100 | 296,944 | 100 |
The categories other wetlands and low and medium jungles showed deforestation areas of 10,239 ha and 14,875 ha, respectively. Therefore, during the periods under assessment, 34,321 ha of vegetation covers were lost to deforestation; this surface area became mainly a land use given the increase of 27,291 ha. We also observed that the area for the disturbed-mangrove category (dead or regenerating mangrove) increased by 10 times, with 6,516 ha of degraded mangrove (Table 1).
When analyzing the cross-tabulation matrix to detect the changes that occurred in the first assessed period (1981-2005), we noticed the dominant persistence of land uses and vegetation covers in the landscape, since 79% (233,522 ha) of the Marismas Nacionales surface area did not experience change and only 63,422 ha experienced some form of change (Table 2). Comparing gains and losses of vegetation cover indicated higher deforestation at the end of the period due to decreases of 16.86% in mangrove, 41.45% in low and medium jungles, and 33.82% in other wetlands, compared with forestry gains of 9.34%, 18.69%, and 23.92%, respectively. Additionally, disturbed mangrove cover increased 5 times its original area (Table 2). The change indicators obtained with the data on gains and losses reflected a very dynamic period, since the exchange of vegetation cover exceeded the net change, which shows that these covers participated in almost 71% of both losses and gains in surface areas (Table 2). According to the change indicators, vegetation covers showed a low recovery process because the loss in surface area was nearly twice the gained area. In addition, the land uses that increased in surface area were livestock-agricultural, anthropic development, and disturbed mangrove, as they showed greater gains in surface area compared with losses (Table 2).
Table 2 Indicators of changes in Marismas Nacionales during the periods 1981-2005 and 2005-2015.
| Period | Categories | Losses (ha) | Gains (ha) | Net change (ha) | Total change (ha) | Exchange (ha) | Persistence (ha) |
| 1981-2005 | Anthropic development | 135 | 5,590 | 5,455 | 5,725 | 270 | 2,370 |
| Livestock-agricultural | 7,280 | 22,198 | 14,918 | 29,478 | 14,560 | 63,955 | |
| Low and medium jungle | 18,992 | 8,562 | 10,430 | 27,554 | 17,124 | 26,830 | |
| Without vegetation | 534 | 287 | 247 | 821 | 574 | 496 | |
| Mangrove | 13,503 | 7,479 | 6,024 | 20,982 | 14,958 | 66,568 | |
| Disturbed mangrove | 83 | 3,815 | 3,732 | 3,898 | 166 | 683 | |
| Other wetlands | 16,540 | 11,696 | 4,844 | 28,236 | 23,392 | 32,361 | |
| Water | 6,355 | 3,795 | 2,560 | 10,150 | 7,590 | 40,259 | |
| 2005-2015 | Anthropic development | 266 | 4,708 | 4,442 | 4,974 | 532 | 7,694 |
| Livestock-agricultural | 3,844 | 5,991 | 2,147 | 9,835 | 7,688 | 82,309 | |
| Low and medium jungles | 7,142 | 2,697 | 4,445 | 9,839 | 5,394 | 28,250 | |
| Without vegetation | 139 | 57 | 82 | 196 | 114 | 644 | |
| Mangrove | 5,872 | 2,689 | 3,183 | 8,561 | 5,378 | 68,175 | |
| Disturbed mangrove | 700 | 3,484 | 2,784 | 4,184 | 1,400 | 3,798 | |
| Other wetlands | 10,529 | 5,134 | 5,395 | 15,663 | 10,268 | 33,528 | |
| Water | 1,688 | 5,420 | 3,732 | 7,108 | 3,376 | 42,366 |
Regarding the second period under assessment (2005-2015), we observed that deforestation persisted, with 7.93% in mangroves, 8.29% in low and medium jungles, and 23.90% in other wetlands, although forestry increase was 3.63%, 3.13%, and 11.65%, respectively. Mangrove degradation was 77.77% because the surface area for disturbed mangrove cover increased (Table 2). These values indicated that this period was also very dynamic because the area exchange for vegetation covers and the livestock-agricultural land use was greater than the net change, with higher persistence in the livestock-agricultural land use, mangroves, and other wetlands (Table 2). We also determined that plant covers have a lower chance of recovering because the losses in surface area were greater than the gains. Land uses with tendency to increase were livestock-agricultural, anthropic development, and disturbed mangroves, because gains in surface area were greater than losses. On the other hand, taking land use exchange as reference, vegetation covers showed 62% in both losses and gains (Table 2).
Once the signs of change were identified, significant transitions between categories were obtained. During the 2 periods, a greater transition from mangrove to disturbed mangrove was observed, and only 238 ha showed recovery (Fig. 3). This mangrove degradation has been induced by environmental and anthropogenic factors. In particular, the hydrological changes caused by the opening of the Cuautla Canal had consequences for the Mexcaltitlán and Ticha towns in the municipality of Santiago Ixcuintla, near the core area established in the Management Plan for the Marismas Nacionales Biosphere Reserve, Nayarit, whose objective is to preserve the ecosystem in the medium and long terms (Fig. 3).
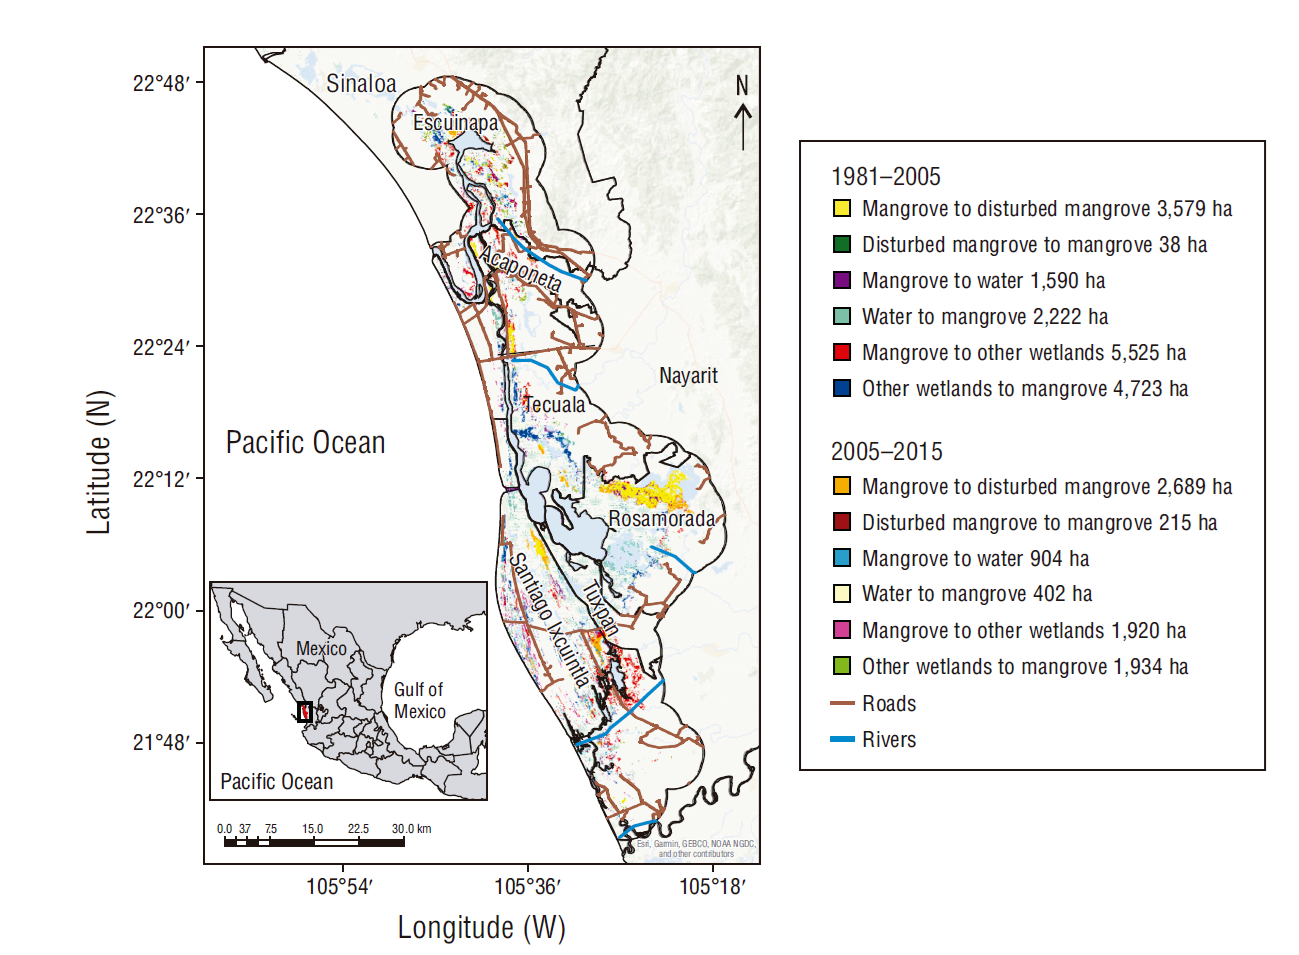
Figure 3 Transitions between the mangrove, disturbed mangrove, water, and other wetlands categories in Marismas Nacionales.
The results on transitions also indicated that the greatest change between mangroves and other wetlands occurred in mangroves, although in the second period, this surface area exchange was almost similar. This transition was also very noticeable in the town of Mexcaltitán, as it is a tourist area and it is impacted by hydrological changes. Hydrological changes were also influential in the first period, with greater transition from water to mangroves, contrary to what happened in the second period (Fig. 3).
Annual change rates
The annual net change rate was 1.07% for low and medium jungles, 0.32% for mangrove, and 0.43% for other wetlands. Had we been unable to make an in-depth analysis of these results, we would have concluded that changes in vegetation cover showed a slight modification during the 1981-2005 period. However, the conclusion was different when we calculated the loss rate for this period separately, which was 0.77% for mangrove, 2.20% for low and medium jungles, and 1.70% for other wetlands. This deforestation occurred because land uses changed, a point that cannot be observed if attention is paid only to the net change rate. However, the loss rate indicated that the surface area for land uses increased, and this is why the anthropic development and livestock-agricultural categories showed negative net change rates. Consequently, the disturbed mangrove category also showed negative data (-7.64%) as degraded area increased compared with that in 1981, and the 0.48% loss rate for this category indicates that it has little chances of regenerating or that it became another land use (Fig. 4).
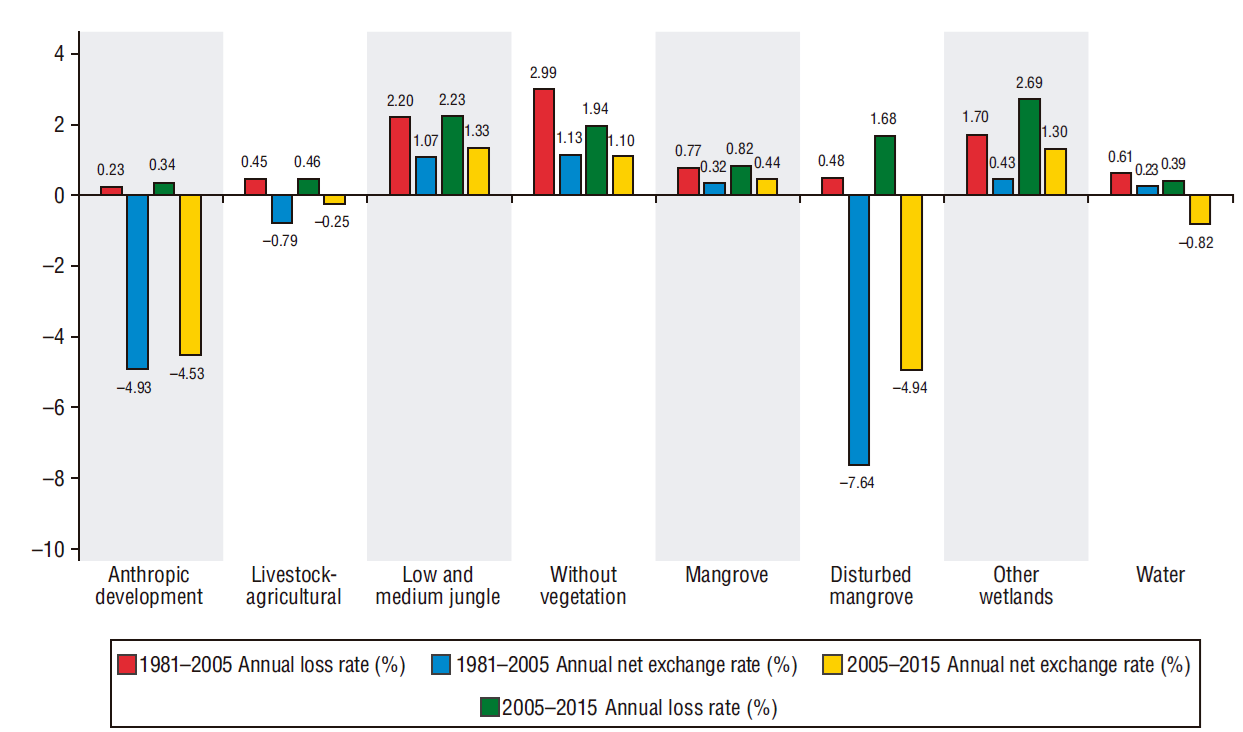
Figure 4 Annual net exchange rate and annual loss rate or deforestation of land uses and vegetation cover in Marismas Nacionales during the periods 1981-2005 and 2005-2015.
The change rates for the second assessed period (Fig. 4) were similar to those observed for the first period because the net change rate underestimated the loss rate. The net change rate was 1.33% for low and medium jungles, 0.44% for mangrove, and 1.30% for other wetlands, which are low compared with the deforestation results, which were 2.23%, 0.82%, and 2.69%, respectively. The surface area increased for the anthropic development and livestock-agricultural land uses, since the net change rate for both was negative (-4.53% and -0.25%, respectively). The disturbed mangrove cover also showed a negative net change rate (-4.94%) as its degraded area increased (1.68%).
CO2 emissions and absorptions in the mangrove forest
The CO2 emissions estimate (equivalent, CO2e) resulting from deforestation of vegetation covers during the years from 1981 to 2005 was 1,945.03 Gg of CO2e, of which 432.50 Gg of CO2e corresponded to mangrove cover mainly as a result of the transition to other wetlands and livestock-agricultural land use. Low and medium jungles emitted 1,465.48 Gg of CO2e given their transition to the livestock-agricultural land use. Other wetlands emitted 47.05 Gg of CO2e because a large portion of the area became livestock-agricultural land. In all, we found an estimate of 27.16 Gg of CO2e resulting from mangrove degradation because this cover became disturbed mangrove (Table 3).
Table 3 Emissions and absorptions of CO2 (equivalent, CO2e) in Marismas Nacionales during the periods 1981-2005 and 2005-2015.
| Period | Forest process | Vegetation | Live biomass carbon (t C) | Carbon roots (t C) | Total Carbon (t C) | Emisisions (Gg CO2e) |
| 1981-2005 | Deforestation | Mangrove | -52,182.25 | -12,559.37 | -64,741.62 | 432.500 |
| Low and medium jungles | 233,619.29 | 57,458.61 | 291,077.90 | 1,465.480 | ||
| Other wetlands | 10,216.69 | 2,617.29 | 12,833.98 | 47.058 | ||
| 2005-2015 | Mangrove | -25,964.83 | -6,249.29 | -32,214.11 | 145.210 | |
| Low and medium jungles | 83,892.78 | 20,633.41 | 104,526.19 | 383.263 | ||
| Other wetlands | 3,948.93 | 1,011.63 | 4,960.56 | 18.189 | ||
| 1981-2005 | Degradation | Mangrove | -6017.02 | -1,389.80 | -7,406.82 | 27.158 |
| 2005-2015 | Mangrove | -5,494.96 | -1,269.22 | -6,764.19 | 24.802 | |
| 1981-2005 | Natural recovery | Mangrove | 572.63 | 113.24 | 685.87 | 2.514 |
| Low and medium jungles | 1,273.94 | 291.64 | 1,565.58 | 5.740 | ||
| 2005-2015 | Mangrove | 328.76 | 65.01 | 393.77 | 1.444 | |
| Low and medium jungles | 789.05 | 180.64 | 969.69 | 3.556 | ||
| 1981-2005 | Reforestation | Mangrove | 21.31 | 4.21 | 25.52 | 0.094 |
| Low and medium jungles | 4,450.31 | 1,018.81 | 5,469.11 | 20.053 | ||
| Other wetlands | 103.68 | 24.50 | 128.18 | 0.470 | ||
| 2005-2015 | Mangrove | 13.60 | 2.70 | 16.29 | 0.059 | |
| Low and médium jungles | 1,201.33 | 275.02 | 1,476.34 | 5.413 | ||
| Other wetlands | 183.72 | 43.41 | 227.13 | 0.833 | ||
| 1981-2005 | Forest lands that remain forest | Low and medium jungles to mangrove | 268.46 | 60.99 | 329.45 | 1.208 |
| Low and medium jungles to disturbed mangrove | 1.03 | 0.23 | 1.26 | 0.005 | ||
| Mangrove to low and medium jungles | 513.86 | 119.94 | 633.80 | 2.324 | ||
| 2005-2015 | Low and medium jungles to disturbed mangrove | 7.20 | 1.64 | 8.84 | 0.032 | |
| Low and medium jungle to mangrove | 51.43 | 11.68 | 63.11 | 0.231 | ||
| Mangrove to low and medium jungles | 80.46 | 18.78 | 99.24 | 0.364 | ||
| Disturbed mangrove to low and medium jungles | 0.83 | 0.19 | 1.02 | 0.004 |
t C = tons of carbon, Gg = gigagrams
The estimated absorption for the 1981-2005 period was 28.68 Gg of CO2e, of which 2.51 Gg of CO2e corresponded to the natural recovery of mangrove and 5.74 Gg of CO2e corresponded to low and medium jungles. The highest estimate for total absorption (20.43 Gg of CO2e) was made possible because of the reforestation programs that have been carried out in Marismas Nacionales. Part of the surface area for other wetlands was replanted with mangroves and showed a value of 0.09 Gg of CO2e. The highest reforestation of low and medium jungles occurred in areas with the livestock-agricultural land-use category, with 20.05 Gg of CO2e; furthermore, part of this same land use was restored with other wetlands, with 0.47 Gg of CO2e. On the other hand, 3.54 Gg of CO2e were absorbed as a result of vegetation covers remaining forest areas; in other words, a transition occurred between the mangrove and low and medium jungle covers, but because they remained forest covers, they continued to absorb atmospheric CO2 during photosynthesis.
In the second period (2005-2015) the deforestation emission estimate was 546.66 Gg of CO2e. The mangrove category showed 145.21 Gg of CO2e because of the transition to other wetlands. Low and medium jungles showed 383.26 Gg of CO2e because of their transition to agricultural-livestock land use. Other wetlands emitted 18.19 Gg of CO2e as this cover transitioned to the anthropic development category. Emissions due to degradation were 24.80 Gg of CO2e as a result of mangrove cover being disturbed (Table 3).
For the 2005-2015 period, the estimated absorption was 11.30 Gg CO2e with the recovery of disturbed mangrove (1.44 Gg of CO2e) and low and medium jungles (3.55 Gg of CO2e). In addition, reforestation programs promoted the absorption of 6.31 Gg as follows: 0.059 Gg of CO2e from reforestation with mangroves in areas of other wetlands, 5.41 Gg of CO2e from reforestation of low and medium jungles in areas of livestock-agricultural land use, and 0.83 Gg of CO2e from reforestation with vegetation from other wetlands in areas of livestock-agricultural land use. A concurrent absorption of 0.63 Gg of CO2e was attributed to vegetation covers that remained forest areas, that, is vegetation covers that underwent a transition but continued to be vegetation, be it mangrove, low and medium jungles, or other wetlands (Table 3).
The results for CO2 emissions and absorptions indicate that CO2 emission (1,972.19 Gg of CO2e) was greater than CO2 absorption (32.22 Gg of CO2e) during the first period, with a net balance of 1,939.97 Gg of CO2e. Likewise, in the second period the emission (571.46 Gg of CO2e) was greater than the absorption (11.94 Gg of CO2e), with a net balance of 559.53 Gg of CO2e.
Discussion
The dynamics of changes in land uses and vegetation covers over the 2 periods has fragmented the habitat and put the survival of flora and fauna populations at risk, which increases risk of local extinctions in the long term (Cárdenas-Guzmán 2011). Anthropogenic factors such as aquaculture, agriculture, livestock farming, and infrastructure expansion (e.g., the construction of canals, roads, and highways) are the main causes of this fragmentation (Berlanga-Robles and Ruiz-Luna 2007, Hirales-Cota et al. 2010, MARN 2013, Rodríguez-Zúñiga et al. 2013, Vera-Andrade 2018). One factor that prompted deforestation and degradation of vegetation covers was unplanned infrastructure expansion with technical personnel that had little to no training, as evidenced by the inadequate design of aquaculture facilities in the mangrove cover, mainly in the state of Nayarit during the years 1985 to 1995 (Peña-Messina 2009).
Adame et al. (2018) indicated that on the Pacific coasts of northern and central Mexico, mangrove losses were caused by the transition to shrimp ponds, representing a loss of 80% of the total carbon reservoir. This is similar to what happened in the Mahakam Delta, Indonesia, where this type of transition caused a loss equivalent to 226 years of carbon stored in the soil (Arifanti et al. 2019). In the West Papua province, Indonesia, the transition from vegetation cover to aquaculture removed 60% of carbon stocks in soil and 85% of carbon stocks in living biomass (Sasmito et al. 2020). In the Gulf of Guayaquil, Ecuador, this transition emitted 28,059,528 Mg of CO2e (Merecí-Guamán et al. 2017). Mangrove losses also occurred on the Caribbean coast of Colombia (Torres-Salamanca and Ruíz-Vivas 2017) and in the Ecological Mangrove Reserve of Cayapas-Mataje, Ecuador (Bravo-Aguas 2018).
Infrastructure was also expanded by the construction of the road from Novillero to the Pericos fishing camp in Nayarit, which interrupted the passage of the tide to the mangrove area (Valdez-Hernández et al. 2009). In addition, the construction of canals in 1971 to facilitate fish production, such as the canal on the San Lorenzo River and, in particular, the Cuautla Canal south of Cuautla, caused hydrological changes in Agua Brava Lagoon, as the Cuautla Canal was initially 30 m wide and eroded to more than 1.5 km; currently, this lagoon continues to deteriorate, putting the surrounding population at risk (Valdez-Hernández et al. 2009). The modification of hydrological fluxes has also affected mangroves and other wetlands (De la Lanza-Espino et al. 1996, Ramirez-Zavala et al. 2012, CONANP-SEMARNAT 2013, Rubio-Cisneros and Aburto-Oropeza 2013). This impact has been more evident in the state of Nayarit, where, since 2010, the Protected Natural Area Marismas Nacionales Biosphere Reserve, Nayarit, is located (CONANP-SEMARNAT 2013).
Livestock-agricultural land use is also at the source of losses and disturbance in mangrove areas and low and medium jungles because it includes activities such as irrigated and rain-fed agriculture. These activities provide low economic contributions to the region and they are extensively carried out on a medium scale (CONANP-SEMRNAT 2013). Moreover, they use a large amount of agrochemical supplies, and agricultural runoff is discharged into estuaries, affecting mangroves and other wetlands (CONANP 2008). Livestock farming is another activity that is carried out, providing proteins for the population and economic resources (CONANP-SEMARNAT 2013).
As shown in the results, livestock-agricultural land use increased over the years. This increase was more noticeable in the Rosamorada municipality (Nayarit), particularly in the area classified as a subzone of special use in the subzoning map of the Marismas Nacionales Biosphere Reserve, Nayarit. This map indicates that activities such as aquaculture, agriculture, livestock farming, mining, forestry, scientific sampling, construction of public and private infrastructure, and low-impact tourism can be carried out here without causing ecosystem fragmentation or altering hydraulic fluxes, provided that mitigating measures are implemented to ensure the permanence and functionality of ecosystems and to preserve natural resources (CONANP-SEMARNAT 2013). However, these activities have had repercussions on vegetation covers. Furthermore, but to a lesser extent, the population in the region is degrading mangrove forests. For example, R. mangle is used for medicinal purposes or to dye fishing nets with tannins; A. germinans, to build houses or as pasture for livestock; and L. racemosa, to build tobacco galleries, stakes, posts, fish traps, fences, and walls, and also as firewood to grill and smoke fish (Rodríguez-Zúñiga et al. 2013).
The increase in disturbed mangroves was caused by anthropogenic activities but also by environmental factors such as hurricanes and tropical storms. This counterproductive and rapid mangrove dieback has been increasing since 1994, when the impact of Hurricane Rosa caused losses in L. racemosa and A. germinans (Valdez-Hernández et al. 2009). The effect of anthropogenic activities and natural factors has spread considerably at the national level, as the disturbed mangrove area in 1970 was 1,192 ha and by 2015 it increased to 18,332 ha, of which Marismas Nacionales represents 39.72% (Valderrama-Landeros et al. 2017). However, environmental factors have caused counterproductive and rapid mangrove dieback in other regions. For example, in the Gulf of Carpentaria, Australia, die-off was caused by aridity, high variability in temperature, salinity, El Niño, and low sea level, which induced hypersalinity and water stress (Harada et al. 2019). In northern Australia, the die-off was prompted by the low sea level (Lovelock et al. 2017, Asbridge et al. 2019, Sippo et al. 2019), and on Abaco Island, Bahamas, it was induced by foliar disease (Rossi et al. 2020). To the southeast of Florida, USA, die-off was caused by Hurricane Irma (Lagomasino et al. 2020), whereas to the northeast of the Florida coast, it was caused by the rise in sea level, temperature, and precipitation (Rodriguez et al. 2016). In the Rufiji River, Tanzania, it was caused by El Niño and heavy rains (Erftemeijer and Hamerlynck 2005); to the east of Brazil, by a hail storm and El Niño (Nogueira-Servino et al. 2018); in South Africa, by pathogens and insect plagues (Osorio et al. 2017); and on the east coast of South Africa, by tropical storms and droughts (Adams and Rajkaran 2020).
Losses in mangrove forests caused by changes in land use due to the above-mentioned environmental and anthropogenic factors will set off CO2 emissions into the atmosphere. This was also shown by other studies. Adame et al. (2018) indicated that mangrove losses on the Pacific coast of northern and central Mexico was caused by the introduction of shrimp ponds (80% loss in carbon stocks and 66% loss in the change from mangrove forest to pasture for cattle [agricultural]), which resulted in emissions of 0.32 ± 0.06 Tg of CO2e in the 1981-2005 period, 0.68 ± 0.12 Tg of CO2e in 2005-2010, and 0.00 Tg of CO2e in 2010-2015. Likewise, in the bays of Jiquilisco and Jaltepeque, El Salvador, the transition from mangrove forest to agricultural land uses reduced 90% of carbon during the 1993-2014 period (estimated emission of 48,495 to 58,004 Gg of CO2e) (Cifuentes et al. 2016). A study carried out in the semiarid region of northwestern Brazil determined that the transition of mangrove forest to shrimp ponds caused the loss of 58% to 82% of stored carbon (average emission of 1,390 Mg of CO2e·ha-1) (Boone-Kauffman et al. 2018). Meanwhile, Alongi (2020) mentioned that, worldwide, the reduction in mangrove forests has been caused by their transition to aquaculture and agriculture areas, with emissions of 0.088 Pg of CO2. Off the coast of Thailand, 70% of stored carbon was lost with the transition from mangrove forest to abandoned aquaculture ponds, with a mean loss of 304 ± 61.3 t of C·ha-1 after 10 years (Elwin et al. 2019). Something similar occurred on the coast of Honda Bay, Philippines, where transitions from mangrove forest to abandoned aquaculture ponds, coconut plantations, abandoned salt production areas, and deforested areas emitted 110 kg of CO2e·ha−1·d-1 (Castillo et al. 2017). On the other hand, in Sundarban, India, during the 1975-2013 period, 60% of mangrove forests were lost to erosion and became anthropogenic surfaces (emission by aerial biomass of 1,567.98 ± 5.51.69 Gg of CO2) (Akhand et al. 2017).
Regarding the analysis of the net change and loss rates, we determined that deforestation is underestimated when using net change because net change considers the surface area of mangrove forests on both dates and ignores the exchanges in land uses that occurred in the assessed period. The loss rate, on the other hand, gives us a value on the explicit basis of deforestation of the mangrove forest in both periods. This does not occur in the same way at the national level, since during the 1976-2000 period, the annual loss rate varied between 1.0% and 2.5% (INE-SEMARNAT 2005). For the 1973-2011 period, Romero-Berny et al. (2013) obtained an annual rate of 1.1% based on the net change value. Another study carried out in Mexico using the difference of a cartographic analysis reported that the estimated annual deforestation rate was 0.22% ± 0.07 for the 1981-2005 period, 0.49% ± 0.23 for 2005-2010, and −0.57% ± 0.30 for 2010-2015, with a degradation rate of 0.11% ± 0.03, 0.29% ± 0.09, and −0.07% ± 0.03, respectively, for each time period (Adame et al. 2018).
When comparing the mangrove area lost to deforestation and the respective annual loss rate, we find that the results obtained in this work do not coincide with other studies either, for different methods were used for obtaining the rate values. For example, in Southeast Asia, during the 2000-2012 period, more than 100,000 ha were lost to deforestation, with an average deforestation rate of 0.18%, of which 30.00% was caused by aquaculture (Richards and Friess 2016). In Myanmar, Asia, during the 2000-2014 period, 191,122 ha were lost to deforestation, with a rate of 2.20% (Estoque et al. 2018), and between 1996 and 2016, mangrove cover decreased 52.00%, with net loss rate ranging between 3.60% and 3.87% (De Alban et al. 2020). On the other hand, between 2000 and 2005, on the Pacific coasts of Colombia, Panama, and Costa Rica, 564 ha were lost to agriculture, with an average deforestation rate of 0.02% (López-Angarita et al. 2018).
The above shows us that even though Marismas Nacionales is a Protected Natural Area, it has been affected over the years by anthropogenic and environmental factors. This impact has caused deforestation and forest degradation processes and, in turn, CO2 emissions into the atmosphere, which contributes to greenhouse gas emissions that increase natural phenomena resulting from climate change. If this impact continues to increase, the existence of the flora and fauna that coexist in this habitat will be at risk and wildlife will have to find new places to subsist, which would put the human population at risk. Therefore, it is of utmost importance that the decision-making process for new public policies prioritize the protection and conservation of mangrove forests in a sustainable way in order to gain social, economic, and environmental well-being.

