text new page (beta)
 English (pdf)
 Article in xml format
 Article references
 Send this article by e-mail
 Cited by SciELO
  Similars in
SciELO
Similars in
SciELO 
 Permalink
INTRODUCTION
Marine biodiversity is threatened by numerous human impacts, such as overfishing, which often results in the removal or drastic decline of high-trophic-level organisms (Pauly and Palomares 2005); activities accelerating climate change, which can impact species’ ranges and result in local extinctions due to unfavorable conditions; and other forms of pollution and resource extraction that can modify entire communities (Sydeman et al. 2015). Both biodiversity and its threats are not equitably distributed, as some regions have high species richness, unique evolutionary lineages, and a wide variety of covered ecological niches (Costello et al. 2017). Likewise, many areas are subject to greater anthro pogenic pressure due to their proximity to highly populated areas, such as islands near the coast (hereafter referred to as continental islands), which are more accessible than remote oceanic islands (Halpern et al. 2019).
Shallow reefs (<30 m) around islands have been exten sively studied (Glynn et al. 2017), while ecosystems at greater depths have received little attention. In particular, the meso photic zone, which is the layer of the ocean that is between 30 and 150 m deep in tropical and subtropical waters (Kahng et al. 2019), constitutes one of the least explored zones due to the historically high cost and expertise required to operate tools that can access those depths (Turner et al. 2017). How ever, although the amount of incident light in this area is low (1%-10% with respect to the surface) and this limits primary production (Kahng et al. 2019), it is hypothesized that meso photic reefs could host high biodiversity due to more stable conditions associated with reduced impact of natural (storm damage) and anthropogenic (habitat fragmentation, pollu tion, overfishing) threats (Loya et al. 2016).
Despite the hypothetical and demonstrated diversity of mesophotic reefs around the world, habitats below 30 m depth remain severely under-documented in Mexican Pacific waters (Turner et al. 2017). Additionally, the continental islands of this region have been the subject of a greater number of studies compared to the oceanic islands, given the isolation and difficulty in accessing these sites (Quimbayo et al. 2016, Fourriére et al. 2019). For this reason, the present study aimed to characterize the fish assemblages of 2 island groups: continental islands in La Paz Bay, near a large urban center (>300,000 inhabitants), and oceanic islands of the Revillagigedo Archipelago, inhabited only by the popula tion of small naval bases. Using multiple diversity indices, we compared the fish assemblages between different types of habitats in both regions to try to determine whether bioge ography, oceanography, and differential exposure to anthro pogenic disturbances affects the diversity of ichthyofauna in the mesophotic zone.
Considering the shallow-reef literature for both regions, we developed 5 hypotheses. (1) Species richness would be higher in waters near the islands of La Paz Bay, since it is recognized as a biodiversity hotspot (Olivier et al. 2018). (2) Taxonomic distinctness, which indicates the presence of unique evolutionary lineages, would be greater in continental islands, since older and less isolated island territories are more likely to experience colonization events (Pinheiro et al. 2017). (3) The average trophic level of the oceanic island fish assemblages would be higher due to a lower fishing pressure, since fisheries tend to concentrate on species at higher trophic levels (Pauly and Palomares 2005, Fourriére et al. 2019). (4) The functional diversity observed in oce anic islands would be greater due to the higher occurrence of pelagic species, which present more diverse functions and encompass a greater variety of ecological niches (Robertson and Cramer 2009). (5) All the indices will present higher values in rocky reefs compared to sand habitats, since greater structural complexity can host more diverse fish assemblages (Aburto-Oropeza and Balart 2001).
MATERIALS AND METHODS
Study area
The study area included 2 island groups (Fig. 1): the continental islands of Espíritu Santo and Cerralvo, located <70 km from the city of La Paz (>300,000 inhabitants) in the southern portion of the Gulf of California (CONANP 2015, León-de la Luz and Rebman 2002); and the oceanic islands of San Benedicto, Socorro, and Clarión, located in the Revil lagigedo Archipelago (>700 km of the Mexican continental shelf).

Figure 1 Study area. Continental group: Espíritu Santo (a), Cerralvo (b); oceanic group: San Benedicto (c), Socorro (d), Clarión (e). Black dots indicate survey sites.
The southern Gulf of California, where Espíritu Santo and Cerralvo are located, is a mixing zone of 2 major bodies of surface water (Tropical Surface Water and Gulf of California Water) and the Subtropical Subsurface Water located between 150 and 500 m deep (Castro et al. 2006). The Revillagigedo Archipelago is influenced by 2 major bodies of water that vary seasonally: in summer there is greater influence of Tropical Surface Water and in winter, the California Current dominates (Portela et al. 2016). Both regions are considered oceanographic transition zones because of the confluences of different water masses (Portela et al. 2016). In addition to the differences in oceanographic conditions between both groups of islands, the classifica tion by Robertson and Cramer (2009) indicates that, consid ering the resident fish fauna, the continental islands (Espíritu Santo and Cerralvo) belong to the biogeographic province of Cortés, while the Revillagigedo Archipelago is part of the Oceanic Islands province.
The waters surrounding all islands studied are under federal protection in Mexico, with the exception of Cerralvo, where only the land has been federally pro tected since 1978 (CONANP 2015). The Espíritu Santo marine zone was declared as National Park in 2007 and encompasses a 48,654.83-ha polygon, within which there are 3 no-fishing zones corresponding to 1.4% of the pro tected area (CONANP 2015). San Benedicto, Socorro, and Clarión islands are part of the Revillagigedo Archi pelago Biosphere Reserve since 1994, which changed to the category of National Park in 2017, covers a polygon of 14,808,780.12 ha with absolute restriction on fishing activ ities, and is considered one of the largest protected areas in North America (CONANP 2018).
Survey methods
The study was carried out with a remotely operated vehicle (BlueRobotics, BlueRov2) capable of diving to 100 m. The vehicle was equipped with four 1,500-lm LED lights, an integrated forward facing camera (8 MP, Rasp berry Pi v2) with an 80º angle of view, an external down ward-facing camera (GoPro HERO 3 and HERO 4), and a depth (m) and temperature (ºC) sensor (Measurements Specialties MS5837-30BA). Although the average speed was not measured, this vehicle could reach a maximum speed of 1.5 m·s-1. To the best of our abilities, we attempted to hold the vehicle between 1 and 3 m above the ground for the sur veys. In total, we surveyed 20 sites (continental group N = 9, oceanic group N = 11; Fig. 1), one dive per survey. The dura tion of each dive varied between 7 and 65 min depending on the environmental conditions, with a range between 30 and 90 m depth. The bathymetric range for the mesophotic zone was determined using the literature for subtropical zones (Kahng et al. 2019), because it was not possible to measure the percentage of incident light in situ.
The recordings of both cameras in each dive were syn chronized and cut into 5-min segments, starting when the vehicle reached the bottom. Each segment was taken as a sampling unit, which gave a total of 78 video-transects for the 5 islands: 41 video-transects in the continental group (Espíritu Santo N = 31, Cerralvo N = 10) in October 2018; 37 video-transects in the oceanic group (Clarión N = 25, San Benedicto N = 9, Socorro N = 3) in December 2018. In each video-transect, all fish within the visual field were identified to the minimum possible taxonomic level using the Robertson and Allen (2015) guide. We estimated the frequency of occurrence of each species (and each class) across each island group, defined as the percentage of video-transects in which each species appeared.
Taxonomic and functional indices
We constructed species accumulation curves using the number of species observed in each video-transect (S; species richness data) to determine if the sample size per island group was sufficient to adequately characterize the fish assemblage. We also constructed rarefaction curves to compare fish diversity between island groups using species richness and occurrence (Gotelli and Colwell 2001). These curves were made using the exact method (also called Mao Tau) and rarefaction in the vegan package in R (Oksanen et al. 2019, R Core Team 2019).
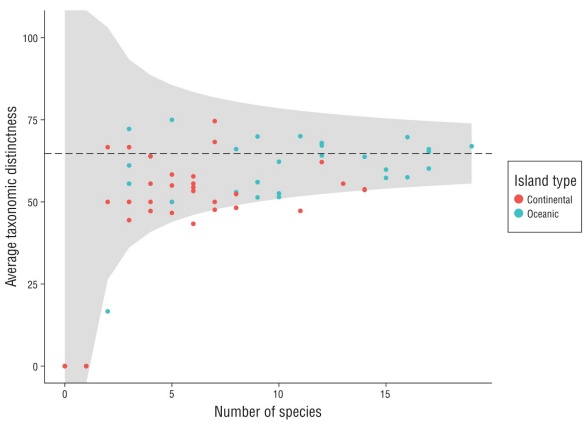
We calculated the average taxonomic distinctness (Δ+) per video-transect using the taxonomic level of each species observed. This index assesses the degree of taxonomic relat edness among the species of an assemblage according to the Linnaean classification tree, including 6 hierarchical levels (genus, family, order, subclass, class, and superclass; Clarke and Warwick 1998; Table S1). Based on analysis by Clarke and Warick (1998), this metric is capable of detecting the effect of anthropogenic disturbances that tend to remove the most taxonomically different species first, due to their low frequency of occurrence. The species that remain tend to be more common and are usually more taxonomically similar, so low values are associated with more homogeneous commu nities. This index has advantages for ecological studies, such as independence from the sampling effort and not requiring normality in the data (Clarke and Warwick 1998). To comple ment this analysis, we created a funnel plot based on random simulations of the data to calculate the expected value of Δ+ and its interval using the number of species observed in each sample. This allowed us to compare observed vs. expected taxonomic distinctness. Calculations were made using the vegan package in R (Oksanen et al. 2019).
Average trophic level (NT) per video-transect was cal culated using the trophic level value for each observed spe cies, as taken from FishBase (Froese and Pauly 2019), and divided by the number of species per video-transect (Pauly and Palomares 2005; Table S1). Trophic level values refer to the position of species in the food web, including herbivores and detritivores (2.00-2.19), planctivores and secondary consumers (2.20-2.79), benthic carnivores (2.80-3.90), and piscivores or predators (4-5; Pauly and Palomares 2005, Fourriére et al. 2019). NT can illustrate the effect of fisheries on the assemblage, given that catches often target high tro phic level species.
Functional indices were calculated from 6 traits that reflect key aspects of fish ecology (Olivier et al. 2018): (1) maximum length (ordinal: 0-7, 7-15, 15-30, 30-50, 50-80, >80 cm), (2) mobility (ordinal: highly attached to the site, mobile with a small home range, mobile with a large home range, highly mobile with a very large home range), (3) period of activity (nominal: day, night), (4) gregariousness (ordinal: solitary, in pairs, small and large schools), (5) posi tion in the water column (ordinal: benthic, benthopelagic, pelagic), and (6) diet (nominal: herbivore-detritivore, inver tivore of sessile organisms, invertivore of mobile organisms, planktivore, piscivore, omnivore). For the species that were not listed by Olivier et al. (2018), we obtained the functional information from FishBase (Froese and Pauly 2019) and Shorefishes of the Tropical Eastern Pacific (Robertson and Allen 2015) databases. With the functional traits, we gener ated an alphanumeric code to define the group or functional entity (FE; Table S2) of each species. In addition, with these codes, we calculated the richness of FEs per island group, which corresponds to the number of unique combinations of traits present in a given assemblage (Mouillot et al. 2014).
To calculate the functional volume per island group in each habitat, the matrix of functional traits per species (nom inal and ordinal) was transformed into a quantitative sim ilarity matrix using the Gower distance coefficient, which allows to compare different types of variables and give them equal weight (Gower 1971). Subsequently, a principal coor dinate analysis (PCoA) was performed to transform these distances into coordinates. The coordinates by species were used to estimate the functional volume according to the model of Cornwell et al. (2006) (convex hull volume), in which the outermost vertices (represented by the FEs with more atypical traits) define the convex hull (Villéger et al. 2008). The number of coordinates used to represent the func tional space per island group in each habitat (first four) was selected based on the criteria of Maire et al. (2015).
Finally, the values of these 4 coordinates per species in each video-transect were used to calculate the average func tional richness (FRic), which corresponds to the amount of functional space that an assemblage encompasses in each video-transect, in proportion to the regional volume (Villéger et al. 2008; Table S1). Low FRic values indicate that there are niches (i.e., resources) in the community that are not occu pied or exploited (Mason et al. 2005). This index, as well as the functional volume (i.e., the space covered by the assem blage in each island group) and the number of FEs, was cal culated using the packages FD (Laliberté et al. 2014), tripack (Renka et al. 2020), and geometry (Roussel et al. 2019). It is necessary to highlight that functional diversity studies com plement analyses that rely on traditional indices, since incor porating information on biological traits makes it possible to identify the role of each species in ecosystem processes (Petchey et al. 2007, Francisco and de la Cueva 2017). Thus, assemblages belonging to disturbed or degraded habitats will present a lower variety of processes (and therefore lower values of functional diversity), compared to pristine habitats (Villéger et al. 2010).
Statistical analysis
Using generalized Bayesian linear mixed models, we evaluated whether the calculated diversity indices (S, Δ+, NT, and FRic) varied according to the island group (oceanic or continental) and/or type of habitat (sand or rocky reef). Island group and habitat were modeled as fixed effects and their interaction was also considered. On the other hand, the island (N = 5) and site (N = 20) variables were included as random effects. All indices were modeled using a Gaussian distribu tion, with the exception of S, which was modeled using a Poisson distribution. The treatments (island group, habitat, and interaction) were considered different if the 95% cred ible interval of the posterior distribution did not overlap the value of zero. The models were run using the brms package (Bürkner 2018), and they used Monte Carlo-type simulation methods, 4 Markov chains, non-informative priors, and a subsequent analysis period of 4,000 cycles. The convergence of each model was evaluated based on well-mixed sampling chains and rhat values equal to one. Finally, we conducted an a posteriori Tukey test to compare the distributions of the fixed effects in a paired way, using the emmeans package (Lenth 2019).
RESULTS
In total, we identified 73 species (8 of them only at the genus level), which included 65 bony fish (25 families and 47 genera) and 8 cartilaginous fish species (3 families and 5 genera) in the 13 h of video surveys. The class Actinopte rygii had the highest frequency of occurrence for both island groups. Bony fish occurred in >94% of the video-transects in the continental group, and the dominant species were Holacanthus passer (>18% of video-transects), Liopro poma fasciatum (>12%), and Paranthias colonus (>12%). In the oceanic group, Actinopterygii were present in 77% of video-transects over rocky habitat and 86% of video-transects over sandy habitat, with the most frequently observed spe cies being Paranthias colonus (>57% of video-transects), Caranx lugubris (>53%), and Seriola rivoliana (>23%) (Table S2). In general, the class Elasmobranchii was much less common. In the continental group, it was observed in only 4% of video-transects over rocky habitats and 6% over sandy habitats, with the Urobatis (4%) and Urotrygon (6%) genera as the most frequent. In the oceanic group, this class was observed in 14% of the video-transects conducted over sandy habitat and 23% of the video-transects over rocky hab itat. In rocky oceanic habitats, sharks such as Carcharhinus albimarginatus (40%) and Carcharhinus falciformis (37%) were the most frequently observed (Table S2).
The accumulation curves for both island groups were asymptotic (Fig. 2), meaning that the sample size adequately represented the actual fish assemblages. The rarefaction curves indicated less dominance of a few species and there fore more diversity in the oceanic islands, compared to the continental group (Fig. 2). Additionally, the funnel plot of Δ+ suggested that both island groups had values lower than would be expected given the number of species observed in each video-transect (Fig. S1). This pattern was especially observed in the continental group, which indicates that the fish assemblages in this area are taxonomically less complex than would be expected.

Figure 2 Species accumulation curves and rarefaction curves by island group. For the accumulation curves, the independent variable is the number of video-transects and the dependent vari able is the number of accumulated species. For the rarefaction curves, the independent variable is occurrence, and the dependent variable is the number of species.
For the S, Δ+, and NT indices, we found no differences between the oceanic and continental assemblages and no interaction between island group and habitat (Table S3). However, we did see an effect of habitat, with higher average values for rocky reefs compared to sandy habitats (Table S3). In contrast, for FRic we found an effect of the habitat and the interaction between island group and habitat. The a posteriori test showed that, within the oceanic group, video-transects from rocky reefs had higher average FRic values than those in sandy habitats, while there was no differ ence between habitats in the continental group. No difference was observed between the island groups (Table 1).
Table 1 Results of Tukey tests for the Bayesian generalized linear mixed models, including the estimated value and the 95% credible interval (CI) by island group (difference between continental and oceanic), habitat (difference between rock and sand), and the interaction between island group and habitat (difference between rock and sand in continental vs. oceanic islands). Factors in bold indicate a significant effect (i.e., CI does not overlap zero).
| Estimate | 95% CI | |
| Species richness | ||
| Island group | -1.53 | -3.97 to 1.86 |
| Habitat | 3.67 | 2.45 to 5.47 |
| Island group × habitat | -1.29 | -2.77 to 1.79 |
| Average taxonomic distinctness | ||
| Island group | -14.20 | -34.20 to 7.33 |
| Habitat | 33.60 | 20.20 to 47.10 |
| Island group × habitat | -5.72 | -30.80 to 20.80 |
| Trophic level | ||
| Island group | -0.82 | -2.27 to 0.59 |
| Habitat | 0.56 | -0.03 to 1.14 |
| Island group × habitat | 0.91 | -0.20 to 2.13 |
| Functional richness | ||
| Island group | 0.12 | -0.04 to 0.29 |
| Habitat | -0.05 | -0.25 to 0.09 |
| Island group × habitat | 0.09 | 0.05 to 0.14 |
Finally, regarding the number FEs and the functional space occupied (Fig. 3), we observed higher values among rocky reefs compared to sandy habitats in both island groups. Among the oceanic group, we observed 40 FEs and 76% of functional space occupied in rocky reefs and 19 FEs and 44% of functional space occupied in sandy habitats. Similarly, in the continental group we observed a higher number of FEs (37 FEs) and functional space occupied (66%) in rocky reefs than in sandy habitats (22 FEs and 42% functional space occupied).

Figure 3 Functional space occupied by the ichthyofauna at mesopthotic depths across both island groups (continental and oceanic) for the 2 habitats (rock and sand). In the first row (a), histograms of species richness (No. sp.), number of functional entities (No. FE), and percentage of occupied functional space (Vol. 4D) are presented (absolute value displayed at the top of each bar). The next 2 rows represent the distribu tion of the species recorded in the functional space, constructed from axes 1 and 2 (b), and axes 3 and 4 (c) of the PCoA. The volume occu pied by the functional entities of each island group and habitat is framed in black and the regional space is shown with a black dashed line.
DISCUSSION
In this study, we analyzed the fish biodiversity observed at mesophotic depths around island clusters in 2 biogeographic provinces on the Pacific coast of Mexico. Despite the fact that oceanographic conditions, proximity to human populations, and levels of protection against resource extraction were dra matically different between both island groups, we did not find differences in most of the diversity indices tested. This result was the opposite of that reported by Ramírez-Ortiz et al. (2017), where they found significant differences in the richness and functional diversity of shallow fish and inver tebrates between both provinces, with higher values in the province of Cortés compared to the Oceanic Islands prov ince. This pattern was associated to the presence of more het erogeneous areas in the Gulf of California (Cortés), in terms of oceanographic conditions and habitat, which offered a greater variety of environments and niche spaces for dif ferent species compared with the Oceanic Islands province.
Part of the difference between the study by Ramírez-Ortiz et al. (2017) and ours could be attributed to the fact that our analysis included only conspicuous medium and large ichthyofauna, since these were readily identifiable in the video-transects. In contrast, Ramírez-Ortiz et al. (2017) included invertebrates and some cryptic fish, which may contribute to the richness and functional diversity values reported in both regions in highly meaningful ways. Like wise, their analysis was based on an extensive sampling effort that covered a wider range of environments in the Gulf of California (Los Cabos, Cabo Pulmo, Espíritu Santo, Loreto), whereas our study included only areas in the immediate sur roundings of Espíritu Santo and Cerralvo. Considering the high variability we observed between islands and sites, fur ther exploration will be necessary to effectively capture the range of habitats and assemblages at mesophotic depths in both island groups. Although technological advances will increase accessibility to the mesophotic zone to allow for more robust comparisons with shallow reefs, this work is a first step towards that goal.
Across all assessed indices (Table S3), we found that hab itat influences fish assemblages, which confirmed our fifth working hypothesis (greater diversity in rock habitats) and complemented the analysis of Hollarsmith et al. (2020). In addition to this, other analyses have highlighted that struc tural complexity (rugosity) is the characteristic that has the greatest effect on the diversity of ichthyofauna (Kelley et al. 2006, Dustan et al. 2013). Although this variable was not directly quantified, it was visually obvious that the sandy areas (homogeneous and with minimal rugosity) were three-dimensionally less complex than the rocky reefs.
In regard to differences in mesophotic fish assemblages between the island groups, and thus differences between the biogeographic provinces, we rejected our working hypoth eses 1, 2, and 3. Traditional indices (S, Δ+, and NT) did not present significant differences between island groups, indicating that, although the species themselves differed (Hollarsmith et al. 2020), the fish assemblages of the meso photic zone were homogenous. This may be due to the fact that these depths are impacted by fewer natural and anthro pogenic disturbances (Loya et al. 2016), which could mean similar conditions across both biogeographic provinces that could support fish assemblages with similar diversity and conservation status (Clarke and Warwick 1998, Pauly and Palomares 2005).
Given that traditional indices (S, Δ+, and NT) do not con sider the identity of the species (despite incorporating infor mation on the taxonomic hierarchy and trophic level), a further analysis, such as the calculation of functional rich ness (which incorporates information on functional traits), was necessary to confirm if fish assemblages in the 2 types of habitats in both island groups showed similar fish diver sity (Table S4). In this case, functional richness showed a different pattern than the other indices: the fish assemblages observed in rocky reefs around the oceanic group occupied a greater functional volume compared to sandy habitats of the same group (Fig. 3). Considering that the functional volume is defined by the outermost vertices (represented by the FEs with more atypical traits) of the assemblage, higher values of this index indicate that the rocky reefs supported a wider range of functional niches in the oceanic group (Mouillot et al. 2014). The differences between both habitats were also observed in the total functional volume covered by each assemblage (Fig. 3), where the rocky reef habitat of the oce anic group comprised 76% of the regional volume, compared to 44% occupied by the assemblage found in sandy habitats.
The observed higher functional volume in the rock habitats around the oceanic group was likely driven by the high fre quency of occurrence of elasmobranchs and transpacific spe cies in rocky reefs of the Revillagigedo Archipelago (23%; Table S2). The extreme functional characteristics of sharks relative to other ichthyofauna can greatly increase the func tional heterogeneity of an assemblage (Clarke and Warwick 1998, Rogers et al. 1999). In addition to elasmobranchs, the resident fauna of these rock habitats on oceanic islands is enriched by a great variety of transpacific species (Robertson and Cramer 2009), which are mostly benthopelagic. These species are often large, highly mobile, and with wide distri butions, which would also increase functional heterogeneity, and thus total functional volume and richness, of an assem blage. This pattern has also been observed around other oceanic islands of the Eastern Tropical Pacific (Malpelo; Quimbayo et al. 2016). Importantly, many of these species with extreme traits and high frequency of occurrence (>23%; Table S2), such as Caranx lugubris and Seriola rivoliana, also make up economically important fisheries in Mexico (DOF 2018).
The preponderance of sharks and commercially important fish species in rocky reef habitats around the oceanic islands could indicate reduced fishing pressure in the region. Fishing exploitation tends to first remove large and high-trophic-level species given their high commercial value (Pauly and Palomares 2005). The remoteness of the Revillagigedo Archipelago (>700 km from the mainland) and its high levels of federal protection (CONANP 2018) could protect these assemblages from overexploitation. This fact is supported by the results of the Δ+ funnel plot, where the observed values for the oceanic group were close to the expected values, indicating that the fish assemblages in this region have suf fered less alterations than those around the continental group (Clarke and Warwick 1998).
This type of study, in which the assemblages of fish in mesophotic depths are described quantitatively and qualita tively, may have relevant implications for management strat egies, because some commercially important species could find refuge from fishing in deeper waters. However, the idea that mesophotic reefs function as refuges for commercial spe cies cannot yet be verified for the Pacific coast of Mexico, due to the lack of data on abundance and fish sizes and of samples of shallow and deep strata taken with the same tech nique (video-transects with a remotely operated vehicle). According to theory, the value of NT should increase with respect to depth, as it is driven by a greater abundance of high trophic level species (commercially important) that seek refuge in these strata (Loya et al. 2016) and by a decrease in herbivores (NT = 2) due to the lack of seaweed cov erage (reduced light limits primary production; Asher et al. 2017). This pattern was not observed for the fish assem blages in the mesophotic zone, which presented an average NT (3.81 ± 0.15; Table S4) similar to that reported for fish in shallow reefs at Revillagigedo (NT = 3.5) in the study by Fourriére et al. (2019).
Considering that the present work is a pioneer in the anal ysis of fish diversity in mesophotic reefs of the Pacific coast of Mexico, our results cannot be directly compared with most of the studies carried out in shallow depths (<30 m) of the Gulf of California (Aguilar-Medrano and Calderón-Aguilera 2015, Ramírez-Ortiz et al. 2017, Olivier et al. 2018) and the Revillagigedo Archipelago (Ramírez-Ortiz et al. 2017, Four riére et al. 2019). However, it is necessary to highlight that, contrary to the homogeneity that we observed in the meso photic zone, these regional studies have reported significant differences at shallow depths, including greater functional richness in Cortés province compared to the Mexican prov ince (Aguilar-Medrano and Calderón-Aguilera 2015), and the Oceanic Islands province (Ramírez-Ortiz et al. 2017). In addition, these differences were also reported for the con tinental group, where Espíritu Santo and Cerralvo are even considered a biodiversity “hotspot” based on shallow fish, compared to the north and south of the Gulf of California (Olivier et al. 2018). Considering this, it will be necessary to carry out censuses with the same sampling method simulta neously in shallow and mesophotic reefs to try to determine if the heterogeneity between biogeographic provinces only occurs in the shallow strata.
Despite the fact that this study was based on a lower sam pling effort (13 h) than comparable analyses of assemblages in the mesophotic zone of other regions such as the Gulf of Mexico (>20 h; Bryan et al. 2012, Streich et al. 2017), the accumulation curves indicated that the sample size was ade quate to represent the fish assemblages of both island groups. In a complementary manner, this analysis and the study of Hollarsmith et al. (2020) constitute a qualitative and quan titative description of the mesophotic zone in Pacific waters off Mexico, an oceanographically complex and ecologically important region.
In conclusion, the diversity of fish in the mesophotic zone in the province of Cortés and the Oceanic Islands province were practically homogeneous, which is contrary to what was reported for shallow reef ichthyofauna. In contrast, hábitat type influenced the traditional indices (S, Δ+, and NT), with higher values found for fish assemblages in rocky reef hab itats (more complex) compared to sandy habitats, while the functional indices only differed among rock and sand habitats in the oceanic group. This was driven by numerous observa tions of sharks and transpacific fish in Revillagigedo, which resulted in greater functional heterogeneity among these assemblages. Altogether, high values of functional diversity and taxonomic distinctness observed in the oceanic group could indicate that the mesophotic fish assemblages of the oce anic region are in a better conservation status than those closer to the continent, but further exploration is required to observe if this pattern holds through time and to determine if these ecosystems serve as a refuge for commercial species in the face of the increasing anthropogenic threats to shallow reefs.