


 nueva página del texto (beta)
 Inglés (pdf)
 Artículo en XML
 Referencias del artículo
 Enviar artículo por email
 Citado por SciELO
  Similares en
SciELO
Similares en
SciELO 
 Permalink
INTRODUCTION
The California halibut, Paralichthys californicus Ayres, 1859, is an important benthic aquatic resource of shallow nearshore areas and bays of California, USA, and Baja California, Mexico (Gracian-Negrete et al. 2015). The distribution of P. californicus ranges from northern Wash ington State, USA, to southern Baja California, Mexico, along the Pacific coast and into the Gulf of California. This flatfish is highly priced for domestic and export markets, mainly in Asia. It reaches over 1.5 m in total length and can weigh more than 30 kg (Gracian-Negrete et al. 2015). Paralichthys californicus stands out in the domestic and export markets for its high-quality meat for human con sumption. In Mexico, official catch numbers comprise 11 different species, all of them considered to be part of a single flatfish fishery (Gracian-Negrete et al. 2015, SEPESCABC 2017). In the state of Baja California, the flatfish fishery is considered within the finfish category, which ranks sixth in terms of average annual production value (SEPESCABC 2017), and the production of this multispecies fishery increased in Mexico from 325 t in 2011 to 577 t in 2018. In 2018, the value of this commercial and recreational fishery was 1.4 million USD, reaching the highest average price of 2.5 USD per kilogram. Compared to 2017, its average price per kilogram increased up to 159%. There is only one Mexican fishery report for P. californicus (Gracian-Negrete et al. 2015), which states that 2,400 t were captured in Bahía de los Ángeles in 1990. However, this place has been listed as a biosphere reserve since 2007 (DOF 2007, 2010), and the fishery has declined. Additionally, an 80% reduction in the flatfish fishery in subsequent years has been reported (Gracian-Negrete et al. 2015), which is consistent with reports for recent years.
On the other hand, there is a high market demand for halibut in Asia. The United Nations Food and Agriculture Organization (FAO) reported a catch of 10,665 t of Japa nese halibut, Paralichthys olivaceus (a species that attains a standard length of 80 cm), in 2016, mainly by Japan and the Republic of Korea (FAO 2020). Fishing of this species has dropped; by contrast, aquaculture production is on the rise, as shown by official aquaculture statistics, from 1,572 t in 1985 to 43,929 t in 2016 (FAO 2020). This indicates that flatfish aquaculture is very important worldwide, and P. californicus farming might be lucrative for the Mexican economy. It is therefore essential to describe the ecological and genetic aspects of Mexican populations of the California halibut, P. californicus, to inform its culture and provide genetic tools to develop fishery and aquaculture management strategies. Furthermore, genetic data on flatfish species are also important elements in studies on the evolution of novel body plans.
Nuclear and mitochondrial genetic markers have been used to characterize species of economic impor tance. About 2 decades ago, the genetic characterization of a species of interest frequently required knowing its DNA sequences. Nowadays, next-generation sequencing (NGS) has allowed the development of novel genetic anal yses with no previous knowledge of the DNA sequences for a particular species, and its impact has been recog nized for more than a decade (Schuster 2008, Metzker 2010, Chinmayee et al. 2018). Mitochondrial genomes have been obtained by NGS using Illumina platforms for marine (Del Río-Portilla et al. 2016c, Galván-Tirado et al. 2016, León-Pech et al. 2016) and freshwater fishes (Barriga-Sosa et al. 2016; Camarena-Rosales et al. 2016; Del Río-Portilla et al. 2016a, b), elasmobranchs (Castillo-Páez et al. 2016a, b), corals (Del Río-Portilla et al. 2016d), and mollusks (Bisbal-Pardo et al. 2016a, b; Magallón-Gayón et al. 2020).
This work presents the complete mitochondrial genome of P. californicus as new genetic information to build base line molecular data for this species.
MATERIALS AND METHODS
A muscle sample from a California halibut was collected for the analysis. One fish was caught in Ejido Eréndira, Baja California, Mexico (31º15′41″ N, 116º22′52″ W), as broodstock and kept in captivity at CICESE (Centro de Investigación Científica y de Educación Superior de Ensenada, Baja California) prior to sampling. The specimen analyzed was handled in accordance with the ethical stan dards for the use of fish in research of the American Fisheries Society; all applicable institutional guidelines for animal care were followed. Total DNA was extracted using the QIAGEN DNeasy Blood & Tissue kit. A high-quality DNA sample was sent to the Georgia Genomics Facility (University of Georgia; Athens, GA) for NGS. DNA was sheared by sonication with Bioruptor using 2 rounds, each consisting of 5 cycles of 30-s sonicating (high setting) plus 30 s with no sonication. The library prep protocol was followed using the Kapa Biosystems Hyper Prep Kit (KR0961-v4.15), ligating custom adapter stubs and amplification through 12 PCR cycles with custom nucleotide indexed primers (Glenn et al. 2019). Dual-size selection with magnetic beads (Speed Beads, Rohland and Reich 2012) was performed to recover fragment sizes of ~250-450 bp. Libraries were sequenced in Illumina MiSeq to produce 300 bp paired-end reads.
Reads from fastq files were cleaned by trimming low-quality regions (quality limit = 0.05) followed by de-novo assembling with the CLC Genomics Workbench 6.5 soft ware, using the following settings: bubble size (248) and word size (22), minimum contig length (200 bp), perform scaffolding (yes), and auto-detect paired distances.
Contigs were filtered to provide a coverage ≥1.5 and more than 3 reads per contig after mapping reads to contigs. The longest contig identity was blasted to the nucleotide NCBI (National Center for Biotechnology Information, https://www.ncbi.nlm.nih.gov) database using the Basic Local Alignment Search Tool (Blast) (Camacho et al. 2009). Once identified, the mitochondrial genome was annotated with the Dual Organellar GenoMe Annotator, DOGMA (Wyman et al. 2004), MITOS (Bernt et al. 2013), and MitoFish (Iwasaki et al. 2013) web programs using the respective default set tings. Protein translation was verified with ExPASy (http://www.expasy.org) (Artimo et al. 2012) and tRNA was con firmed with tRNAscan (Lowe and Eddy 1997) and by com parison with other tRNA. The phylogenetic analysis was performed by comparison against complete mitogenomes of other flatfish from the NCBI GenBank site (Table 1). The MEGA software (Kumar et al. 2016) was used for mitoge nome alignment using the ClustalW (Thompson et al. 1994) procedure with default settings. jModelTest 2 software (Guindon and Gascuel 2003, Darriba et al. 2012) was used to select the best-fit nucleotide substitution model using Akaike (AIC) and Bayesian (BIC) information criteria with default settings. MrBayes 3.2 (Ronquist and Huelsenbeck 2003) was used to estimate the phylogenetic relationships with the best-fit model: the General Time Reversible (GTR) model of evolution with a gamma-distribution substitution model and a gamma-distributed rate variation across sites (GTR+G+I), running the Markov chain Monte Carlo simulation with 20,000 generations, 100 sample frequencies, and default set tings. The phylogenetic tree was built using FigTree V1.4.4 (Rambaut 2018). FishBase (Froese and Pauly 2019) and WoRMS (WoRMS Editorial Board 2020) databases were reviewed to obtain the number of Paralichthys species and their geographic distribution.
Table 1 Flatfish families and species used in this study, mitochondrial-genome accession number in GenBank, geographic distribution, and length of the control region.
| Mucleotide position | |||||
| Species | Accession number | Geographic distribution* | Start | End | Size (pb) |
| Berycidae | |||||
| Beryx mollis (Abe, 1959) | NC_013845 | Northwest Pacific and
Western Indian Ocean |
15,668 | 16,537 | 870 |
| Paralichthyidae | |||||
| Cyclopsetta fimbriata (Goode & Bean, 1885) | NC_024950 | Western Atlantic | 15,706 | 16,506 | 801 |
| Paralichthys californicus (Ayres, 1859) | MT859134 (this study) | Eastern Pacific and
northern Gulf of California |
15,696 | 16,858 | 1,163 |
| Paralichthys dentatus (Linnaeus, 1766) | KU053334 | Northwest Atlantic | 15,695 | 17,033 | 1,339 |
| Paralichthys lethostigma (Jordan & Gilbert, 1884) | KT896534 | Western Atlantic | 15,724 | 16,843 | 1,120 |
| Paralichthys olivaceus (Temminck & Schlegel, 1846) | NC_002386 | Western Pacific | 15,691 | 17,090 | 1,400 |
| Pseudorhombus cinnamoneus (Temminck & Schlegel, 1846) | NC_022447 | Western Pacific | 15,709 | 16,599 | 891 |
| Pseudorhombus dupliciocellatus (Regan, 1905) | NC_029323 | Indo-West Pacific | 15,701 | 16,621 | 921 |
| Pleuronectidae | |||||
| Hippoglossus hippoglossus (Linnaeus, 1758) | NC_009709 | Eastern Atlantic and Western Atlantic | 15,706 | 17,546 | 1,841 |
| Hippoglossus stenolepis (Schmidt, 1904) | NC_009710 | North Pacific | 15,707 | 17,841 | 2,135 |
| Platichthys stellatus (Pallas, 1787) | NC_010966 | North Pacific | 15,704 | 17,103 | 1,400 |
| Reinhardtius hippoglossoides (Walbaum, 1792) | NC_009711 | Circumglobal in Arctic and
temperate waters; northern hemisphere |
15,706 | 18,017 | 2,312 |
| Verasper moseri (Jordan & Gilbert, 1898) | NC_008461 | Northwest Pacific | 15,700 | 17,588 | 1,889 |
| Verasper variegatus (Temminck & Schlegel, 1846) | NC_007939 | Northwest Pacific | 15,702 | 17,273 | 1,572 |
| Psettodidae | |||||
| Psettodes erumei (Bloch & Schneider, 1801) | NC_020032 | Indo-West Pacific | 15,715 | 17,315 | 1,601 |
RESULTS AND DISCUSSION
After trimming the low-quality regions and eliminating failed reads, the remaining total number of reads was 3,243,808. A total of 284,243 contigs were assembled with a maximum of 16,858 bp and a minimum of 200 bp. The largest contig (16,858 bp, 35.82x coverage; GenBank acces sion number: MT859134) matched the mitogenome of the California halibut, which contains 13 protein-coding genes, 22 tRNAs, and 2 rRNAs (Table 2). Also found was a putative control region (D-loop) of 1,168 bp as suggested by the Mito Fish server and it was also present in other flatfishes (Fig. 1, Table 2). The mitogenome nucleotide frequencies observed in P. californicus were 27.5% adenine (A), 29.5% cytosine (C), 17.0% guanine (G), and 26.0% thymine (T), with A+T% slightly larger than G+C%. These figures are similar to those reported for other flatfish mitogenomes, as well as the dis tribution and orientation of protein-coding genes, tRNAs, rRNAs, and the control region (Table 2) (Saitoh et al. 2000, Xu et al. 2016). However, the sequence similarity of the con trol regions was low (1.5 %), with a length ranging from 1,120 to 2,312 bp (Table 1). In all mitogenomes, the translation ini tiation codon for protein-coding genes was ATG; the excep tion was COX1, for which the translation initiation codon was GTG, in agreement with the other sequences analyzed in this study and those of other 250 fish species (Satoh et al. 2016). Sequence overlaps were also present in the coding genes for ATP8-ATP6, ND4L-ND4, and ND5-ND6, similar to Paralichthys olivaceus and most fish species (Satoh et al. 2016). Paralichthys californicus has complete stop codons (TAA, TAG) in genes ND1, COX1, ATP8, ND4L, ND5, and ND6, and partial stop codons (TA or T) in genes ND2, COX2, ATP6, COX3, ND3, ND4, and CYTB, similar to P. olivaceus (Saitoh et al. 2000) (Table 2).
Table 2 Gene order of the mitochondrial genome of the California halibut, Paralichthys californicus, compared to the Japanese halibut, Paralichthys olivaceus. Paralichthys californicus Paralichthys olivaceus
| Paralichthys californicus | Paralichthys olivaceus | ||||||||||||||
| Name | Start | End | Size | Intergene nucleotidesa | Starting codon | Ending codon | Strand | Start | End | Size | Intergene nucleotidesa | Size differenceb | Starting codon | Ending codon | |
| tRNA-Phe | 1 | 68 | 68 | 0 | + | 1 | 68 | 68 | 0 | 0 | |||||
| 12S rRNA | 69 | 1,016 | 948 | 0 | + | 69 | 1,017 | 949 | 0 | -1 | |||||
| tRNA-Val | 1,017 | 1,090 | 74 | 0 | + | 1,018 | 1,091 | 74 | 0 | 0 | |||||
| 16S rRNA | 1,091 | 2,804 | 1714 | 0 | + | 1,092 | 2,804 | 1,713 | 0 | 1 | |||||
| tRNA-Leu | 2,805 | 2,878 | 74 | 0 | + | 2,805 | 2,878 | 74 | 0 | 0 | |||||
| ND1 | 2,879 | 3,853 | 975 | 3 | ATG | TAA | + | 2,879 | 3,853 | 975 | 3 | 0 | ATG | TAA | |
| tRNA-Ile | 3,857 | 3,927 | 71 | -1 | + | 3,857 | 3,927 | 71 | -1 | 0 | |||||
| tRNA-Gln | 3,927 | 3,997 | 71 | -1 | - | 3,927 | 3,997 | 71 | -1 | 0 | |||||
| tRNA-Met | 3,997 | 4,065 | 69 | 0 | + | 3,997 | 4,065 | 69 | 0 | 0 | |||||
| ND2 | 4,066 | 5,111 | 1,046 | 0 | ATG | TA | + | 4,066 | 5,111 | 1046 | 0 | 0 | ATG | TA | |
| tRNA-Trp | 5,112 | 5,183 | 72 | 1 | + | 5,112 | 5,183 | 72 | 1 | 0 | |||||
| tRNA-Ala | 5,185 | 5,253 | 69 | 1 | - | 5,185 | 5,253 | 69 | 1 | 0 | |||||
| tRNA-Asn | 5,255 | 5,327 | 73 | 38 | - | 5,255 | 5,327 | 73 | 38 | 0 | |||||
| tRNA-Cys | 5,366 | 5,431 | 66 | 0 | - | 5,366 | 5,430 | 65 | 0 | 1 | |||||
| tRNA-Tyr | 5,432 | 5,499 | 68 | 1 | + | 5,431 | 5,498 | 68 | 1 | 0 | |||||
| COX1 | 5,501 | 7,051 | 1,551 | 0 | GTG | TAG | + | 5,500 | 7,050 | 1,551 | 0 | 0 | GTG | TAG | |
| tRNA-Ser | 7,052 | 7,122 | 71 | 12 | - | 7,051 | 7,121 | 71 | 12 | 0 | |||||
| tRNA-Asp | 7,135 | 7,205 | 71 | 8 | + | 7,134 | 7,204 | 71 | 7 | 0 | |||||
| COX2 | 7,214 | 7,904 | 691 | 0 | ATG | T | + | 7,212 | 7,902 | 691 | 0 | 0 | ATG | T | |
| tRNA-Lys | 7,905 | 7,977 | 73 | 1 | + | 7,903 | 7,975 | 73 | 1 | 0 | |||||
| ATP8 | 7,979 | 8,146 | 168 | -10 | ATG | TAA | + | 7,977 | 8,144 | 168 | -10 | 0 | ATG | TAA | |
| ATP6 | 8,137 | 8,819 | 683 | 0 | ATG | TA | + | 8,135 | 8,817 | 683 | 0 | 0 | ATG | TA | |
| COX3 | 8,820 | 9,604 | 785 | 0 | ATG | TA | + | 8,818 | 9,602 | 785 | 0 | 0 | ATG | TA | |
| tRNA-Gly | 9,605 | 9,676 | 72 | 0 | + | 9,603 | 9,674 | 72 | 0 | 0 | |||||
| ND3 | 9,677 | 10,025 | 349 | 0 | ATG | T | + | 9,675 | 10,023 | 349 | 0 | 0 | ATG | T | |
a“Intergene nucleotides” corresponds to the number of nucleotides separating adjacent genes. Negative numbers indicate overlapping nucleotides.
b Size difference between genes of the Californian halibut, P. californicus, and the Japanese halibut, P. olivaceus.
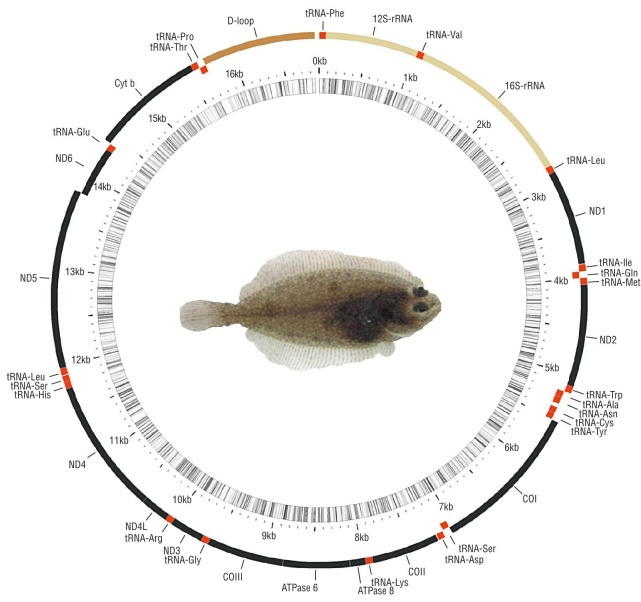
Figure 1 Complete mitochondrial genome of the California halibut, Paralichthys californicus, accession number MT859134.
The phylogenetic tree built with the mitogenomes of dif ferent species of the order Pleuronectiformes (including flatfish) was rooted to Beryx mollis and contains representatives of 2 suborders: Psettodoidei and Pleuronectoidei (Fig. 2). The former includes primitive flatfish in a single family, 1 genus (Psettodes), and 3 living species (according to WoRMS Editorial Board 2020). Currently, Pleuronectoidei comprises 14 families with 134 genera and over 7,000 species (Campbell et al. 2014); however, the number of complete mitochondrial genomes for flatfish species available for comparison is limited. In the present analysis, we included 11 mitogenomes of Pleuronectoidei species belonging to 2 families: Pleuronectidae and Paralichthyidae. Despite their high sequence similarity in the coding regions, all families were well resolved, as expected (Fig. 2). The mitogenome of the Californian halibut, P. californicus, was most similar to that of the Japanese halibut, P. olivaceus, as would be expected given their respective geographic distribution (Table1).
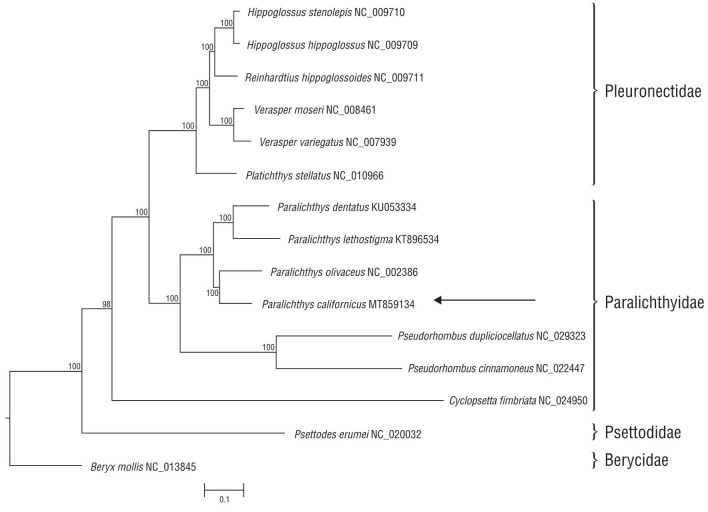
Figure 2 Phylogenetic relationship derived from the best-fit model (GTR+G+I) analysis based on complete mitochondrial genomes for three families of Pleuornectiformes (flatfish). Bayesian inference using Beryx mollis as outgroup and root. Arrows points to P. californucus from this study. Node support given as percentage.
Considering our findings, it can be concluded that the mitogenome of the California halibut, P. californicus, is 16,858 bp in length and contains 13 protein-coding genes, 22 tRNAs, 2 rRNAs, and the control region. The distribution and orientation of protein-coding genes, tRNAs, rRNAs, and the control region of P. californicus were very similar to those in mitogenomes of other flatfish species. The phyloge netic-tree analysis of the families in the order Pleuornectiformes (flatfish) was well resolved. The mitogenome of the California halibut, P. californicus, was most similar to that of the Japanese halibut, P. olivaceus. Further genetic work on this genus is needed, particularly for P. californicus.

