


 nova página do texto(beta)
 Inglês (pdf)
 Artigo em XML
 Referências do artigo
 Enviar este artigo por email
 Citado por SciELO
  Similares em
SciELO
Similares em
SciELO 
 Permalink
INTRODUCTION
The Tropical Eastern Pacific (TEP), a marine region that runs from the Gulf of California to northern Peru, is char acterized by high endemism of coastal marine species on both regional and local scales because of its relative isola tion (Briggs 1974, Grigg and Hey 1992, Allen and Robertson 1994, Hastings 2000, Hastings and Robertson 2001, Nasar et al. 2016). Many islands throughout this region have been identified as “stepping stones” of shallow water habitat, facil itating the movements and migrations of mobile fish species as well as larval dispersal throughout the TEP (Ketchum and Reyes-Bonilla 1997, 2001). The region is also home to many iconic species such as migratory sharks and sea turtles which are groups of conservation concern (CONANP-SEMARNAT 2010). In recognition of the importance of biodiversity in this region, several islands and archipelagos within the TEP have been the subject of recent conservation efforts (Ketchum and Reyes-Bonilla 1997, Jones 2013, Friedlander et al. 2019, Morales-de-Anda et al. 2020), while others remain virtually unstudied.
In this study we examine the biodiversity and commu nity structure of fishes and the emergent habitat correla tions at the uniquely positioned and largely understudied Islas Marías (Mexico), an archipelago in the TEP. Also known as the Tres Marías Islands, Islas Marías is located ~132 km offshore of Nayarit state, in a position centrally located between northern and southern marine biore gions (Fig. 1) (Robertson and Cramer 2009, CONANP-SEMARNAT 2010). The archipelago’s high biodiversity and rates of endemism in both the marine and terrestrial realms attracted the attention of both national and interna tional conservation groups, and it was declared a UNESCO World Heritage Site in 2010 following its designation as a Biosphere Reserve (Mexico) in 2000 (CONANP-SEMARNAT 2010, UNESCO 2012). However, the unique history of the archipelago may have restricted the exploita tion of the abundant marine resources since long before the establishment of the reserve (CONANP-SEMARNAT 2010). The largest of the 4 islands, Isla María Madre, served as the site of the Federal Penitentiary of Mexico from 1905 to 2019, and the restricted access coupled with enforcement through military occupation may have functioned as a de facto marine reserve for all 4 islands (CONANP-SEMARNAT 2010, Times 2019). Despite this, 2 activities may have threatened the preservation of marine species at Islas Marías. First, domestic fishing, “exclu sively with manual lines and for the development of the Penitentiary Complex”, was permitted within certain zones of the Biosphere Reserve (CONANP-SEMARNAT 2011). Second, there is evidence of shark fishing at Islas Marías in both recent (Pérez-Jiménez et al. 2005) and historical con texts, traceable back to the 1940s, and a high demand for shark liver oil (McGoodwin 1976).
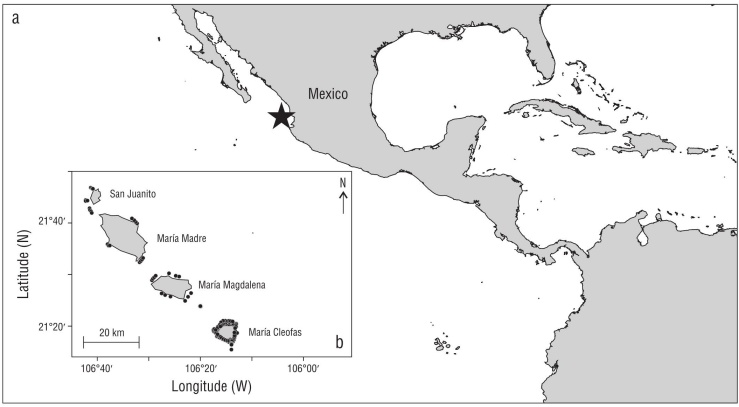
Figure 1 (a) A map of the Tropical Eastern Pacific (TEP) region, with the star representing the location of Islas Marías within the TEP. (b) The study location at Islas Marías Biosphere Reserve, Mexico. We analyzed 131 BRUV surveys from all 4 islands in the archipelago, but surveys were most spatially intensive at Isla María Cleofas, the southernmost island. Black dots represent the locations of all BRUV surveys.
Due to the long-time restricted nature of the archipelago, the available scientific research on the marine ecosystems of Islas Marías is extremely limited (CONANP-SEMARNAT 2010). As the most recent census of fishes was published in 2011 (Erisman et al. 2011), the primary objective of this study was to establish basic ecological data (occurrence and abun dance) for the coastal marine fishes of Islas Marías. Baited remote underwater video (BRUV) surveys were chosen as a non-invasive, easily repeatable method for evaluating fish populations (Harvey and Shortis 1996, MacNeil et al. 2020) in such a way that aims to maximize observations of large predators (i.e., sharks) that tend to avoid divers (Willis and Babcock 2000, Colton and Swearer 2010) and nocturnal predators that may be attracted to the bait (Bassett and Montgomery 2011). The secondary objective of this study was to examine the effects of habitat and depth on biodiver sity and fish community assemblage. Considering previous assessments on community structure and biodiversity in the TEP (Aburto-Oropeza and Balart 2001, Charles and Denice 2002, Dominici-Arosemena and Wolff 2006, Palacios and Zapata 2014), we hypothesized that biodiversity would vary significantly between all habitat types (reef, patchy, cobble, sand, and water column) and that community assemblages at different habitats and depths would also prove significantly different from one another.
This study comes shortly after the declaration of Islas Marías as a natural preserve and conservation area in March 2019, which initiated the relocation of the federal peni tentiary to the mainland (Rodríguez-Mega 2019). With the removal of the prison, there is an opportunity for Islas Marías to become a priority area for marine conservation efforts in Pacific waters off Mexico. Therefore, the final intention of this assessment is to inform future plans for pro tecting the marine areas and vital ecological interactions at Islas Marías.
MATERIALS AND METHODS
BRUV unit deployment
In 2018 three single-camera BRUV units were deployed repeatedly during 3 separate expeditions to Islas Marías in March (n = 30), June (n = 52), and late July/early August (n = 49). Each unit contained a GoPro Hero 4 video camera in underwater housing rated to 40 m and was baited with 1 kg of local reef fish, cut and contained within a semi-mesh bait canister to allow a bait plume to form (Fig. 2). By design, the units floated approximately 1 m off the substrate. BRUV surveys were allowed to record on the bottom for a soak time of approximately 60 min, although the soak time varied between videos and in all cases, the entirety of the video was viewed. In order to ensure independence of rep licate surveys, BRUV units were positioned at least 700 m apart. While more testing is needed in the range of attrac tion of bait plumes, Cappo et al. (2004b) devised a formula using factors such as soak time, local currents, and the body lengths and swimming speeds of fishes. Considering those calculations (and a soak time of 60 min), the authors opted to space the BRUV units 450 m apart (Cappo et al. 2004b) . The BRUV surveys were set at depths between 5 and 40 m during daylight hours (06:00 AM to 18:00 PM). In total, 131 BRUV drops were watched: 97 at María Cleofas, 12 at María Madre, 11 at María Magdalena, 6 at San Juanito, 4 in the channel between San Juanito and María Madre, and 1 without GPS coordinates (Fig. 2). Of these, 9 did not observe any fish.
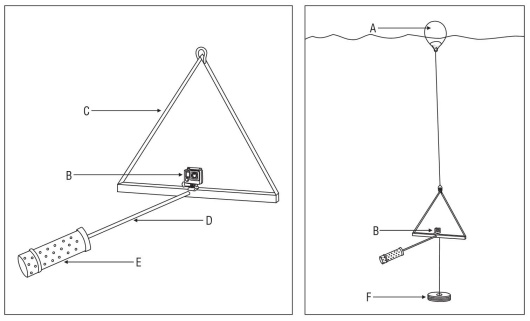
Figure 2 Diagram of the typical BRUV unit deployed at Islas Marías. A surface float (A) marks the location of each BRUV unit. The single camera (B) is a GoPro Hero 4 in underwater housing rating to 40 m. The camera is mounted to a metal frame (C). The bait arm (length = 1m) (D) extends within view of the camera. Either a semi-mesh bait canister or mesh bait bag (E) contains 1 kg of local reef fish. An anchor (F) keeps the unit positioned ~1 m off the substrate.
Video analysis
The videos recorded by the BRUV surveys were ana lyzed using SeaGIS EventMeasure v.5.32 software. All fishes observed were identified to the lowest taxonomic group according to Robertson and Allen (2015). In order to quantify fishes, we recorded the maximum number of individuals of a species present in a single frame (Nmax) (Willis and Babcock 2000). Without the ability to discern individuals or distinguish multiple sightings of the same fish, Nmax is typically used in BRUV analysis as a conser vative measure of abundance (Willis and Babcock 2000). The mean video length was ~71 min and the mode was 64 min. There was no significant trend in the relationship between drop biodiversity and video length (as measured by bottom time).
In order to make comparisons between fish communities, one of 4 benthic habitat categories was assigned to each video based on the amount of rock visible. The “reef” category (n = 41) was defined as habitat where the clear majority of cover was either bedrock or large boulders-any habitat with visible relief and little to no visible sand. “Patchy” (n = 20) was defined as habitat that may have had significant relief due to large boulders but also contained large patches of sand (~50%-80% cover sand). “Cobble” (n = 15) substrate was defined by a majority (>50%) cover of coral rubble, small rocks, and shell fragments. “Sand” (n = 32) habitat had zero relief and no appearance of reef or large swaths of cobble within view. A fifth category, “water column,” (n = 23), was assigned to drops that were positioned in the midwater with no benthic substrate visible.
Abundance and frequency of occurrence
As a measure of abundance, the mean Nmax for each species was calculated over all 121 surveys, including those in which the particular species was absent (includes zeroes), and these values were used in all statistical analyses. We also standard ized Nmax relative to the most abundant member in each tro phic group and used these values only for a comparison with frequency of occurrence (Fig. 3, see Aburto-Oropeza et al. 2001). Trophic groups were assigned using diet informa tion from FishBase and Robertson and Allen (2015). Group I comprised herbivores, planktivores, and low-level omnivores (i.e., diet consists of algae, plankton, sponges, tunicates, bryozoans, hydroids, or other sessile invertebrates). Group II comprised low-level predators (i.e., diet consists of benthic mobile invertebrates, including crustaceans, echinoderms, mollusks, and cephalopods). Group III comprised mid-level and top-level predators (i.e., piscivores).
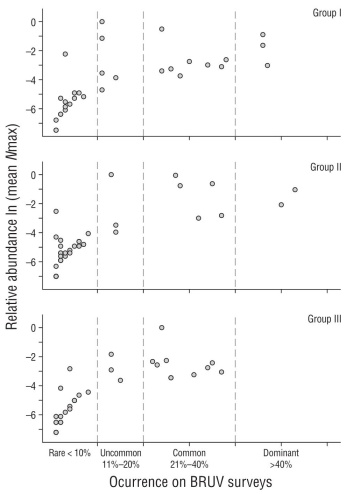
Figure 3 The relationship between frequency of occurrence (% BRUV surveys present on) and relative abundance (mean Nmax) on a log scale for groups I, II, and III. Group I: herbivores, planktivores, and low-level omnivores (i.e., diet consists of algae, plankton, sponges, tunicates, bryozoans, hydroids, or other sessile invertebrates). Group II: low-level predators (i.e., diet consists of benthic mobile invertebrates including crustaceans, echinoderms, mollusks, and cephalopods). Group III: mid-level and top-level predators (i.e., piscivores). Occurrence categories are as follows: rare (≤10% of surveys), uncommon (11%-20% of surveys), common (21%-40% of surveys), dominant (>40% of surveys).
The frequency of occurrence was calculated for each spe cies to describe how prevalent a particular species was in our study and was defined as the percentage of surveys on which a species was observed. Species were grouped into 4 occurrence categories based on natural separations in the data: rare (≤10% of surveys), uncommon (11%-20% of sur veys), common (21%-40% of surveys), dominant (>40% of surveys).
Variation in community assemblages
Nonmetric multidimensional scaling (nMDS) was used to visualize differences in the fish communities. Only spe cies with at least 5 individuals observed throughout our study were included, and only surveys that observed at least 1 fish from the reduced species list were used (71 species and 119 drops). Nmax values were fourth root transformed and a Bray-Curtis dissimilarity was calculated to compare fish communities recorded on each video survey. To better visu alize any relationships with habitat, convex hulls based on habitat category were added. A two-way permutational mul tivariate analysis of variance (PERMANOVA) test with 999 permutations was performed to test for differences in com munity assemblage by habitat and depth. In order to assess differences between habitats, and particularly to assess the dissimilarity between reef and patchy communities, the PERMANOVA was also used to make pairwise compari sons among all habitat types. Sixteen BRUV surveys did not have depth data and were excluded from the PERMANOVA analysis for a total of 103 drops. Reported P-values from the pairwise comparisons use the Bonferroni correction for mul tiple comparisons. All multi-variate analyses were done in R v.4.0.1 using the metaMDS function in the Vegan package v.2.5-6 (R Core Team 2018).
Biodiversity and species richness
We calculated the Shannon diversity index (H′) for each drop using the equation below, where pi is the proportion of individuals of species i to the total number of individuals:
To test for differences in biodiversity by habitat, we employed a pairwise Wilcoxon rank sum test in R v.4.0.1 stats package. Reported P-values have the Bonferroni adjust ment for multiple comparisons. We mapped species richness, H′ and habitat type at Isla María Cleofas, where surveys were most spatially intensive and nearest to shore (n = 89 nearshore drops around Isla María Cleofas of 97 total drops) (Fig. 1).
Spatial distribution of sharks
Due to the long history of shark fishing at Isla María Cleofas (McGoodwin 1976), and to more recent evidence that shark fishing continues at nearby Isabel Island and per haps all of Islas Marías as well (Pérez-Jiménez et al. 2005), we were particularly interested in the shark species at Islas Marías. In addition to the analyses described above, we aimed to discover (1) what shark species are present at Islas Marías and (2) what the spatial distributions of these species were within the context of Islas Marías. By disaggregating the spatial distribution of sharks and specifically discussing the results, our goal is to aid future monitoring and conserva tion efforts of the important apex predators.
RESULTS
Abundance and frequency of occurrence
Ninety-nine fish species from 35 families were identified from the BRUV surveys (Table 1). Carangidae (jacks) and Labridae (wrasses) were the most speciose families with 13 and 12 species, respectively. Lutjanidae (snappers) followed with 7 species and Haemulidae (grunts), Pomacentridae (damselfishes), and Serranidae (groupers) had 6 species each. In terms of frequency of occurrence, 5 species were dominant: Balistes polylepis (finescale triggerfish), Sufflamen verres (orangeside triggerfish), Arothron meleagris (guineafowl puffer), Acanthurus xanthopterus (yellowfin surgeonfish), and Prionurus punctatus (yellowtail surgeonfish). These are all conspicuous reef-associated fish in trophic groups I and II, feeding mainly on benthic invertebrates. Group III (pisciv ores) did not contain any dominant species (Fig. 3). Overall, 23 species were common, 11 were uncommon, and 60 were rare.
Table 1 List of coastal marine fishes at Islas Marías, Mexico, as determined by BRUV surveys, inclusive of “water column” drops and shark tagging efforts during the same time period. Families are ordered alphabetically within groups. Group I: herbivores, planktivores, and low-level omnivores (i.e., diet consists of algae, plankton, sponges, tunicates, bryozoans, hydroids, or other sessile invertebrates). Group II: low-level predators (i.e., diet consists of benthic mobile invertebrates including crustaceans, echinoderms, mollusks, and cephalopods). Group III: mid-level and top-level predators (i.e., piscivores). Occurrence (%) = percent of BRUV surveys on which the species was observed. Occurrence (Category) is based on percent occurrence: rare (≤10% of surveys), uncommon (11%-20% of surveys), common (21%-40% of surveys), dominant (>40% of surveys). Mean Nmax is the maximum number of individ uals in each species per drop, averaged over all 121 drops with fish present, inclusive of zeroes. • = observed on tagging study. Bolded species were previously unlisted on Erisman et al. (2011). Bolded and starred species are range extensions. Starred species names are a combined species category.
| Group | Family | Species | Common name | Common name in Nayarit/Jalisco |
Occurrence (%) |
Occurrence (Category) |
mean Nmax |
| I | Acanthuridae | Prionurus punctatus | Yellowtail surgeonfish | Barbero cochinito/calandria | 46 | D | 5.95 |
| Acanthurus xanthopterus | Yellowfin surgeonfish | Barbero aleta amarilla/cirujano/ navajero | 46 | D | 2.84 | ||
| Acanthurus nigricans | Whitecheek surgeonfish | Barbero carablanca | 14 | U | 0.31 | ||
| Balistidae | Melichthys niger | Black triggerfish | Puerco/bota | 1 | R | 0.01 | |
| Carangidae | Decapterus muroadsi | Amberstripe scad | 11 | U | 14.55 | ||
| Chaetodontidae | Johnrandallia nigrirostris | Blacknosed butterflyfish | Mariposa barbero | 30 | C | 0.93 | |
| Chaetodon humeralis | Threeband butterflyfish | Mariposa tres bandas | 34 | C | 0.74 | ||
| Forcipiger flavissimus | Longnose butterflyfish | 6 | R | 0.11 | |||
| Chanidae | Chanos chanos | Milkfish | Sábalo | 2 | R | 0.07 | |
| Kyphosidae | Kyphosus ocyurus | Bluestriped chub | Verdecillo | 3 | R | 1.56 | |
| Kyphosus elegans/Kyphosus vaigiensis* | Cortez sea chub/brassy chub | Chopa/cagona/chopa gris/ chopa rayada/cagona | 28 | C | 0.35 | ||
| Monacanthidae | Aluterus scriptus | Scribbled leatherjacket filefish | Huarache/bota pinta | 11 | U | 0.13 | |
| Aluterus monoceros | Unicorn leatherjacket filefish | Bota de altura/lija | 3 | R | 0.06 | ||
| Ostraciidae | Ostracion meleagris | Whitespotted boxfish | Cofre moteado | 2 | R | 0.02 | |
| Pomacanthidae | Holacanthus passer | King angelfish | Ángel real | 37 | C | 0.65 | |
| Pomacanthus zonipectus | Cortez angelfish | Ángel | 7 | R | 0.08 | ||
| Pomacentridae | Chromis atrilobata | Scissortail damselfish | Cola de tijera | 11 | U | 4.63 | |
| Stegastes flavilatus | Beaubrummel | Damisela cola amarilla | 26 | C | 0.56 | ||
| Abudefduf troschelli | Panamic sergeant major | Petaca banderita | 11 | U | 0.42 | ||
| Stegastes acapulcoensis | Acapulco major | Damisela agricultor | 5 | R | 0.11 | ||
| Microspathodon dorsalis | Giant damselfish | Damisela gigante | 5 | R | 0.07 | ||
| Chromis limbaughi | Limbaugh's damselfish | Castañeta mexicana | 1 | R | 0.02 | ||
| Scaridae | Scarus rubroviolaceus | Ember parrotfish | Loro bicolor/logro violáceo | 38 | C | 1.06 | |
| Scarus perrico | Bumphead parrotfish | Loro jorobado/perico | 4 | R | 0.05 | ||
| Calotomus carolinus* | Carolines parrotfish | 3 | R | 0.04 | |||
| Scarus compressus | Azure parrotfish | Loro chato/guacamaya | 1 | R | 0.01 | ||
| Serranidae | Paranthias colonus | Pacific creolefish | Coloradito/viejita | 24 | C | 8.74 | |
| Tetradontidae | Arothron meleagris | Guineafowl puffer | Botete aletas punteadas | 47 | D | 0.71 | |
| Arothron hispidus | White-spotted puffer | Botete panza rayada | 3 | R | 0.03 | ||
| Canthigaster punctatissima | Spotted sharpnosed puffer | Botete bonito | 2 | R | 0.02 | ||
| Zanclidae | Zanclus cornutus | Moorish idol | Ídolo moro | 24 | C | 0.49 | |
| II | Balistidae | Balistes polylepis | Finescale triggerfish | Bota/pez puerco | 53 | D | 3.22 |
| Sufflamen verres | Orangeside triggerfish | Taxi/bota amarilla | 50 | D | 1.14 | ||
| Pseudobalistes naufragium | Stone triggerfish | Bota morada/capulina | 37 | C | 0.55 | ||
| Carangidae | Selar crumenophthalmus | Bigeye scad | Charrito ojón/ojotón | 1 | R | 0.12 | |
| Carangoides orthogrammus | Island trevally | Jurel isleño/verdecillo | 1 | R | 0.01 | ||
| Carangoides otrynter | Threadfin pompano | Pámpano de hebra | 1 | R | 0.01 | ||
| Dasyatidae | Dasyatis dipterura | Diamond stingray | 6 | R | 0.07 | ||
| Dasyatis longus | Longtail stingray | Raya látigo | 2 | R | 0.04 | ||
| Diodontidae | Diodon holocanthus | Longspined porcupinefish | Pez erizo mapache | 14 | U | 0.17 | |
| Chilomycterus reticulatus | Spotfin burrfish | 4 | R | 0.05 | |||
| Diodon hystrix | Spotfin porcupinefish | Pez erizo pecoso | 2 | R | 0.02 | ||
| Ephippidae | Chaetodipterus zonatus | Pacific spadefish | Mona/chavelito/zopilote negro | 2 | R | 0.04 | |
| Haemulidae | Haemulon maculicauda | Spottail grunt | Rasposa/burrito roncador | 13 | U | 9.10 | |
| Haemulon steindachneri | Chere-chere grunt | Burro latino/ronco amarillo | 1 | R | 0.73 | ||
| Haemulon sexfasciatum | Greybar grunt | Burro almejero/bacoco rayado | 14 | U | 0.28 | ||
| Haemulon flaviguttatum | Yellowspotted grunt | Burro de Cortés/ronco manchado | 2 | R | 0.07 | ||
| Anisotremus taeniatus | Panama porkfish | Chopilla/sol de China/comisario | 1 | R | 0.02 | ||
| Haemulon scudderii | Grey grunt | Burro pecoso/roncador pecoso | 1 | R | 0.01 | ||
| Labridae | Halichoeres dispilus | Chameleon wrasse | Camaleón | 27 | C | 8.67 | |
| Thalassoma lucasanum | Cortez rainbow wrasse | Arcoíris | 28 | C | 4.23 | ||
| Halichoeres nicholsi | Spinster wrasse | Solterona | 32 | C | 0.45 | ||
| Halichoeres chierchiae | Wounded wrasse | Señorita herida | 8 | R | 0.16 | ||
| Novaculichthys taeniourus | Rockmover wrasse | 6 | R | 0.09 | |||
| Thalassoma grammaticum | Sunset wrasse | 6 | R | 0.09 | |||
| Halichoeres adustus | Black wrasse | Señorita negra | 7 | R | 0.07 | ||
| Halichoeres notospilus | Banded wrasse | Señorita listada | 3 | R | 0.03 | ||
| Halichoeres melanotis | Golden wrasse | 2 | R | 0.02 | |||
| Halichoeres insularis | Socorro wrasse | 1 | R | 0.01 | |||
| Iniistius pavo | Peacock wrasse | Cuchillo pavo real | 1 | R | 0.01 | ||
| Mullidae | Mulloidichthys dentatus | Mexican goatfish | Chivo/salmonete barbón | 35 | C | 4.87 | |
| Pseudupeneus grandisquamis | Bigscale goatfish | 2 | R | 0.10 | |||
| Myliobatidae | Rhinoptera steindachneri | Pacific cownose ray | 2 | R | 0.02 | ||
| Priacanthidae | Heteropriacanthus cruentatus | Glasseye snapper | Sol ojón | 1 | R | 0.01 | |
| Serranidae | Alphestes immaculatus | Pacific mutton hamlet | Guaseta/granada/jabonero | 5 | R | 0.07 | |
| Alphestes multiguttatus | Rivulated mutton hamlet | 2 | R | 0.03 | |||
| Tetradontidae | Sphoeroides lobatus | Longnose puffer | Botete verrugoso | 3 | R | 0.04 | |
| Torpedinidae | Narcine entemedor | Giant electric ray | Guitarra eléctrica | 4 | R | 0.04 | |
| III | Belonidae | Strongylura exilis | Californian needlefish | Agujón/pez de aguja | 1 | R | 0.01 |
| Bothidae | Bothus leopardinus | Pacific leopard flounder | 1 | R | 0.02 | ||
| Carangidae | Caranx caballus | Green jack | Chile verde/cocinero | 13 | U | 1.79 | |
| Caranx melampygus | Bluefin trevally | Pantalón | 22 | C | 1.09 | ||
| Caranx sexfasciatus | Bigeye trevally | Ojo de perra/jurel ojón | 2 | R | 0.17 | ||
| Seriola rivoliana | Longfin yellowtail | Medregal/castel | 8 | R | 0.13 | ||
| Gnathanodon speciosus | Golden trevally | Chocho amarillo/palometa | 6 | R | 0.11 | ||
| Alectis ciliaris | African pompano | Caballo | 3 | R | 0.03 | ||
| Elagatis bipinnulata | Rainbow runner | Albacora/macarela | 2 | R | 0.02 | ||
| Trachinotus rhodopus | Gafftopsail pompano | Palmilla/pámpano rayado | 1 | R | 0.02 | ||
| Caranx caninus | Pacific crevalle jack | Jurel toro | 1 | R | 0.01 | ||
| Carcharhinidae | Carcharhinus obscurus• | Dusky shark | Tiburón arenero,gambuso,obscure/ zarco | NA | NA | NA | |
| Galeocerdo cuvier• | Tiger shark | Tiburón tigre/tintorera | NA | NA | NA | ||
| Triaenodon obesus | Whitetip reef shark | Cazón coralero trompacorta/ tintorera punta aleta blanca | 4 | R | 0.04 | ||
| Fistulariidae | Fistularia commersonii/Fistularia corneta* | Bluespotted cornetfish/Pacific cornetfish | Corneta | 23 | C | 0.86 | |
| Ginglymostomatidae | Ginglymostoma unami | Nurse shark | Tiburón gata | 31 | C | 0.44 | |
| Labridae | Bodianus diplotaenia | Mexican hogfish | Vieja mexicana/perrita | 26 | C | 0.36 | |
| Lutjanidae | Lutjanus viridis | Blue and gold snapper | Cuico/rayito | 24 | C | 11.22 | |
| Lutjanus argentiventris | Yellow snapper | Parga/calandrio/alazán | 35 | C | 0.99 | ||
| Lutjanus inermis | Golden snapper | Sandiita/rubia | 4 | R | 0.66 | ||
| Lutjanus guttatus | Spotted rose snapper | Flamenco/lunarejo | 13 | U | 0.61 | ||
| Hoplopagrus guentherii | Mexican barred snapper | Coconaco/pargo rayado | 26 | C | 0.36 | ||
| Lutjanus novemfasciatus | Pacific dog snapper | Pargo colmillón/pargo mulato | 5 | R | 0.07 | ||
| Lutjanus aratus | Mullet snapper | 2 | R | 0.02 | |||
| Muraenidae | Gymnothorax castaneus | Panamic green moray | Morena verde | 37 | C | 0.53 | |
| Nemtistiidae | Nemastistius pectoralis | Roosterfish | Gallo/papagayo | 4 | R | 0.05 | |
| Rhinobatidae | Rhinobatos productus | Shovelnose guitarfish | Diablo | 1 | R | 0.01 | |
| Scombridae | Euthynnus lineatus | Black skipjack | Barrilete/bonito negro | 5 | R | 0.07 | |
| Scomberomorus sierra | Pacific sierra | Sierra/rerrucho | 1 | R | 0.02 | ||
| Serranidae | Cephalopholis panamensis | Pacific graysby | Enjambre/cuevero | 25 | C | 1.17 | |
| Epinephelus labriformis | Starry grouper | Maranguana | 34 | C | 0.71 | ||
| Serranus psittacinus | Barred serrano | Serrano | 15 | U | 0.30 | ||
| Urotrygonidae | Urobatis halleri | Round stingray | Raya redonda | 2 | R | 0.02 |
The most abundant species in each group were as follows (Table 1): group I = Decapterus muroadsi (amberstripe scad) (mean Nmax = 14.55, max Nmax = 900), group II = Haemulon maculicauda (spottail grunt) (mean Nmax = 9.10, max Nmax = 300), group III = Lutjanus viridis (blue and gold snapper) (mean Nmax = 11.22, max Nmax = 150) (Table 1). Other highly abundant species in group I were Paranthias colonus (Pacific creolefish) and P. punctatus; in group II, Halichoeres dispilus (Chameleon wrasse), Mulloidichthys dentatus (Mexican goatfish), and Thalassoma lucasanum (Cortez rainbow wrasse) (Table 1). In group III, only L. viridis was highly abundant. In total, 8 species were highly abun dant within their group, 33 species were moderately abun dant, and 58 species had low abundance.
Variation in community assemblages
We found strong separation between reef and sand com munities, while the 3 other communities (patchy, rubble, and water column) encompass a wider breadth of species present in this study (Fig. 4). These observations were supported by a PERMANOVA analysis that found a significant effect of habitat (P < 0.001) and depth (P < 0.001) (Table S1). A pairwise comparison of each habitat type showed a signif icant difference between all types except sand and water column (Table S2). The strong separation along the x-axis of the nMDS plot follows a general pattern of hard bottom, reef associated communities on the left and soft bottom, water column communities on the right. To explore the spe cies driving these communities, we added the top 10 species scores in each direction to the plot (i.e., lowest negative and highest positive x-axis values). The magnitude of a particular species score was represented by the length of each arrow (Fig. 4).
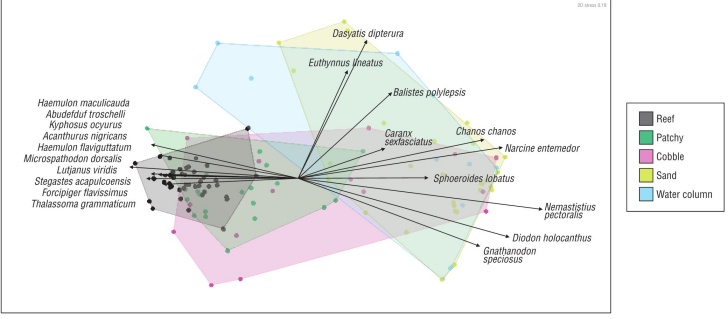
Figure 4 A non-metric multidimensional scaling (nMDS) plot of the Bray-Curtis dissimilarity of fish communities by habitat type. Data were fourth root transformed. Convex hulls encircle the outermost points of each habitat designation. The top 10 drivers of reef and sand communities (with the most negative and positive nMDS1 scores, respectively) are labeled, vectors to scale of nMDS1 scores.
Biodiversity and species richness
Shannon diversity indices plotted by habitat show a pro gression from highest biodiversity in hard-bottom habitat to lowest biodiversity in soft-bottom habitat (Fig. 5). In Figure 5, lines above particular habitats indicate pairs where we failed to detect a significant difference in observed diversity. We failed to detect a difference in the average H′ of 2 pairs: patchy and cobble, and sand and water column. Reef biodi versity was significantly greater than biodiversity in all other habitat types, although all habitat types had high variation, indicating that species are likely using multiple habitat types. Biodiversity in patchy and cobble habitats was significantly greater from sand and water column habitats.
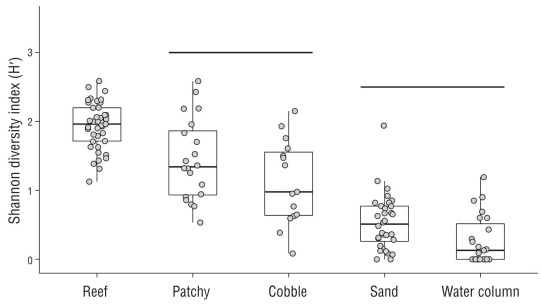
Figure 5 Boxplots of Shannon diversity indices by habitat. The lower and upper hinges represent the 25th and 75th percentiles and the middle line represent the median of the data. Points are jittered for better visualization. We ran a pairwise Wilcoxon rank sum test on the data; lines connect habitats that are not significantly different.
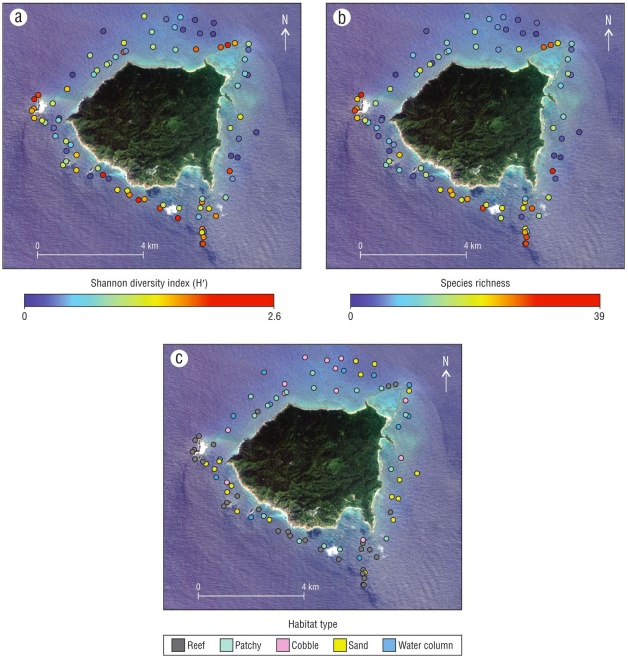
Biodiversity and species richness were not uniform around Isla María Cleofas, but rather showed distinct hotspots and cool spots (Fig. 6a, b). The northeast, the south, and the area around an offshore rock had the highest fish diversity and richness, which roughly corresponded to reef habitat (Fig. 6a, c). Conversely, the lowest diversity and rich ness areas roughly corresponded to sand habitat (Fig. 6a, c). The visual similarity in the 2 geographic patterns can be par tially attributed to the Shannon diversity index (H′), which accounts for both richness and evenness in a single metric.
Spatial distribution of sharks
The BRUV surveys observed 2 species of shark, both of which are reef-associated: Ginglymostoma cirratum (nurse shark) and Triaenodon obesus (whitetip reef shark). While T. obesus made an appearance in 4% of drops, G. cirratum was more common, occurring in 31% of drops and often interacting with the bait. Spatially, G. cirratum was present at all 4 islands and around most of the perim eter of Isla María Cleofas, except for a sandy patch along the eastern edge of the island (Fig. 7). Triaenodon obsesus was observed at María Madre (n = 12 drops) and María Cleofas (n = 97 drops), although never in a drop that did not also have G. cirratum present. In addition, 2 other shark species were observed while fishing and tagging sharks off María Cleofas:
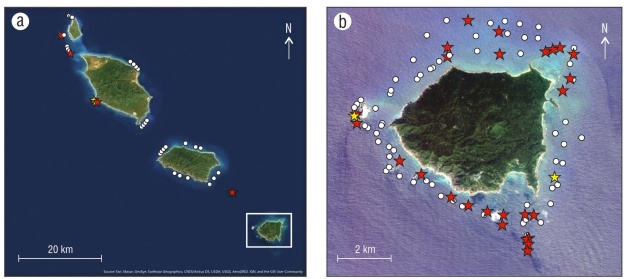
Figure 7 The spatial distribution of sharks at Islas Marías. Stars indicate drops where at least one shark species was present; white dots represent all other drops. Red stars indicate the presence of the Ginglymostoma cirratum (nurse shark). Yellow stars indicate the presence of Triaenodon obesus (whitetip reef shark) in addition to G. cirratum. There were no drops in which T. obesus was observed exclusively. (a) Full extent map and drops at the 3 northern islands of the Marías Archipelago. (b) Zoom-in to the 89 drops nearshore of Isla María Cleofas.
DISCUSSION
An overarching goal of this study was to provide bio logical data that could inform future management strategies at Islas Marías. The Islas Marías archipelago has been less well-studied than other offshore islands of Mexico (e.g., Revillagigedo Islands) and the TEP (e.g., Clipperton, Cocos, Malpelo, and Galapagos Islands) (Grove and Lavenberg 1997, Ketchum and Reyes-Bonilla 1997, Edgar et al. 2004, Bessudo et al. 2011, Friedlander et al. 2012, Quimbayom et al. 2017, Crane et al. 2018, Claudino-Sales 2019, Friedlander et al. 2019) despite the relative ease of access from main land Mexico. We added to the previous fish species list (Erisman et al. 2011) with observations of 3 new records. We also intensively surveyed one island, Isla María Cleofas, and provide detailed spatial information on fish diversity and habitat, observations that can be utilized for within island conservation and management decisions as well as guiding future marine research.
Our observation of higher fish diversity in habitats with greater amounts of rock supports an abundance of research that even a small amount of structure can positively influ ence biodiversity of reef fish communities (Roberts and Ormond 1987, McLain and Pratt 1999, Charles and Denice 2002). High-relief reefs may be a potentially high-value target for protection. The effect of intermediate amounts of rock (i.e., cobble and patchy habitats in this study) on biodi versity and fish community composition is less certain (Sale 1980, Charles and Denice 2002). We found that the island of María Cleofas contains a diversity of benthic habitat types-from extensive sandy areas to high-relief rock reefs and intermediate habitat types with cobble and patchy rock/ sand. While high-relief rock contained the greatest abun dance, diversity, and richness, the other habitats supported unique and important species as well. At María Cleofas, in particular, we show spatial “hot spots” that have high levels of diversity and species richness. These areas are often associated with hard-bottom and patchy substrates. In par ticular, we found high diversity and richness near 2 offshore emergent pinnacles in the west and the south of the island. The patterns we observed in diversity (H′) across habitat types were largely reflected in the community structure. The reef community differed from those in all other hab itat types, whereas the patchy and cobble communities were only marginally significantly different (Table S2) from one another and showed overlap in nMDS space with both reef and sand/water column. We also found, not surprisingly, that soft-bottom, sand communities are quite different in their composition. Sand and water column communities were characterized by rays (i.e., Dasyatis dipterura, Narcine ente medor), puffers and porcupine fish (i.e., Diodon holocanthus, Sphoeroides lobatus), and reef-associated pelagics (i.e., Nemastistius pectoralis, Gnathanodon speciosus, Chanos chanos, Caranx sexfasciatus, Euthynnus lineatus). As most of the species observed in the sand and water column (20 out of 22) were also observed on hard-bottom habitats (reef and patchy), the observed differences in community structure are likely not due to a novel suite of species in the sand and water column, but rather to a soft-bottom community that utilizes a variety of habitats.
Intermediate habitat types such as coral rubble, rocky cobbles, and patchy substrates are particularly interesting because these habitats may be increasing with environmental disturbances such as warming events causing deterioration of coral reefs (Glynn and Colgan 1992) and destructive fishing practices that can level structural components of reefs (Mangi and Roberts 2006). On the coast of Oaxaca, while mean fish abundance tended to increase with rock cover, fish biodiver sity increased in locations with increased amounts of coral rubble (López-Pérez et al. 2012). In our study cobble habitats showed an intermediate level of biodiversity, between reef and sand communities. Cobble communities occupied one of the widest community spaces on our nMDS plot, suggesting that if cobble substrate is becoming more prevalent in the TEP, it may still be able to support a wide breadth of the fish community. With potential for future habitat loss, studies that focus on the role of intermediate benthic substrates (such as patchy or cobble in this study) will be important in assessing fish communities and their ability to support historic levels of biomass and diversity.
BRUV method testing
In order the test the capabilities of the BRUV method in capturing reef community structure, the distribution- abundance relationship was plotted by trophic group in Figure 3. The BRUVs captured 3 broad trophic levels of fishes, from herbivores/omnivores to low-level predators to mid-level and top-level predators/piscivores. The relation ship between frequency of occurrence and relative abun dance within a trophic group follows the same general trends in all 3 trophic groups and is in line with community structure theory (Preston 1948). These observed trends are (1) most species cluster near the origin, occurring rarely and, when they do, in low abundance, and (2) occurrence and abun dance are positively correlated, indicating that only a few species dominate and occur in relatively high abundance. Although there was an extreme lack of top-level predators at Islas Marías (only T. obsesus and E. lineatus qualify), we have reason to believe this is an observed trend at Islas Marías (see: The richness (or lack thereof) of sharks) and that the BRUV surveys are useful in capturing a variety of community assemblages and trophic groups over a variety of habitats.
Novel observations
Three species observed on the BRUV surveys were absent from the previous list of fishes at Islas Marías (Erisman et al. 2011). These were Carangoides otrynter (threadfin pompano), S. lobatus (longnose pufferfish), and Calotomus carolinus (Caroline’s parrotfish). The differing life strategies of these species (a benthopelagic piscivore, omnivorous reef fish, and corallivore) suggest the ability of BRUV surveys to detect a variety of new species in a variety of habitats. While the ranges of C. otrynter and S. lobatus pre viously were supposed to include the islands (Robertson and Allen 2015), this is the first recording of C. carolinus within 90 km of the central Mexican mainland. Calotomus carolinus is present throughout the Indian and southern Pacific oceans, from Madagascar to the Galapagos Islands, and in Pacific waters off Mexico at the Revillagigedo Islands, Clipperton Atoll, and the southern tip of the Baja California Peninsula (Robertson and Allen 2015).
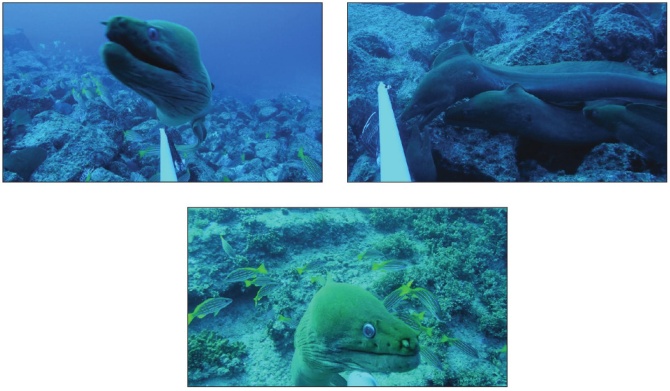
Notwithstanding previous (non-BRUV) studies in the TEP that either failed to observe Gymnothorax castaneus (Panamic green moray) or reported it as rare (Aburto-Oropeza and Balart 2001, Campos-Dávila et al. 2005, Erisman et al. 2011), G. castaneus occurred commonly on the BRUV sur veys. In fact, the nocturnal mesopredator was the seventh most frequently occurring species out of the 99 species observed. Although observed in low numbers, with a mean Nmax of 0.53 and a relative abundance of 0.05 in its group, G. castaneus individuals often interacted with the camera and bait in an aggressive manner (Fig. 8). With the advan tage of bait, BRUV surveys tend to attract significantly more olfactory species than diver surveys, and in particular, this result supports evidence that BRUVs lure moray eels out of their diurnal hiding places (Bardach et al. 1959, Bassett and Montgomery 2011). In addition to establishing more accu rate baselines of cryptic fishes, estimating the abundances of morays more accurately through BRUV analysis may better detail the effects of the removal of apex predators in Pacific waters off Mexico, as there is some speculation that as coastal shark populations decline worldwide (MacNeil et al. 2020), eels may become increasingly abundant and important pred ators (Pinheiro et al. 2017).
The richness (or lack thereof) of sharks
Previous studies indicate that Islas Marías is within the natural ranges of 21 species of shark present elsewhere in the TEP (Robertson and Allen 2015). Yet, many large shark species known to be present in the region were not observed either in our BRUV surveys or in parallel shark tagging efforts during the expeditions, despite the pre vious success of BRUV surveys in evaluating shark popu lations worldwide (Cappo et al. 2004a, Bradley et al. 2017, MacNeil et al. 2020). While tagging efforts resulted in observations of one dusky shark (Carcharhinus obscurus) and 5 tiger sharks (Galeocerdo cuvier), the BRUV surveys only observed 2 species of shark, Ginglymostoma cirratum (nurse shark) and T. obesus (whitetip reef shark), both which are reef-associated. The latter is not surprising considering that BRUV surveys were designed to target benthic fish communities. However, 22 BRUV drops viewed the water column at Isla María Cleofas, a historical shark fishing ground (McGoodwin 1976), and these, too, failed to detect any large pelagic sharks. Erisman et al.’s 2010 expedition also observed far fewer pelagic sharks than expected, only 2 scalloped hammerheads (Sphyrna lewini) and 1 bull shark (Carcharhinus leucas) in addition to the reef-associated G. cirratum and T. obsesus (Erisman et al. 2011). The low abundance of sharks, when considered jointly with the evi dence of ongoing shark-fishing in the area (Pérez-Jiménez et al. 2005, CONANP-SEMARNAT 2010), seems to indicate local overfishing of these slow-growing predators. This growing body of evidence raises concerns about the conser vation merits of the Biosphere Reserve, and it is apparent that future monitoring efforts will need to employ various techniques to detect changes in apex predator populations.
Conservation recommendations
Recently, Islas Marías was declared a natural preserve and conservation area, including planning for the relocation of the Federal Penitentiary to the mainland (Rodríguez-Mega 2019). The opportunity now exists for Islas Marías to become a priority area for marine conservation efforts in Pacific waters off Mexico. Our study highlights the presence of a diverse fish community, but we also note signs of overfishing despite the multiple reserve designations (Mexico Biosphere Reserve and UNESCO World Heritage Site) and the reputa tion as a de facto reserve of the “prison islands.” The lack of sharks in our BRUV surveys and our tagging efforts was particularly concerning in that many well-protected off shore islands and reefs in Mexico, such as Revillagigedo (Becerril‐García et al. 2020, Ketchum et al. 2020) and Cabo Pulmo (Ketchum et al. 2020), show much higher shark abun dance. Further research is necessary to better understand the causes of such observations. In particular, it is necessary to assess the effect of global change and local-scaled anthro pogenic threats including but not limited to legal and illegal fishing, sportfishing, and other tourism activities. Addition ally, future studies should assess the seasonal and long-term annual variability of fishes at Islas Marías, in relation to sea sonal upwelling events, interannual El Niño/Southern Oscil lation events, and other oceanographic factors, which may impact fish community assemblages and functional compo sition (Lopez-Sandoval et al. 2009, Morales-de-Anda et al. 2020).
Due to its distance from the coast, and the absence of large human population centers, this archipelago has the potential to become an emblematic site for marine conserva tion in Mexico. However, its current and future marine con servation status seems uncertain. Our study will aid in the development of appropriate management strategies tailored to the spatial characteristics of the area and will also help in promoting conservation efforts in this archipelago.

