


 nueva página del texto (beta)
 Inglés (pdf)
 Artículo en XML
 Referencias del artículo
 Enviar artículo por email
 Citado por SciELO
  Similares en
SciELO
Similares en
SciELO 
 Permalink
INTRODUCTION
Soft bottoms concentrate a high diversity, richness, and abundance of fish and invertebrate species (Bianchi et al. 2000, Ruiz-Rodríguez et al. 2013). Benthic macrofauna con- tribute high percentages of energy to a system by recycling nutrients depositing from the pelagic zone and they are a food source for a large number of fishes that inhabit soft bot- toms (Link et al. 2002).
The study of the ecological interactions of soft-bottom dwelling species contributes to the understanding of the structure, dynamics, and diversity of a community and the productivity of an ecosystem (Link et al. 2005, Dell et al. 2013). Fluctuations in the structure of benthic and demersal communities are caused by environmental variables (e.g., temperature, salinity, depth, etc.), the natural disturbance regime (Thrush et al. 1996, Godínez-Domínguez and Freire 2003), and anthropogenic impacts (e.g., from pollution, changes to and development over the seafloor, and fishing) (Dell et al. 2013, Ruiz-Rodríguez et al. 2013). The main ecological interactions stem from the need to share a habitat and resources (Ross 1986). Changes in prey availability and abundance and in oceanographic conditions are some of the top factors affecting ecological and trophic interactions between species in marine environments (Rau et al. 2019).
The feeding strategies of fish inhabiting soft bottoms are a result of morphological and physiological adaptations and temporal variability of food resources (Espinoza et al. 2013, Flores-Ortega et al. 2014). The evolution of species has been key for adapting to drastic changes in the availability and abundance of trophic resources (Lucena et al. 2000, Carrassón and Cartes 2002), hence the emergence of strategies that prevent species from competing for resources (habitat and food) with other organisms, and these strategies are important in understanding the shared use of resources in soft-bottom habitats (Lucena et al. 2000, Moura et al. 2008).
On the Pacific coast of central Mexico (PCCM), studies on the trophic interactions between demersal fish species are scarce (Pérez-España et al. 2005; Aguilar-Palomino and González-Sansón 2010; Flores-Ortega et al. 2011, 2013) because research has focused on describing the diet composition of, almost always, one species at a time. The present study is the first to analyze the trophic interactions in a group of 11 species comprising the bulk of abundance and biomass in the community of soft-bottom demersal fish in the PCCM; the study also determines trophic niche breadth, the degree of dietary overlap, and the patterns of similarity in the associations of prey making up the diet of the fishes and the seasonal variation of these interactions.
MATERIALS AND METHODS
Study area
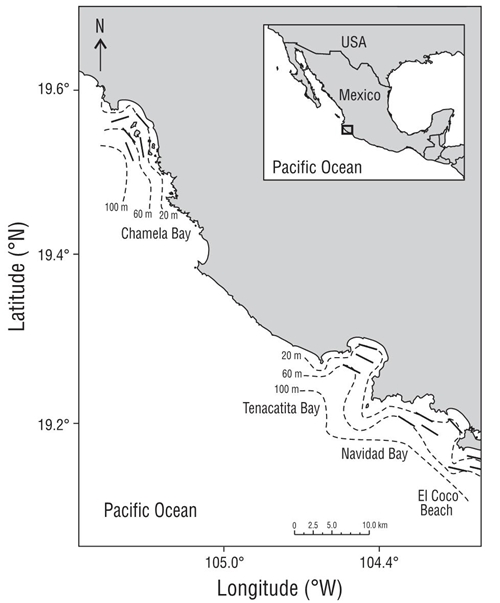
The study area is located on the southernmost limit of the coast of the state of Jalisco, in the PCCM, from Coco Beach to Chamela Bay (Fig. 1). A conspicuous seasonal hydroclimatic cycle prevails in this region, which influences benthic and demersal environments (Godínez-Domínguez et al. 2009). During the intense upwelling period-cold period- which spans from February to May, high chlorophyll a concentrations and primary productivity rates predominate; this period is followed by a period of transition and upwelling relaxation (June). During July to November-warm period- the water column stratifies and chlorophyll a concentrations drop, as do primary productivity rates (López-Sandoval et al. 2009a, b). In general, the hydroclimatic seasonality pattern changes coastal processes (Filonov et al. 2000, Kessler 2006) and determines the recomposition of coastal fish communities (Godínez-Domínguez et al. 2000) and soft-bottom benthic macroinvertebrates (Godínez-Domínguez et al. 2009).
Sampling and sample collection
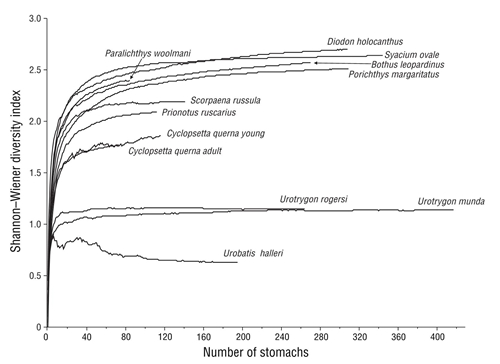
Between October 2007 and May 2010, 67 trawls were carried out on board the vessel BIP V at 4 sampling sites (Coco Beach, Navidad Bay, Tenacatita Bay, and Chamela Bay). The trawls were done at night for 30 min using 2 trawl nets (one on each side of the vessel) similar to those used in commercial shrimp fishing on the Pacific coast of Mexico, with mouth width of 6.9 m and mesh size of 38 mm at the codend. Fishes were separated from the rest of the catch for taxonomic identification at the species level. For each captured specimen, total length (cm) and total weight (g) were recorded and dissection was made to extract the stomach, which was frozen (-4 ºC) for subsequent analysis in the lab- oratory. Fish stomachs were grouped by species and season (cold from January to June and warm from July to December). The organisms found in each stomach were identified down to the lowest possible taxon with the help of specialized keys for each group, and prey items were counted and weighed on an Acculab Vicon precision electronic scale (0.001 g precision). To determine the sufficiency of the number of analyzed stomachs, cumulative prey curves were created and the Shannon-Wiener diversity index was calculated for each species, resampling for rarefaction with 100 randomiza- tions in EstimateS 8.2 (Colwell 2013). Sample sufficiency is considered to be achieved if the diversity curves visually reach an asymptote (Magurran 2004).
Stomach content analysis
The food components in the stomachs were quantified according to the numerical, gravimetric, and frequency of occurrence methods. The Smith index (Smith 1982) was estimated to find the breadth of the trophic niche and the feeding strategy of each species. The Pianka index (Pianka 1973), which yields dietary overlap, was used to measure potential competition between fish species. A dietary overlap between 2 species showing a value greater than 0.60 is considered high (Langton 1982). Both indices are standardized between 0 and 1 (Krebs 1999), and calculations were made using Ecological Methodology 7.0. Species richness in predator diets between seasons was analyzed using iNEXT (Hsieh et al. 2016) in R language (R Core Team 2019), according to Chao et al. (2014) for cases of unbalanced designs and with different numbers of stomachs analyzed. Estimates of species richness (order q = 0) in the diet and the respective 95% confidence intervals from rarefaction curves were deter- mined considering the lowest number of organisms found in the diet of a predator (n = 30), which allows for robust comparisons of diets between hydroclimatic periods (Chao et al. 2014).
The non-metric multidimensional scaling method was used (Clarke 1993) to graphically analyze predator association patterns using prey composition by species and by season. The Bray-Curtis index (Clarke and Warwick 2001) was used to measure similarity, and it was estimated with the values of percent weight (%W) each food category contributed to the diet. Diet similarity for each species was comparatively analyzed between hydroclimatic periods with a one-way similarity analysis (Clarke and Warwick 2001).
RESULT
Overall description of diets
For the stomach content analysis, a total of 4,547 stomachs, of which 2,626 (57.8%) had content and 1,921 (42.2%) were empty, were extracted from the 11 most abundant species in the PCCM. Of the total number of stomachs with con- tents, 1,453 corresponded to samples from the warm season and 1,173 to samples from the cold season (Table 1). Since Cyclopsetta querna were vastly abundant, we decided to separate the analysis of the diet of juveniles and adults.
Table 1 Main demersal fish species caught on the Pacific coast of central Mexico and number of analyzed stomachs in total (Nt) and with contents (Nc) by sampling season, fish size, and trawling depth range at which 90% of the individuals were caught.
Season |
|||||||||
Family |
Species analized |
Abbreviation |
Nt |
Nc |
Warm |
Cold |
Size average |
Range size |
Depth range cm |
Bothidae |
Bothus leopardinus |
BL |
579 |
262 |
145 |
117 |
7.62 |
4.9–14.0 |
20–40 |
Paralichthyidae |
Cyclopsetta querna |
CQ a |
95 |
73 |
56 |
17 |
25.77 |
25.7–41.6 |
20–40 |
Paralichthyidae |
Cyclopsetta querna |
CQ y |
323 |
119 |
71 |
48 |
9.27 |
9.27–16.8 |
20–60 |
Diodontidae |
Diodon holocanthus |
DH |
391 |
307 |
184 |
123 |
22.12 |
22.1–51.5 |
20–40 |
Paralichthyidae |
Paralichthys woolmani |
PW |
88 |
81 |
35 |
46 |
28.80 |
11.2–41.5 |
20–60 |
Batrachoididae |
Porichthys margaritatus |
PM |
649 |
310 |
119 |
191 |
9.66 |
9.6–15.0 |
20–60 |
Tryglidae |
Prionotus ruscarius |
PR |
148 |
113 |
54 |
59 |
20.94 |
20.9–39.2 |
20–40 |
Scorpaenidae |
Scorpaena russula |
SR |
286 |
142 |
83 |
59 |
9.44 |
9.4–19.5 |
20–60 |
Paralichthyidae |
Syacium ovale |
SO |
828 |
340 |
164 |
176 |
10.52 |
10.2–21.4 |
20–60 |
Urotrygonidae |
Urobatis halleri |
UH |
239 |
196 |
113 |
83 |
30.37 |
30.4–55.0 |
20–40 |
Urotrygonidae |
Urotrygon munda |
UM |
553 |
418 |
256 |
162 |
33.28 |
33.3–53.8 |
20–40 |
Urotrygonidae |
Urotrygon rogersi |
UR |
368 |
265 |
197 |
68 |
36.13 |
36.1–52.6 |
20–40 |
4,547 |
2,626 |
1,477 |
1,149 |
||||||
The food source of the 11 demersal fish species comprised 95 prey items, which were grouped into 70 food categories for the analysis of trophic interactions and associations (Table 2). The total number of stomachs with con- tent analyzed for each species was considered adequate to describe the diet of the 11 demersal fish species because the cumulative curves tended toward an asymptote (Fig. 2).
Table 2 General diet composition for the 11 demersal fish species as given by the percent contribution determined by the gravimetric (%W) and the numeric (%N) methods. Abbreviations of species names are defined in Table 1.
BL |
CQ a |
CQ y |
DH |
PM |
PR |
PW |
SR |
SO |
UH |
UM |
UR |
||||||||||||||
Food categories |
%N |
%W |
%N |
%W |
%N |
%W |
%N |
%W |
%N |
%W |
%N |
%W |
%N |
%W |
%N |
%W |
%N |
%W |
%N |
%W |
%N |
%W |
%N |
%W |
|
Mollusks |
Capulidae |
0.09 |
0.01 |
||||||||||||||||||||||
Cardiidae |
0.33 |
0.07 |
2.70 |
4.22 |
|||||||||||||||||||||
Cavoliniidae |
0.81 |
0.31 |
1.97 |
0.18 |
0.80 |
0.05 |
3.24 |
0.05 |
|||||||||||||||||
Cerithiidae |
1.68 |
0.85 |
|||||||||||||||||||||||
Dentaliidae |
7.82 |
0.13 |
2.02 |
0.07 |
|||||||||||||||||||||
Donacidae |
0.27 |
0.40 |
|||||||||||||||||||||||
Ficidae |
0.18 |
0.14 |
|||||||||||||||||||||||
Glycymeridae |
0.75 |
2.39 |
|||||||||||||||||||||||
Loliginidae |
6.56 |
38.32 |
0.09 |
0.95 |
1.82 |
13.36 |
0.72 |
1.42 |
0.03 |
1.31 |
0.03 |
2.79 |
|||||||||||||
Lucinidae |
1.11 |
0.68 |
|||||||||||||||||||||||
Mytilidae |
4.29 |
1.94 |
0.15 |
0.05 |
|||||||||||||||||||||
Nassariidae |
3.93 |
3.77 |
|||||||||||||||||||||||
Naticidae |
1.13 |
0.35 |
0.33 |
0.08 |
6.54 |
0.87 |
1.82 |
0.58 |
|||||||||||||||||
Olivellidae |
0.13 |
0.06 |
|||||||||||||||||||||||
Olividae |
0.27 |
7.20 |
|||||||||||||||||||||||
Pectinidae |
1.33 |
0.84 |
|||||||||||||||||||||||
Pyramidellidae |
0.04 |
0.91 |
|||||||||||||||||||||||
Solemyidae |
0.66 |
0.21 |
2.87 |
0.88 |
|||||||||||||||||||||
Tellinidae |
4.91 |
7.60 |
0.23 |
0.01 |
|||||||||||||||||||||
Turritellidae |
0.16 |
0.08 |
9.64 |
0.39 |
|||||||||||||||||||||
Veneridae |
0.31 |
5.81 |
|||||||||||||||||||||||
Gastropods (unidentifiable) |
1.41 |
7.32 |
0.20 |
0.40 |
0.29 |
0.01 |
0.01 |
<0.01 |
0.03 |
0.04 |
0.05 |
0.13 |
|||||||||||||
Polychaetes |
Amphinomidae |
3.39 |
1.03 |
1.00 |
0.06 |
3.47 |
0.16 |
2.93 |
0.36 |
0.30 |
0.39 |
0.29 |
0.37 |
0.18 |
2.33 |
||||||||||
Serpullidae |
1.29 |
2.42 |
0.55 |
0.02 |
1.06 |
0.59 |
0.23 |
0.01 |
2.11 |
0.76 |
1.02 |
0.38 |
0.08 |
0.53 |
0.32 |
2.07 |
1.50 |
0.03 |
|||||||
Polychaetes (unidentifiable) |
2.58 |
4.41 |
0.33 |
0.14 |
0.44 |
0.92 |
2.05 |
1.03 |
0.01 |
0.21 |
0.18 |
0.51 |
0.25 |
0.46 |
|||||||||||
Shrimps |
Alpheidae |
11.77 |
8.30 |
6.01 |
0.17 |
6.58 |
0.78 |
2.21 |
0.29 |
15.35 |
2.39 |
5.09 |
0.62 |
0.72 |
0.06 |
0.42 |
0.32 |
6.73 |
1.06 |
2.20 |
2.71 |
32.59 |
23.14 |
33.82 |
14.28 |
Ogyridiidae |
0.20 |
0.10 |
0.15 |
0.24 |
0.03 |
0.09 |
|||||||||||||||||||
Palaemonidae |
0.65 |
2.88 |
4.92 |
3.49 |
0.66 |
1.82 |
0.40 |
0.26 |
4.24 |
4.38 |
27.31 |
74.10 |
20.86 |
11.02 |
16.03 |
25.66 |
4.39 |
11.89 |
0.49 |
15.92 |
0.92 |
7.94 |
1.45 |
8.14 |
|
Penaeidae |
19.52 |
16.38 |
28.96 |
3.27 |
0.99 |
0.82 |
0.27 |
0.02 |
15.56 |
2.17 |
30.56 |
2.17 |
1.44 0.08 |
35.02 |
6.31 |
17.57 |
4.22 |
87.64 |
38.93 |
60.37 |
36.31 |
57.00 |
18.34 |
||
Processidae |
0.33 |
0.07 |
1.39 |
5.27 |
0.72 |
1.44 |
10.97 |
28.99 |
0.44 |
0.65 |
0.03 |
0.32 |
|||||||||||||
Sicyonidae |
0.22 |
0.61 |
0.72 |
0.30 |
4.64 |
9.01 |
0.29 |
1.12 |
0.04 |
0.39 |
|||||||||||||||
Solenoceridae |
0.72 |
0.35 |
|||||||||||||||||||||||
Crabs |
Albuneidae |
0.32 |
0.39 |
0.59 |
0.12 |
0.05 |
1.41 |
0.03 |
0.03 |
||||||||||||||||
Calappidae |
0.65 |
1.32 |
0.55 |
0.05 |
3.71 |
10.01 |
2.08 |
0.26 |
0.72 |
0.10 |
0.84 |
0.94 |
0.44 |
0.50 |
0.01 |
2.42 |
0.09 |
0.93 |
0.15 |
0.13 |
|||||
Cancrinidae |
0.04 |
0.06 |
|||||||||||||||||||||||
Diogenidae |
0.15 |
0.11 |
|||||||||||||||||||||||
Gecarcinidae |
0.16 |
0.08 |
0.59 |
0.30 |
|||||||||||||||||||||
Leucosiidae |
2.10 |
0.79 |
0.04 |
<0.01 |
3.43 |
0.31 |
0.23 |
<0.01 |
0.84 |
0.01 |
1.62 |
1.25 |
0.73 |
0.22 |
0.64 |
0.08 |
|||||||||
Portunidae |
12.26 |
11.05 |
2.63 |
3.70 |
32.94 |
20.90 |
2.22 |
1.64 |
11.76 |
11.81 |
11.51 |
1.42 |
5.91 |
8.95 |
8.35 |
2.86 |
1.66 |
9.44 |
0.59 |
2.54 |
1.07 |
1.68 |
|||
Raninidae |
1.37 |
6.98 |
0.23 |
0.73 |
0.06 |
0.43 |
0.05 |
0.23 |
|||||||||||||||||
Xanthidae |
0.27 |
0.11 |
0.61 |
0.34 |
2.16 |
0.35 |
1.27 |
1.39 |
0.02 |
0.03 |
|||||||||||||||
Brachyura (larves) |
6.29 |
6.89 |
1.09 |
0.02 |
1.97 |
0.99 |
0.40 |
0.08 |
7.07 |
0.62 |
5.56 |
0.38 |
1.44 |
0.33 |
4.22 |
0.94 |
10.98 |
2.63 |
4.41 |
6.73 |
0.62 |
0.30 |
0.79 |
0.27 |
|
Caridea (unidentifiable) |
0.16 |
0.08 |
0.35 |
1.21 |
6.26 |
3.84 |
1.16 |
0.08 |
1.44 |
0.05 |
0.01 |
0.01 |
|||||||||||||
Crustaceans (unidentifiable) |
7.10 |
11.43 |
2.30 |
0.48 |
0.57 |
2.49 |
9.49 |
9.59 |
1.39 |
1.25 |
0.72 |
0.02 |
5.06 |
1.01 |
10.98 |
7.10 |
0.13 |
2.57 |
0.27 |
2.98 |
0.43 |
2.73 |
|||
Stomatopods |
Eurysquillidae |
1.45 |
0.48 |
2.43 |
3.03 |
0.01 |
0.08 |
0.03 |
<0.01 |
||||||||||||||||
Lysiosquilla |
0.04 |
0.08 |
0.01 |
0.30 |
|||||||||||||||||||||
Squillidae |
2.74 |
5.69 |
1.09 |
0.11 |
1.32 |
2.89 |
0.75 |
1.06 |
1.62 |
2.35 |
1.39 |
2.57 |
4.32 |
2.57 |
4.64 |
6.48 |
12.01 |
21.56 |
0.20 |
2.64 |
0.51 |
2.15 |
0.76 |
2.13 |
|
Stomatopoda (larves) |
1.29 |
3.86 |
0.55 |
0.01 |
1.64 |
2.50 |
0.31 |
0.67 |
1.01 |
0.33 |
0.23 |
0.01 |
0.72 |
0.31 |
1.69 |
4.14 |
5.86 |
7.19 |
0.13 |
0.11 |
0.87 |
2.31 |
0.41 |
44.13 |
|
Percarids |
Amphipoda |
0.51 |
0.52 |
||||||||||||||||||||||
Euphausiacea |
3.23 |
0.69 |
1.09 |
0.02 |
2.63 |
0.31 |
0.09 |
<0.01 |
0.61 |
0.10 |
1.62 |
0.03 |
0.72 |
0.01 |
0.42 |
0.07 |
0.29 |
0.03 |
0.07 |
0.06 |
0.13 |
0.01 |
0.13 |
0.01 |
|
Isopoda |
15.32 |
0.59 |
0.20 |
0.05 |
|||||||||||||||||||||
Mysida |
0.32 |
0.02 |
1.41 |
0.76 |
0.01 |
<0.01 |
|||||||||||||||||||
Ostracoda |
0.84 |
1.10 |
1.17 |
2.08 |
|||||||||||||||||||||
Nephropodidae |
0.04 |
0.01 |
|||||||||||||||||||||||
Fishes |
Achiridae |
3.28 |
1.52 |
1.44 |
0.58 |
||||||||||||||||||||
Bleniidae |
0.04 |
0.21 |
|||||||||||||||||||||||
| Bothidae | 3.28 | 5.94 | 1.64 | 12.03 | 5.76 | 11.39 | 0.15 | 0.60 | 0.04 | 2.71 | 0.09 | 0.98 | |||||||||||||
Bregmacerotidae |
0.55 |
1.76 |
1.44 |
1.42 |
0.03 |
0.27 |
|||||||||||||||||||
Congridae |
0.33 |
1.47 |
1.44 |
4.46 |
0.01 |
0.10 |
|||||||||||||||||||
Cynoglossidae |
2.16 |
6.10 |
|||||||||||||||||||||||
Gobidae |
0.60 |
4.58 |
|||||||||||||||||||||||
Nettastomatidae |
0.16 |
0.22 |
0.66 |
2.19 |
0.40 |
3.14 |
20.86 |
35.47 |
1.17 |
6.49 |
0.03 |
1.22 |
0.14 |
1.51 |
0.33 |
1.69 |
|||||||||
Ophidiidae |
0.66 |
4.93 |
0.13 |
0.11 |
0.44 |
0.98 |
0.04 |
0.51 |
|||||||||||||||||
Paralichthydae |
0.16 |
9.56 |
1.09 |
12.93 |
0.66 |
5.79 |
0.20 |
0.10 |
0.93 |
0.35 |
0.72 |
2.89 |
0.42 |
1.52 |
0.73 |
0.99 |
0.11 |
6.18 |
0.32 |
2.94 |
0.03 |
0.06 |
|||
Sciaenidae |
0.29 |
3.82 |
|||||||||||||||||||||||
Syngnathidae |
0.72 |
3.27 |
|||||||||||||||||||||||
Triglidae |
0.66 |
1.49 |
|||||||||||||||||||||||
Fishes (unidentifiable) |
4.84 |
10.64 |
40.44 |
32.37 |
19.08 |
56.92 |
0.71 |
2.89 |
22.11 |
49.00 |
1.85 |
0.20 |
15.83 |
14.61 |
4.64 |
2.31 |
9.81 |
21.65 |
0.28 |
3.79 |
0.70 |
6.73 |
0.87 |
2.76 |
|
Others |
Miscellaneous |
0.16 |
0.06 |
0.20 |
0.02 |
||||||||||||||||||||
Eggs(unidentifi able) |
51.64 |
0.13 |
0.22 |
<0.01 |
1.41 |
0.03 |
|||||||||||||||||||
Description of the diets by species
Bothus leopardinus
Of the 579 analyzed stomachs, only 262 had contents (Table 1). The diet was made up of 27 food categories: 17 crustaceans, 3 mollusks, 3 fishes, 3 polychaetes, and 1 of remains of an anemone. The main components, according to the %W values, were crustaceans, followed by fishes: Penaeidae (16.0%), Portunidae (11.5%), Alpheidae (8.3%), Brachyura larvae (6.9%), and fishes (~22.0%), particularly of the family Paralichthydae (9.5%) (Table 2).
Cyclopsetta querna (juveniles)
In total 323 organisms were analyzed, but only 119 had contents (Table 1). For this species, 23 food categories were identified: 10 crustaceans, 4 mollusks, and 7 fishes, polychaetes, and unidentified eggs. Fishes (~80.0%) were the main food category in the diet (Table 2).
Cyclopsetta querna (adults)
A total of 95 stomachs were analyzed, of which only the 73 that had contents were considered (Table 1). The diet consisted of 5 categories of fishes, 8 of crustaceans, and only 1 of mollusks and 1 of polychaetes. The most important categories were fishes (~55.0%) and loliginid squids (38.3%) (Table 2).
Diodon holocanthus
A total of 391 stomachs were collected, but food categories were found in only 307 stomachs (Table 1). A total of 47 food categories were identified. Mollusks were the group with the highest number of food categories (22); how- ever, the main food categories were portunid crabs (21.0%), calapid crabs (10.0%), and mollusks (~49.0%), particularly Tellinidae (7.6%) and Olividae (7.2%) bivalves (Table 2).
Paralichthys woolmani
A total of 25 food categories were identified in 81 of the 88 stomachs analyzed (Table 1). Fishes (~80.0%) and Palemonidae shrimps (11.0%) were the main prey in the diet (Table 2).
Porichthys margaritatus
A total of 26 food categories were identified in 310 of the 649 stomachs analyzed (Table 1). The group of crustaceans had the highest number of food categories (15), followed by the mollusks and fishes (4), the polychaetes (1), and the unidentified anemones and eggs (1). Fishes (~56.0%), crus- taceans (~27.0%), and loliginid squids (13.3%) were conspicuous among the prey (Table 2).
Prionotus ruscarius
A total of 148 stomachs were analyzed, of which only 113 had content (Table 1). A total of 20 food categories were identified: 14 crustaceans, 2 mollusks, 2 fishes, and 2 poly- chaetes. Palaemonidae shrimps (74.0%) were the main prey, followed by portunid crabs (12.0%) (Table 2).
Scorpaena russula
In total 286 stomachs were analyzed, of which only 142 had content (Table 1). A total 18 food categories were iden- tified: 15 crustaceans, 2 fishes, and 1 polychaete. The main prey were Processidae (29.0%), Palaemonidae (26.0%), and Sicyonidae (9.0%) shrimps and Portunidae crabs (9.0%) (Table 2).
Syacium ovale
To describe the diet of this species, 828 stomachs were analyzed but only 340 stomachs had content (Table 1). In total, 28 food categories were identified in the diet. Fishes (~35.0%), stomatopods (~30.0%), and Palaemonidae shrimps (12.0%) were the main components in the diet (Table 2).
Urobatis halleri
In total 239 stomachs were analyzed but only 196 had content (Table 1). The food categories in the group of crusta- ceans were the most important in the diet (16), followed by the fishes (4), the polychaetes (3), and the mollusks (2). The main components in the diet were Penaeidae (39.0%) and Palaemonidae (16.0%) shrimps, portunid crabs (9.5%), and brachyurus larvae (6.7%) (Table 2).
Urotrygon munda
A total of 553 stomachs were analyzed, of which only 418 had content (Table 1). Twenty-seven food categories were identified in the diet, of which crustaceans had the highest presence (16), followed by fishes (6), polychaetes (3), and mollusks (2). Shrimp of the Penaeidae (36.3%), Palaemonidae (8.0%), and Alpheidae (23.1%) families, and fishes (13.0%) showed the greatest contribution to the diet (Table 2).
Urotrygon rogersi
To describe the diet, 368 stomachs were collected but only 265 had content (Table 1). A total of 23 food categories were identified: 15 crustaceans, 4 fishes, 3 polychaetes, and 1 mollusk. The main food categories were stomatopod larvae (44.0%) and shrimps from the Penaeidae (18.3%), Alpheidae (14.3%), and Palaemonidae (8.1%) families (Table 2).
Trophic niche breadth, overlapping diets
Smith index values showed a broad trophic niche (FT > 0.5) for all species in both seasons. They all consumed a high number of prey and showed a generalist feeding strategy, allowing them to consume any type of available prey. In the summer values ranged between 0.6 and 0.8, and during the winter the values varied between 0.5 and 0.8 (Fig. 3).
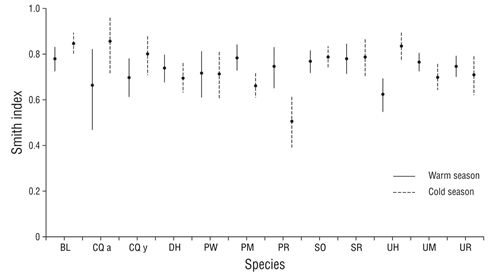
Figure 3 Smith index average values (±95% confidence interval) by species and sampling season (abbreviations of species names are defined in Table 1).
In general, the Pianka index showed low values in the dietary overlap between the fish species analyzed. High values in dietary overlap were found between Pleuronectiformes flatfishes and ray species of the Urotrygonidae family (Table 3). In the warm season there were 6 interactions with high values of dietary overlap: C. querna juveniles with P. margaritatus (0.79), C. querna with S. ovale (0.82), P. margaritatus with S. ovale (0.79), U. halleri with U. munda (0.92), U. halleri with U. rogersi (0.86), and U. munda with U. rogersi (0.95). For the cold season, dietary overlap values were high for interactions of B. leopardinus with U. munda (0.77), B. leopardinus with U. rogersi (0.77), C. querna juveniles with P. margaritatus (0.82), P. ruscarius with S. russula (0.99), P. ruscarius with U. rogersi (0.70), and U. munda with U. rogersi (0.94). According to the values of expected prey richness (Fig. 4), 3 groups were formed: (a) diet with high species richness composed of D. holocanthus, P. woolmani, S. ovale, P. margaritatus, and B. leopardinus; (b) diet with intermediate richness composed of P. ruscarius, S. russula, and adults and juveniles of C. querna; and (c) diet with low species richness composed of U. halleri, U. munda, and U. rogersi. The species that showed changes in species richness in their diets between seasons were D. holocanthus, B. leopardinus, P. ruscarius, and U. halleri, and for all cases, the highest richness was observed during the warm period, except in the case of U. halleri, for which the highest rich- ness in the diet was observed in the cold period.
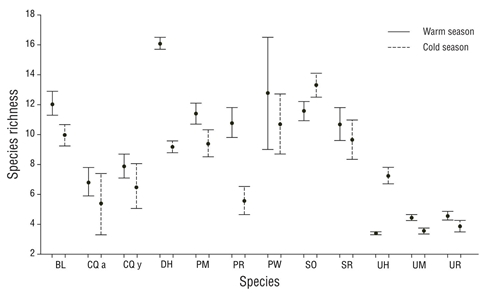
Figure 4 Expected species richness (±95% confidence interval) given by the rarefaction curves, with 30 prey for every predator species and every season (abbreviations of species names are defined in Table 1).
Table 3 Pianka’s overlap index values calculated for each pair of demersal fish species and by season. Abbreviations of species names are defined in Table 1. Values in bold are considered significant (>>0.60).
BL |
CQ a |
CQ y |
DH |
PM |
PR |
PW |
SO |
SR |
UH |
UM |
UR |
|
BL |
* |
0.42 |
0.55 |
0.21 |
0.69 |
0.38 |
0.57 |
0.66 |
0.19 |
0.56 |
0.67 |
0.68 |
CQ a |
0.06 |
* |
0.72 |
0.03 |
0.38 |
0.08 |
0.20 |
0.62 |
0.10 |
0.20 |
0.34 |
0.29 |
CQ y |
0.06 |
0.42 |
* |
0.10 |
0.79 |
0.22 |
0.29 |
0.82 |
0.12 |
0.15 |
0.30 |
0.26 |
DH |
0.39 |
0.09 |
0.14 |
* |
0.14 |
0.51 |
0.06 |
0.14 |
0.09 |
0.07 |
0.11 |
0.11 |
PM |
0.06 |
0.64 |
0.82 |
0.16 |
* |
0.24 |
0.27 |
0.79 |
0.19 |
0.40 |
0.55 |
0.60 |
PR |
0.14 |
0.06 |
0.00 |
0.09 |
0.06 |
* |
0.05 |
0.33 |
0.25 |
0.32 |
0.33 |
0.32 |
PW |
0.12 |
0.32 |
0.40 |
0.02 |
0.38 |
0.17 |
* |
0.50 |
0.11 |
0.08 |
0.15 |
0.18 |
SO |
0.51 |
0.17 |
0.27 |
0.13 |
0.35 |
0.56 |
0.26 |
* |
0.21 |
0.33 |
0.46 |
0.47 |
SR |
0.29 |
0.07 |
0.03 |
0.25 |
0.09 |
0.97 |
0.06 |
0.60 |
* |
0.18 |
0.18 |
0.21 |
UH |
0.43 |
0.31 |
0.21 |
0.46 |
0.19 |
0.71 |
0.10 |
0.58 |
0.77 |
* |
0.92 |
0.86 |
UM |
0.73 |
0.16 |
0.09 |
0.08 |
0.15 |
0.24 |
0.09 |
0.22 |
0.36 |
0.36 |
* |
0.95 |
UR |
0.67 |
0.06 |
0.07 |
0.11 |
0.11 |
0.46 |
0.10 |
0.32 |
0.59 |
0.48 |
0.94 |
* |
The associations between predator species were related to common prey preferences (Fig. 5). Species such as P. woolmani and C. querna (juveniles) preferred consuming fish; on the other hand, C. querna (adults) and P. margaritatus consumed fish, squid, and crabs. Diodon holocanthus consumed crabs and mollusks, and B. leopardinus, P. ruscarius, S. russula, S. ovale, U. halleri, U. munda, and U. rogersi consumed shrimp and stomatopods. The associations of species in predator diets showed significant differences between hydroclimatic seasons for B. leopardinus (R = 0.519), P. woolmani (R = 0.382), U. halleri (R = 0.306), U. munda (R = 0.321), and U. rogersi (R = 0.538) (global R = 0.231, P < 0.05).
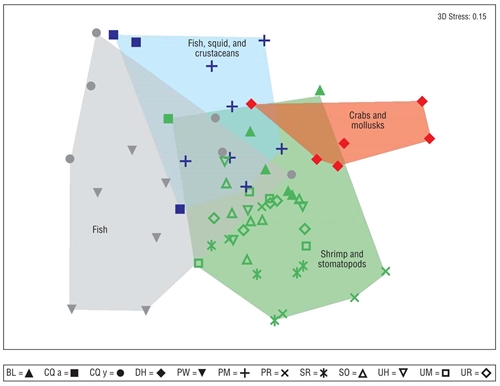
Figure 5 Non-metric multidimensional scaling showing the trophic functional groups for the 11 demersal fish species analyzed. The symbols correspond to each of the fish species (abbreviations defined in Table 1). The colors show the patterns of association of predator species based on prey item similarities (red = crabs and mollusks; blue = fish, crustaceans, and squids; gray = fish; green = shrimp and stomatopods).
DISCUSSION
Soft bottoms in the ocean are used as feeding sites by a large variety of fish species, including species associated with rocky bottoms (Flores-Ortega et al. 2010, 2014), because of the large diversity of foraging species, mainly macroinverte- brates (Parrish 1989). Different studies of trophic dynamics in predator communities inhabiting soft-bottom demersal systems have found that the most important prey in the diets are crustaceans and fishes, followed by mollusks, echino- derms, and polychaetes, which together represent almost the entire diet (Navia et al. 2007; Flores-Ortega et al. 2011, 2013; Anastasopoulou et al. 2019).
Abundance and diversity in the soft-bottom benthic macroinvertebrate community in the PCCM show seasonal fluctuations associated with changes in temperature and dis- solved oxygen in the deep water mass (González-Sansón et al. 1997, Godínez-Domínguez and González-Sansón 1998, Godínez-Domínguez et al. 2009). However, predators are not affected, because the availability of food resources is, apparently, not limiting, and they simply prey on resources available each season, a behavior of opportunistic predators (Aguilar-Palomino and González-Sansón 2010). The present study showed that C. querna exhibits ontogenetic and even seasonal changes in its diet. Changes in the community structure of soft-bottom macrobenthos are reflected in the feeding behavior of predators, which has been reported for similar environments in other parts of the world (Mohanraj and Prabhu 2012). In most demersal fish communities, the process of food partitioning is governed by the size or sex of organisms (Zahorcsak et al. 2000, Link et al. 2002, Moura et al. 2008), and in some cases the temporal variability of resources has direct influence on feeding strategies and habits (Schückel et al. 2011).
Pérez-España et al. (2005) found minimal dietary overlap in the demersal fish community in the PCCM, which is consistent with our results. The analyzed fish species showed a generalist feeding strategy in both seasons. However, in a trophic analysis, Raymundo-Huizar and Chiappa-Carrara (2000) found that, like Diodon histrix, D. holocanthus has a specialized feeding behavior, which could really mean a manifestation of opportunism, feeding on a few prey because of high availability rather than selectivity.
Most demersal fish species in the PCCM show high diversity of prey in their diets and often share basic food categories, so competition for food could be thought of as a potentially important ecological interaction in the trophic dynamics of soft bottoms in the PCCM. However, no evidence of competition was observed given the generalist- opportunistic strategy of these species and the dynamics of the community structure of both fishes and invertebrates, and for competition to exist, shared resources have to be limiting (Kidawa and Kowalczyk 2011). Groups such as rays and flatfish, which show high dietary overlap, also show high plasticity by seasonally changing their diet composition to avoid competing for food with other species, regardless of diet richness or trophic niche breadth. This behavior is documented as one of the feeding strategies of demersal fish communities (Lucena et al. 2000, Moura et al. 2008, Donelson et al. 2019).
In demersal communities, fish can partition resources on a spatial level instead of the diet (Le Pape et al. 2013, O’Shea et al. 2013), since their ecological niche range provides the food resources they prefer and need to cover their energy requirements. Habitat partitioning frequently occurs with ontogenetic changes in habitat use (Reis-Filho et al. 2019), whereby adults are spatially segregated from juveniles, but this behavior was not observed in the soft-bottom coastal area of the PCCM, because juveniles and adults showed high co-occurrence in the area. In this study, resource partitioning between demersal predator species was established by the functional groups in the diet, for example, the preference of ray species (Urotrygonidae) for carid shrimp and other crustaceans; the preference of small size flatfish species (Pleuronectiformes) for fish; the preference of large and medium-sized flatfish for fish, crustaceans, and squid; and the preference of diodons (Diodontidae) for mainly crabs, gastropod mollusks, and shrimp. The feeding organization and behavior of a community are associated with factors such as food resource availability, predator preference (Yamamoto and Tominaga 2005, Hajisamae 2009), and physiological aspects such as shape and size of the buccal structure (Barnett et al. 2006, Flores-Ortega et al. 2014). According to Zahorcsak et al. (2000), differences in these factors reduce overlaps in resource use and favor coexistence in soft-bottom fish communities, which could be the case in the PCCM.

