


 nueva página del texto (beta)
 Inglés (pdf)
 Artículo en XML
 Referencias del artículo
 Enviar artículo por email
 Citado por SciELO
  Similares en
SciELO
Similares en
SciELO 
 Permalink
INTRODUCTION
Over the last decade, the ecosystem approach to fisheries has gained increasing relevance (Shannon et al. 2010, Hutubessy et al. 2014, Defeo 2015, Biedron and Knuth 2016, Ramírez-Monsalve et al. 2016, FAO 2018). This concept is defined as “an extension of conventional fisheries management recognizing more explicitly the interdependence between human well-being and ecosystem health and the need to maintain ecosystems productivity for present and future generations” (García et al. 2003). In this context, fisheries management aims to remove the potentially negative effects fishing activities may have on the structure and functioning of aquatic ecosystems (Fauconnet et al. 2015).
In the context of the ecosystem approach, it is important to understand fish assemblages that are subject to exploitation, mainly exploitation by multispecies fisheries, which is the case for most artisanal fisheries. In this study, assemblages are taken to be groups of species that maintain a phylogenetic relationship (fishes) within a given biotype (Fauth et al. 1996), without implying any interaction between them (Rochet and Trenkel 2003). With this in mind, it is clear that the use of certain non-selective and environmentally unfriendly fishing gears has contributed to changes in communities of aquatic organisms regarding their structure, behavior, and abundance (FAO 2014, Araújo et al. 2016).
This issue is particularly critical in the Gulf of Salamanca (GoS), Caribbean Sea off Colombia, where different types of artisanal fisheries operate. Of these fisheries, the most important is the set gill net fishery, which uses fishing vessels made of fiberglass (boats) or wood (dugout and canoes), with length overall between 5.0 and 7.6 m, propelled by outboard motors or by oars and sails. This fishery uses gill nets that are made of transparent polyamide synthetic fibers and are composed of 10 to 30 panels, each with a height of 30 to 60 meshes, a length of 100 to 180 m, and mesh sizes of 2⁄ to 10 inches (Pardo 2011). This means that this is a multispecies fishery, as it catches a large number of demersal species (Manjarrés et al. 1993, Bustos-Montes et al. 2012); therefore, changes in the composition of catches obtained with this type of fishing gear are considered valid indicators of the impact of fishing on the demersal fish communities in the study area.
Scientific fishing has been carried out in the GoS for over 4 decades (Ben-Tuvia and Ríos 1969, JICA 1981, Zúñiga and Escobar 1992, Manjarrés et al. 1993, Quintero 1993, Manjarrés 1998) for the purpose of collecting data to set abundance indices (absolute and relative) for the main comercial fish species and to characterize, from a bioecological perspective, demersal fish assemblages in the gulf (García et al.1998). However, the persistence of exploited demersal fish assemblages in this area had not been studied. Therefore, the aim of the present study was to evaluate the temporal changes in the structure of demersal fish assemblages exploited by the artisanal set gill net fishery operating in the GoS and to complement the results obtained from the statistical sampling carried out in the area with traditional ecological knowledge from the fishing communities that operate in the area.
MATERIALS AND METHODS
Study area
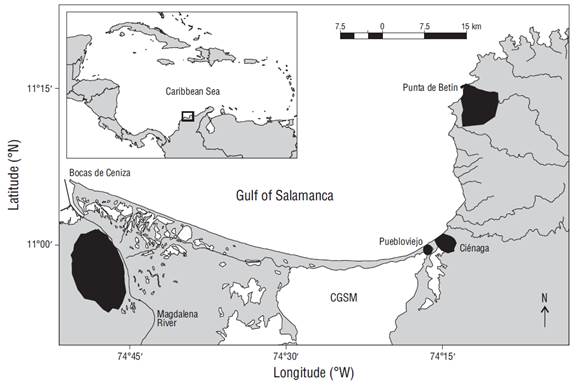
The GoS is located between 11º15 N-74º15 W (Punta Betín, Santa Marta) and 11º00 N-74º50 W (Bocas de Ceniza, mouth of Magdalena River) (Fig. 1). The continental shelf has varying widths and a maximum extension of 16 km (Blanco 1993). In this region there are 2 important seasons throughout the year: a dry season from mid-December to April, which is governed by northeasterly trade winds, and a rainy season from May to November, which increases runoff in rivers that drain into Ciénaga Grande de Santa Marta (García et al. 2013).
Data source
This study used landing data from the artisanal set gill net fishery, specifically data related to the fishing economic units of the Ciénaga and Puebloviejo coastal communities (Fig. 1). The data corresponded to 2 sampling periods: (1) from January to December 2008 (Duarte 2009), henceforth referred to as “first period”; and (2) from January to December 2013, when data were recorded by the Colombian Fisheries Statistical Service Information System (SEPEC, for its acronym in Spanish), henceforth referred to as “second period”. Data were collected using a stratified random sampling design, considering fishing gear or fishing method as the stratification criterion. Moreover, months were used as the time strata.
Traditional ecological knowledge acquired from fishers who have traditionally used set gill nets in the study área was used to geographically reference the fishing sites reported in the SEPEC records and to characterize historical changes in the set gill net designs used in the GoS. For this, a semi-structured questionnaire was applied to 60 fishers (30 from each community), following the exponential snowball non-probability sampling method.
Data treatment
Taxa considered to be demersal were selected using Fishbase (Froese and Pauly 2017). This meant excluding taxa classified as pelagic, mesopelagic, or bathypelagic, so that the resulting assemblages would not be influenced by the occurrence of events that were markedly seasonal or showed pulsating behavior, such as catches of medium-sized pelagic species. Data were then subjected to a process of taxonomic validation and update using Fishbase (Froese and Pauly 2017) and the online version of the California Academy of Sciences’ catalog of fishes (Fricke et al. 2019).
Characterization of assemblages structures
Three multivariate methods were performed using the software PRIMER-E v6 (Clarke and Warwick 2001, Clarke and Gorley 2006, Anderson et al. 2008). The methods were (1) two-way permutational analysis of variance and multivariate analysis of variance (PERMANOVA), (2) principal coordinates analysis, and (3) similarity percentage (SIMPER). Two-way PERMANOVA was used to determine if there were significant differences (α = 0.05) between species compositions at the levels of the factor “period” (2008 and 2013) and the factor “season” (dry and rainy), with previous transformation of data with the function “log(x+1)”, the use of the Bray-Curtis similarity coefficient, and the application of 999 permutations of landing samples; in addition, the method of permutation of residuals under a reduced model was used. The principal coordinates análisis was used to visualize on a three-dimensional plot the significant differences detected with PERMANOVA and thus observe the association patterns of samples at the levels of the 2 factors. The SIMPER routine was used to examine the contribution of each taxon to the average Bray-Curtis dissimilarity between the 2 sampling periods and seasons (discriminating species) and to the average similarity within each each period and season (typifying species).
Determination of functional and fisheries indicators
The weighted average of the trophic level (Rochet and Trenkel 2003) of landings was used as a functional indicator to measure the impact of the artisanal set gill net fishery on demersal fish assemblages. The trophic level of each taxon was obtained from data reported by García and Contreras (2011) and the Fishbase dataset (Froese and Pauly 2017).
Taking into account that in some cases taxa were found at the genus level, the corresponding trophic level (TLGn) was estimated with the following equation:
where n is the number of species of a genus in the landings from each period, Pspj is the proportion of species j with respect to the annual landings of all species of that genus, and TLj is the trophic level of species j. To calculate the representative trophic level of the landings from each period, a weighted average formula was used, and the respective annual landings of each taxon were used as the weighting factor, that is:
where TLp is the weighted average of the trophic level in the sampling period and Cj is the total landing of taxon j in the sampling period.
Average landing per unit effort (LPUE), which was previously standardized using fishing trip duration, was used as an indicator to assess changes in the relative abundance of the main species forming the assemblages. The bias-corrected and accelerated bootstrap technique was used to create the respective confidence intervals (95%) for this indicator (Efron and Tibshirani 1993, Haddon 2011).
Assessment of fishing effort
The Wilcoxon test (α = 0.05) was used to determine if there were statistically significant differences between periods for the “length of gill nets”, “height of gill nets”, and “duration of fishing trips” variables. The likelihood ratio test (α = 0.05) was used to evaluate the hypothesis of independence between the sampling periods and the variables “mesh size” and “fishing trip schedule”. For the latter, fishing trip schedules were stratified into 3 categories: daytime (5:00 AM to 4:59 PM), “at dusk” (5:00 PM to 11:59 PM), and “at dawn” (12:00 AM to 4:59 AM). These tests were carried out using the Statgraphics Centurion v17.2 statistical software.
To evaluate the occurrence of historical changes in the spatial distribution of fishing effort by the artisanal set gill net fleet in the GoS, first the fishing area corresponding to each landing was georeferenced using a system of grids measuring one square nautical mile. For that purpose, 2 types of data were collected from the landing reports: (1) name of the coastal reference site for the fishing zone and (2) depth of fishing zone. In addition, these zones were validated with the traditional ecological knowledge of the coastal communities of the GoS. Then, for each period, the percentage distribution of fishing trips per grid was calculated. Finally, this information was mapped using the QGIS v2.18 software, stratifying the “percentage of fishing trips per grid” variable into 4 categories: ˂1.00%, 1.00%-3.00%, 3.01% -12.00%, and 12.01% -17.00%.
RESULTS
Characterization of assemblage structures
A total of 75 taxa were represented in the cumulative landings of the 2 sampling periods. In the landings from 2008, there were 39 taxa identified to species level and 9 to genus level, whereas landings in 2013 comprised 49 taxa identified to species level and 1 to genus level. A total of 23 taxa were common to both sampling periods.
In general, results showed marked differences in landing compositions. This was clearly evidenced by the results of the two-way PERMANOVA, which showed highly significant differences in the species composition of recorded landings per sampling period (pseudo-F(1, 1161) = 131.04, P < 0.01) and season (pseudo-F(1, 1161) = 9.36, P < 0.01). In addition, using a three-dimensional plot that explains 50.9% of the total variability, the principal coordinates analysis for the sampling period showed a clear separation pattern between landings in 2008 and landings in 2013 (Figs. 2, 3).

Figure 2 Principal coordinate analysis of the demersal fish assemblages recorded in the landings of each study period. The gray squares correspond to landings in the year 2008 and the black circles to landings in 2013.

Figure 3 Principal coordinate analysis of the demersal fish assemblages recorded in the landings made in each season. The black squares correspond to landings for the dry season and the gray circles to landings for the rainy season.
These differences were confirmed by the SIMPER results, which showed average dissimilarities of 87.4% and 81.7% between the 2 periods and the 2 seasons, respectively. In addition, this analysis showed higher homogeneity for landings in 2013 (average similarity of 32.7%) with respect to landings in 2008 (average similarity of 18.4%). Likewise, similarity was higher for landings in the dry season (average similarity of 21.2%) in comparison with landings in the rainy season (average similarity of 19.4%).
Additional evidence of differences between the levels of the 2 factors were derived from the analysis of typifying species for each period and season and from the analysis of discriminant species between sampling period and season. In fact, the landings from 2008 were typified by 8 species, which together contributed to 91.6% of the similarity in the landings recorded for that period. Conversely, the 2013 landings were barely typified by 2 species (Trichiurus lepturus and Micropogonias furnieri), which contributed to 93.4% of the similarity (Table 1). Likewise, for the seasons, the dry season was typified by 7 species, which contributed to 90.8% of the similarity. On the contrary, landings in the rainy season were typified by 4 species (T. lepturus, M. furnieri, Conodon nobilis, and Bagre marinus), which were responsible for 91.3% of the similarity (Table 2).
Table 1 Mean similarity analysis of species in landings reported during the years 2008 and 2013. Only the main typifiying species for each period are shown. SD: standard deviation.
| Period | Species | Average abundance | Similarity SD | Contribution (%) | Cumulative contribution (%) |
| 2008 | Bagre marinus | 0.68 | 0.51 | 22.76 | 22.76 |
| Conodon nobilis | 0.62 | 0.47 | 18.40 | 41.16 | |
| Paralonchurus brasiliensis | 0.52 | 0.40 | 12.04 | 53.20 | |
| Trichiurus lepturus | 0.52 | 0.26 | 11.88 | 65.08 | |
| Micropogonias furnieri | 0.44 | 0.29 | 8.06 | 73.13 | |
| Menticirrhus americanus | 0.48 | 0.30 | 7.82 | 80.95 | |
| Umbrina coroides | 0.39 | 0.28 | 6.00 | 86.95 | |
| Lutjanus synagris | 0.28 | 0.16 | 4.59 | 91.54 | |
| 2013 | Trichiurus lepturus | 1.47 | 0.86 | 75.89 | 75.89 |
| Micropogonias furnieri | 0.64 | 0.55 | 17.51 | 93.40 |
Table 2 Mean similarity analysis of species in reported landings by season. Only the main typifiying species for each period are shown. SD: standard deviation.
| Season | Species | Average abundance |
Similarity SD |
Contribution (%) |
Cumulative contribution (%) |
| Dry | Trichiurus lepturus | 1.02 | 0.46 | 38.67 | 38.67 |
| Micropogonias furnieri | 0.52 | 0.40 | 13.14 | 51.81 | |
| Conodon nobilis | 0.52 | 0.39 | 10.04 | 61.85 | |
| Bagre marinus | 0.51 | 0.40 | 9.83 | 71.68 | |
| Paralonchurus brasiliensis | 0.48 | 0.36 | 8.64 | 80.32 | |
| Umbrina coroides | 0.43 | 0.31 | 5.93 | 86.26 | |
| Menticirrhus americanus | 0.40 | 0.27 | 4.59 | 90.84 | |
| Rainy | Trichiurus lepturus | 0.99 | 0.53 | 61.13 | 61.13 |
| Micropogonias furnieri | 0.55 | 0.42 | 18.17 | 79.30 | |
| Conodon nobilis | 0.39 | 0.28 | 7.86 | 87.16 | |
| Bagre marinus | 0.28 | 0.18 | 4.10 | 91.26 |
A total of 20 taxa contributed 90.6% of the average dissimilarity between the 2 periods, whereas 19 taxa were responsible for 90.3% of the average dissimilarity between seasons. The main discriminant species were T. lepturus and M. furnieri, and, in order of importance, C. nobilis, B. marinus, and Menticirrhus americanus, whose catch rates in 2013 decreased significantly with respect to 2008 (Tables 3, 4).
Table 3. Mean average dissimilarity analysis of species between landings reported during the years 2008 and 2013. The main discriminating taxa are shown in decreasing order of contribution to dissimilarity. SD: standard deviation.
| Taxon | Average abundance 2008 |
Average abundance 2013 |
Dissimilarity SD |
Contribution (%) |
Cumulative contribution (%) |
| Trichiurus lepturus | 0.52 | 1.47 | 1.06 | 22.43 | 22.43 |
| Micropogonias furnieri | 0.44 | 0.64 | 0.91 | 10.52 | 32.95 |
| Conodon nobilis | 0.62 | 0.26 | 0.85 | 8.67 | 41.62 |
| Bagre marinus | 0.68 | 0.05 | 0.83 | 8.42 | 50.04 |
| Paralonchurus brasiliensis | 0.52 | 0.00 | 0.69 | 5.80 | 55.84 |
| Menticirrhus americanus | 0.48 | 0.03 | 0.58 | 5.25 | 61.08 |
| Lutjanus synagris | 0.28 | 0.09 | 0.48 | 5.03 | 66.11 |
| Umbrina coroides | 0.39 | 0.03 | 0.57 | 4.31 | 70.42 |
| Cynoscion spp. | 0.29 | 0.00 | 0.44 | 2.98 | 73.40 |
| Sciades proops | 0.00 | 0.20 | 0.34 | 2.78 | 76.18 |
| Larimus breviceps | 0.23 | 0.06 | 0.49 | 2.76 | 78.94 |
| Orthopristis ruber | 0.22 | 0.00 | 0.33 | 2.65 | 81.60 |
| Cynoscion jamaicensis | 0.00 | 0.21 | 0.35 | 2.35 | 83.94 |
| Sciades spp. | 0.08 | 0.00 | 0.21 | 1.44 | 85.38 |
| Centropomus ensiferus | 0.00 | 0.08 | 0.28 | 1.16 | 86.54 |
| Cathorops mapale | 0.04 | 0.03 | 0.25 | 1.03 | 87.57 |
| Ariopsis sp. | 0.00 | 0.05 | 0.19 | 0.94 | 88.51 |
| Calamus penna | 0.00 | 0.06 | 0.20 | 0.76 | 89.27 |
| Selene vomer | 0.04 | 0.01 | 0.18 | 0.65 | 89.93 |
| Carcharhinus spp. | 0.04 | 0.00 | 0.15 | 0.65 | 90.57 |
Table 4 Mean dissimilarity analysis of species between landings by season. The main discriminant taxa are shown in decreasing order of contribution to the dissimilarity (Diss.). SD: standard deviation.
| Taxon | Average abundance Dry season |
Average abundance Rainy season |
Diss./SD | Cumulative contribution (%) |
Cumulative contribution (%) |
| Trichiurus lepturus | 1.02 | 0.99 | 0.97 | 20.91 | 20.91 |
| Micropogonias furnieri | 0.52 | 0.55 | 0.90 | 10.59 | 31.50 |
| Conodon nobilis | 0.52 | 0.39 | 0.83 | 8.78 | 40.28 |
| Bagre marinus | 0.51 | 0.28 | 0.78 | 7.90 | 48.18 |
| Paralonchurus brasiliensis | 0.48 | 0.14 | 0.71 | 6.39 | 54.57 |
| Menticirrhus americanus | 0.40 | 0.17 | 0.60 | 5.53 | 60.10 |
| Lutjanus synagris | 0.23 | 0.16 | 0.48 | 5.36 | 65.45 |
| Umbrina coroides | 0.43 | 0.09 | 0.63 | 5.21 | 70.66 |
| Cynoscion spp. | 0.31 | 0.05 | 0.50 | 3.67 | 74.33 |
| Larimus breviceps | 0.27 | 0.08 | 0.53 | 3.42 | 77.75 |
| Sciades proops | 0.04 | 0.13 | 0.32 | 2.55 | 80.31 |
| Orthopristis ruber | 0.04 | 0.14 | 0.29 | 2.29 | 82.59 |
| Cynoscion jamaicensis | 0.01 | 0.16 | 0.31 | 2.00 | 84.60 |
| Sciades spp. | 0.02 | 0.05 | 0.19 | 1.20 | 85.80 |
| Cathorops mapale | 0.03 | 0.04 | 0.23 | 1.05 | 86.85 |
| Centropomus ensiferus | 0.00 | 0.06 | 0.24 | 0.96 | 87.82 |
| Ariopsis sp. | 0.02 | 0.03 | 0.19 | 0.94 | 88.75 |
| Calamus penna | 0.03 | 0.03 | 0.20 | 0.88 | 89.63 |
| Carcharhinus spp. | 0.02 | 0.02 | 0.15 | 0.68 | 90.32 |
Determination of functional and fisheries indicators
Trophic levels for the year 2013 (TLp = 4.20) increased with respect to 2008 (TLp = 3.90). On the other hand, for the evaluated species, significant differences were found in the average LPUE values between the 2 periods, with the exception of T. lepturus and M. furnieri. For the rest of the species (C. nobilis, B. marinus, M. americanus, and Umbrina coroides), the respective relative abundance indices markedly decreased (Fig. 4), and this trend was observed even when the contributions of each species to the cumulative LPUE for each period were compared (Table 5).
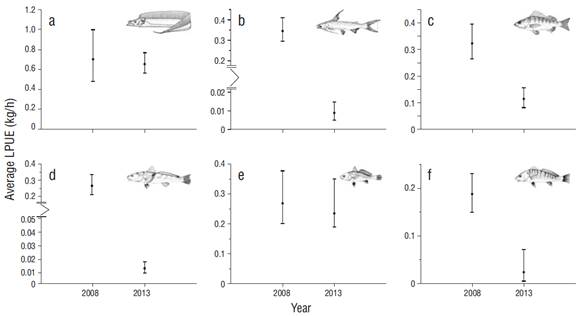
Figure 4 Temporal variation of the landing per unit effort (LPUE) of the main species caught during the 2008 period: (a) Trichiurus lepturus, (b) Marinus catfish, (c) Conodon nobilis, (d) Menticirrhus americanus, (e) Micropogonias furnieri, and (f) Umbrina coroides. The 95% confidence intervals were established using the bias-corrected and accelerated bootstrap technique.
Table 5 Contribution (%) of the different taxa to the cumulative landing per unit effort (LPUE) for each year. The 19 taxa with contributions less than 0.1% for both years are grouped as “others”.
| Taxon | LPUE 2008 (kg/h) |
% | LPUE 2013 (kg/h) |
% | Grand total |
% |
| Trichiurus lepturus | 383.3 | 20.6 | 383.6 | 41.9 | 766.9 | 27.7 |
| Micropogonias furnieri | 155.8 | 8.4 | 139.4 | 15.2 | 295.1 | 10.6 |
| Conodon nobilis | 182.9 | 9.9 | 67.5 | 7.4 | 250.5 | 9.0 |
| Bagre marinus | 197.1 | 10.6 | 5.4 | 0.6 | 202.5 | 7.3 |
| Menticirrhus americanus | 153.3 | 8.3 | 3.4 | 0.4 | 156.7 | 5.7 |
| Paralonchurus brasiliensis | 136.7 | 7.4 | 0.0 | 0.0 | 136.7 | 4.9 |
| Lutjanus synagris | 123.1 | 6.6 | 11.4 | 1.2 | 134.5 | 4.9 |
| Umbrina coroides | 108.6 | 5.8 | 14.8 | 1.6 | 123.4 | 4.5 |
| Orthopristis ruber | 85.4 | 4.6 | 0.0 | 0.0 | 85.4 | 3.1 |
| Cynoscion spp. | 82.9 | 4.5 | 0.0 | 0.0 | 82.9 | 3.0 |
| Cynoscion jamaicensis | 0.0 | 0.0 | 79.8 | 8.7 | 79.8 | 2.9 |
| Larimus breviceps | 60.4 | 3.3 | 17.0 | 1.9 | 77.4 | 2.8 |
| Sciades proops | 0.0 | 0.0 | 25.9 | 2.8 | 25.9 | 0.9 |
| Gerres cinereus | 25.6 | 1.4 | 0.0 | 0.0 | 25.6 | 0.9 |
| Mugil incilis | 2.0 | 0.1 | 23.4 | 2.6 | 25.4 | 0.9 |
| Sciades spp. | 25.2 | 1.4 | 0.0 | 0.0 | 25.2 | 0.9 |
| Centropomus spp. | 23.4 | 1.3 | 0.0 | 0.0 | 23.4 | 0.8 |
| Carcharhinus spp. | 21.6 | 1.2 | 0.0 | 0.0 | 21.6 | 0.8 |
| Mugil curema | 0.2 | 0.0 | 19.2 | 2.1 | 19.4 | 0.7 |
| Centropomus ensiferus | 0.0 | 0.0 | 17.0 | 1.9 | 17.0 | 0.6 |
| Calamus penna | 0.5 | 0.0 | 16.0 | 1.8 | 16.6 | 0.6 |
| Cathorops mapale | 10.8 | 0.6 | 5.6 | 0.6 | 16.4 | 0.6 |
| Selene vomer | 14.2 | 0.8 | 0.5 | 0.1 | 14.7 | 0.5 |
| Diapterus auratus | 0.0 | 0.0 | 13.6 | 1.5 | 13.6 | 0.5 |
| Aetobatus narinari | 3.5 | 0.2 | 6.3 | 0.7 | 9.8 | 0.4 |
| Lutjanus analis | 9.4 | 0.5 | 0.0 | 0.0 | 9.4 | 0.3 |
| Pomadasys crocro | 0.0 | 0.0 | 9.3 | 1.0 | 9.3 | 0.3 |
| Ariopsis sp. | 0.6 | 0.0 | 7.7 | 0.8 | 8.3 | 0.3 |
| Albula vulpes | 4.9 | 0.3 | 2.2 | 0.2 | 7.0 | 0.3 |
| Macrodon ancylodon | 6.6 | 0.4 | 0.0 | 0.0 | 6.6 | 0.2 |
| Mugil liza | 1.3 | 0.1 | 5.3 | 0.6 | 6.6 | 0.2 |
| Rhizoprionodon porosus | 0.0 | 0.0 | 6.4 | 0.7 | 6.4 | 0.2 |
| Centropomus undecimalis | 0.0 | 0.0 | 6.1 | 0.7 | 6.1 | 0.2 |
| Seriola rivoliana | 5.4 | 0.3 | 0.0 | 0.0 | 5.4 | 0.2 |
| Archosargus rhomboidalis | 0.0 | 0.0 | 5.3 | 0.6 | 5.3 | 0.2 |
| Hypanus guttatus | 0.0 | 0.0 | 5.1 | 0.6 | 5.1 | 0.2 |
| Diapterus spp. | 4.9 | 0.3 | 0.0 | 0.0 | 4.9 | 0.2 |
| Sphyraena picudilla | 4.6 | 0.2 | 0.0 | 0.0 | 4.6 | 0.2 |
| Rhinoptera bonasus | 0.0 | 0.0 | 4.6 | 0.5 | 4.6 | 0.2 |
| Sciades herzbergii | 0.0 | 0.0 | 3.8 | 0.4 | 3.8 | 0.1 |
| Hypanus spp. | 3.3 | 0.2 | 0.0 | 0.0 | 3.3 | 0.1 |
| Rachycentron canadum | 2.3 | 0.1 | 0.8 | 0.1 | 3.0 | 0.1 |
| Haemulopsis corvinaeformis | 2.7 | 0.1 | 0.0 | 0.0 | 2.7 | 0.1 |
| Hypanus americanus | 0.0 | 0.0 | 2.7 | 0.3 | 2.7 | 0.1 |
| Lobotes surinamensis | 2.3 | 0.1 | 0.4 | 0.0 | 2.7 | 0.1 |
| Oligoplites spp. | 2.6 | 0.1 | 0.0 | 0.0 | 2.6 | 0.1 |
| Lutjanus mahogoni | 2.6 | 0.1 | 0.0 | 0.0 | 2.6 | 0.1 |
| Rhomboplites aurorubens | 1.7 | 0.1 | 0.0 | 0.0 | 1.7 | 0.1 |
| Polydactylus virginicus | 1.4 | 0.1 | 0.2 | 0.0 | 1.6 | 0.1 |
| Haemulon parra | 0.0 | 0.0 | 1.3 | 0.1 | 1.3 | 0.0 |
| Haemulon plumierii | 1.1 | 0.1 | 0.2 | 0.0 | 1.3 | 0.0 |
| Anisotremus virginicus | 0.0 | 0.0 | 1.0 | 0.1 | 1.0 | 0.0 |
| Trachinotus carolinus | 0.4 | 0.0 | 0.4 | 0.0 | 0.9 | 0.0 |
| Eucinostomus melanopterus | 0.0 | 0.0 | 0.7 | 0.1 | 0.7 | 0.0 |
| Priacanthus arenatus | 0.7 | 0.0 | 0.0 | 0.0 | 0.7 | 0.0 |
| Amphichthys cryptocentrus | 0.0 | 0.0 | 0.6 | 0.1 | 0.6 | 0.0 |
| Others (19) | 1.7 | 0.1 | 1.6 | 0.2 | 3.3 | 0.1 |
| Grand total | 1,856.8 | 100 | 915.6 | 100 | 2,772.4 | 100 |
Assessment of fishing effort
Regarding fishing power, no statistically significant differences were observed between the 2 variables that were evaluated to characterize the sizes of the set gill nets used during the 2 study periods: length of gill net (W = 3,441.5, P ˃ 0.05) and height of gill net (W = 3,745.5, P ˃ 0.05). It is worth noting, however, that the length of the nets used during the second period tended to increase. On the other hand, a highly significant difference was observed in the duration of fishing trips between the 2 periods (W = 306,245.0, P ˂ 0.005) because total duration of fishing trips increased in the second period.
Significant dependence was observed between frequencies of the different mesh sizes used in the study area and the evaluated time period (G = 13.98, P ˂ 0.05). During the second period the use of meshes measuring 2-3 inches increased and the use of meshes measuring 4-5, 7-8, and 9-10 inches decreased. Another significant dependence for the evaluated time period was detected for the variable “fishing trip schedule” (G = 863.4, P ˂ 0.0001). This interanual difference was due to the relative increase in the number of fishing trips carried out “at dusk”, which was concomitant with the decrease in the number of fishing trips carried out “at dawn”.
Regarding the spatial distribution of fishing effort, in 2013 the fleet shifted its fishing effort toward the southwestern zone of the GoS (to the east of the mouth of the Magdalena River, in Bocas de Ceniza), contrasting that observed for 2008, when fishing trips were concentrated in areas near the fishing communities. In fact, in comparison with the trend observed for 2008, higher percentages of fishing trips were observed in the western sector of the gulf in 2013 (Fig. 5a, b). Moreover, in 2013 fishing trips were observed near Bocas de Cenizas, a sector that was not exploited in 2008.

DISCUSSION
The multivariate and univariate analyses indicated the occurrence of short-term structural changes in the demersal fish assemblages exploited by the artisanal set gill net fishery of the GoS. For example, uniformity in assemblage structure tended to be higher in the second sampling period. Variation in the number of typifying species in each period was also reported. A total of 8 species explained 91.6% of the similarity reported for 2008, while only 2 species explained 93.4% of the similarity reported for 2013. The historical changes in catch compositions should also be noted. Indeed, 2 studies carried out in the same zone in the mid-1990s found that these assemblages were typified by taxa from the Lutjanidae family (García et al. 1998, Manjarrés 2011), whereas in the present study the most relevant species were B. marinus, C. nobilis, T. lepturus, Paralonchurus brasiliensis, M. americanus, M. furnieri, U. coroides, and Lutjanus synagris (the only relevant lutjanid).
Other studies in this region (Altamar et al. 2015, Marrugo et al. 2015) also highlighted M. furnieri and T. lepturus as frequent species in the landings from set gill nets, and they even highlighted the predominance of immature individuals. These studies also noted the historical trend of decreasing mesh sizes, as was observed in the present study (increased use of 2-3 inch mesh sized gill nets and decreased use of 4-10 inch mesh sizes). It is worth noting that in the study region artesanal fishers tend not to modify their gill nets (specifically mesh sizes) with the seasonality of resources, given the multispecies nature of catches obtained with different mesh sizes. In fact, a previous study on the selectivity of gill nets carried out in the region (Manjarrés 1993) evidenced high species diversity in catches obtained with nets having mesh sizes of 23/4 and 31/2 inches, where only average sizes in catches varied with mesh size.
Short-term variations in demersal fish assemblages have been documented for tropical and temperate regions (Wantiez et al. 1996, Manjarrés 1998, Sousa et al. 2005, Bergastad et al. 2008, Magurran et al. 2015). For example, changes in species composition and degree of homogeneity of demersal fish assemblages occurring in a relatively short period of time were detected in relatively small geographical areas in the North Atlantic (Magurran et al. 2015). In the northern part of the Baltic Sea, regional eutrophication patterns together with fishing pressure have also caused short-term seasonal variations in species abundances, size structure, and the annual mean trophic level of fish assemblages (Mustamäki and Mattila 2015). The weighted average of the trophic level of species landed in the zone was higher in 2013 than in 2008. It is worth noting that the species that contributed the most to the structural changes seem to have similar functional characteristics as those that lost dominance in the assemblage from the second period. A similar situation has also been documented for subareas of fishing area 27 of the Food and Agriculture Organization of the United Nations (Jayasinghe et al. 2017). In addition, other studies have reported increasing values of the mean anual trophic levels of species landed in Madeira and the Azores (Portugal), though the timescale was much larger than the timescale analyzed in the present study (Baeta et al. 2009, Hermida and Delgado 2016).
A decreasing trend of the average LPUE values was also recorded for the main landed species. This was the case for C. nobilis, B. marinus, M. americanus, and U. coroides. Decreasing catch rates appear to be related to the high levels of fishing pressure on species exploited by various types of fisheries in the zone, including the gill net fishery; for example, C. nobilis is one of the main target species of the artesanal handline fishery that operates in the zone (Manjarrés 1993). Some studies have reported that this decreasing trend in catch rates is common for resources subjected to the high levels of fishing effort exerted by artisanal fisheries and even more so when various types of fishing gear and fishing methods are used (Fariña et al. 1997, García et al. 2007). These temporal changes help explain the structural variations observed in demersal fish assemblages in the GoS.
It is worth noting that there were also short-term variations in the technological features of the set gill nets used in the GoS, with decreasing mesh sizes being the most significant trend. This sort of trend has also been reported for other fishing gears used in the region, such as cast nets and encircling gill nets (Narváez et al. 2008). The historical decrease in mesh sizes of gill nets used in GoS has also been reported (Marrugo et al. 2015). These mesh-size variations determine significant changes in the selectivity of sizes and even species and can therefore play a key role in the compositional and structural changes observed for the fish assemblages exploited with set gill nets in GoS between the 2 evaluated periods (Karlsen and Bjarnason 1987, Sparre and Venema 1997). Moreover, these changes could be associated with the effects of other fishing gear used in GoS, such as encircling gill nets, small trawls, and beach seines, which catch a wide variety of species as bycatch (Rueda et al. 1997, Narváez et al. 2008, Manjarrés et al. 2014).
Short-term changes were also observed in the duration and schedule of fishing trips carried out by the set gill net fleet operating in GoS. We found that the duration of fishing trips tended to increase and fishing schedules shifted to dusk hours, which means fishing trips must have started at evening twilight, which for the tropical region occurs between 5:00 PM and 6:00 PM, depending on the time of year. These changes could also be affecting catch compositions if the different ethological aspects of demersal species are taken into account, such as the natural cyclic habitat migrations to feed and seek preferential refuge and breeding zones, especially in tropical environments like coral reefs or seagrass beds, where these behaviors can affect abundance, composition, heterogeneity, and trophic group structure during the twilight hours (Kruse et al. 2016).
On the spatial distribution of fishing effort, the área covered by the set gill net fleet evidently expanded toward the southwest area of the GoS. Historical changes in the spatial distribution of gill net fishing units have been referenced for the Caribbean Sea off Colombia (Marrugo et al. 2015). Another fact that should be noted was the occurrence of fishing trips near the Ánimas Bank, an area characterized by coral reef formations along the edge of the continental shelf. According to the traditional ecological knowledge of the fishers that were interviewed, variations in fishing effort were mainly associated with 3 factors: (1) the decrease in abundance of main landed species, in fact to levels of near depletion of fishing stocks for some species, such as the Atlantic tarpon (Megalops atlanticus); (2) the introduction of coal seaports in the region; and (3) the ongoing polluting actions over highly productive areas.
In conclusion, 4 factors were found to be possibly associated with the changes observed in the structure of demersal fish assemblages exploited by the artisanal set gill net fishery operating in GoS. These factors were (1) changes in the technological characteristics of gill nets, with mesh sizes tending to decrease; (2) increased fishing pressure, basically determined by increased fishing trip duration; (3) variations in fishing trip schedules; and (4) expansión of the spatial distribution of fishing effort to the southwestern area of the GoS and surrounding areas around the Ánimas Bank. The results of this research highlight the importance of conducting ecosystem-level research to support the implementation of fishery management strategies and control measures by the competent authorities, especially in areas with high fishing pressure, such as the GoS, where initiatives to implement a responsible fishing regime are still incipient.

