


 nueva página del texto (beta)
 Inglés (pdf)
 Artículo en XML
 Referencias del artículo
 Enviar artículo por email
 Citado por SciELO
  Similares en
SciELO
Similares en
SciELO 
 Permalink
Introduction
For fisheries management to be effective, information on the structure and dynamics of the exploited population is needed. Growth parameters and mortality rates are essential to evaluate fish populations and are even more significant for stock-structured populations. These population parameters indicate the response of fish to environmental and fisheries pressure (Gherard et al. 2013).
Historically, the von Bertalanffy model has been used to describe the growth of marine fish (Katsanevakis and Maravelias 2008), despite the existence of alternative models, because its parameters form the basis for other fisheries analyses, such as yield by recruit (Zhu et al. 2009). Moreau (1987) stated that the von Bertalanffy model does not always adjust adequately to data trends, due to changes in the life history of organisms, fishing pressure, and samplings. As a result, more than one model needs to be evaluated to describe growth and mathematical tools are relied upon to choose the best model (Burnham and Anderson 2002). Information theory (Akaike information criterion) has been used as a selection criterion in multi-model approaches (Cruz-Vázquez et al. 2012). This type of approach is based on the parsimony principle: from a set of candidate models, the “best” model is selected considering the relationship between model complexity and model adjustment (Aragón-Noriega 2013). This principle aims to evaluate the biological and statistical plausibility of different models for growth description to maximize the potential of data, as opposed to basing this description on only one model (Cailliet et al. 2006). This approach provides estimates with lower parameter uncertainty to establish scientific and fisheries bases for resource assessment.
The Opisthonema genus comprises 3 thread herring species off northwestern Mexico: Opisthonema libertate, Opisthonema medirastre, and Opisthonema bulleri. These species are distributed from central Baja California, including the Gulf of California, to Ecuador (Whitehead and Rodríguez-Sánchez 1995). Thread herring has been exploited in Mexico for over 4 decades, and fisheries yields have shown an increasing trend. Nonetheless, growth and mortality by species have scarcely been studied. The 3 thread herring species are extremely similar, and taxonomic keys are required for their identification (Berry and Barret 1963). Opisthonema libertate comprises the maximum proportion (between 50% and 70%) of total thread herring catches (Ruiz and Lyle 1992, Jacob-Cervantes 2010). Pérez-Quiñonez et al. (2018) recently identified 3 morphotypes for this species on the Pacific coast of northwestern Mexico and associated each morphotype with one of the 3 fishing areas in the region (Bahía Magdalena, Baja California Sur; Mazatlán, Sinaloa; and Guaymas, Sonora). Therefore, the objective of the present study was to obtain precise information on individual growth parameters using a multi-model approach and mortality estimators for each O. libertate morphotype, providing evidence of the biological differences (population parameters) between the O. libertate morphotypes from each fishing area off the coasts of northwestern Mexico.
Materials and methods
Sampling
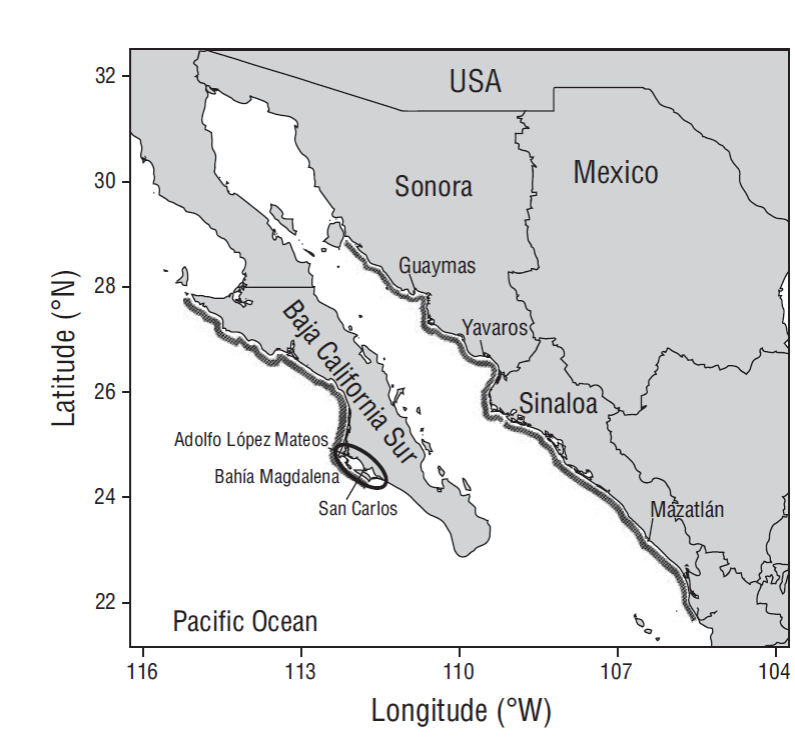
Up to 100 specimens were selected monthly from commercial small pelagic fish landings from 2013 to 2018 in the port of Mazatlán and from 2014 to 2018 in the Guaymas, Yavaros, Adolfo López Mateos, and San Carlos ports (Fig. 1). The standard length (± 1 mm) of each specimen was recorded. The first gill arch (for taxonomic identification) and sagittal otoliths (for age determination) were extracted.
Taxonomic identification
Taxonomic identification to species level was performed using the key proposed by Berry and Barret (1963) for the Opisthonema genus, which mainly considers the number of gill rakers on the ceratobranchial bone of the first gill arch. According to this key, O. libertate has 79 to 120 gill rakers, O. medirastre has 50 to 69 gill rakers, and O. bulleri has 26 to 36 gill rakers. As in Pérez-Quiñonez et al. (2017), in the present study the presence/absence of spicules on the gill rakers and the angle of insertion of the gill rakers into the ceratobranchial bone were also used: in O. libertate the base of the gill raker is straight and does not have spicules; in O. medirastre the base of the gill raker is straight with a low to moderate number of; and in O. bulleri the base of the gill raker is straight with abundant spicules.
Age determination
A subsample stratified by size was selected from the total number of O. libertate specimens collected in each fishing area for age determination. This subsample guaranteed the inclusion of specimens from the entire length interval. Prior to the observation of the superficial otolith structure, otoliths were baked during 15 min using a conventional microwave oven to make growth marks more evident. This procedure darkens the hyaline band and increases the contrast with the opaque band (Pentilla et al. 1988). Age was estimated by 2 independent readers counting hyaline growth bands. Each growth mark was defined by a hyaline band and an opaque band, which are seen as light and dark bands, respectively, under transmitted light. A growth mark was considered to be completely deposited when the start of the next opaque band was observed. Once each reader had counted all growth marks, precision was evaluated using the average percent error (APE) proposed by Beamish and Fournier (1981):
where N is the number of organisms for which age was estimated, R is the number of readings per structure, Xij is the ith reading of the jth structure, and Xj is the average number of growth marks for the jth structure. The coefficient of variation (CV) (Chang 1982) was also calculated using the same notation and variables as in equation (1):
In both cases, values below 10% were considered adequate (Morison et al. 1998). To assign a time unit to growth marks, the monthly percentage of the type of otolith edge (opaque or hyaline) was analyzed using all identified age groups.
Size at age ≤1 year
In the best of cases, fisheries catch the largest organisms from the youngest age groups. These organisms therefore overrepresent the average size of the zero-age group, negatively affecting the estimate of the growth coefficient. To reduce this bias, we included in our analysis age-size data pertaining to 74 O. libertate larvae (0.29-2.27 cm) reared in laboratory from eggs collected in Bahía Almejas, Baja California Sur (Matus-Nivón et al. 1989), and age-size data pertaining to O. libertate juveniles (4.10-11.80 cm) sampled during research cruises by personnel from the National Fisheries Institute (INAPESCA, Mexico) in the Gulf of California to obtain early indicators of the reproductive success of small pelagic fish species (June and November 2014, March and November 2015) (unpublished data).
Description of individual growth (multi-model approach)
To describe the individual growth of O. libertate, 5 models were selected depending on the trend of the age-size data set, namely the von Bertalanffy, Gompertz, logistic, Richards, and Schnute (type 1) models. These models tend towards an asymptotic value of length as a function of age. The growth parameter estimators were obtained by adjusting the models to the age-size data, including data for larvae, juveniles, and adults, and by maximizing the likelihood normal function (Haddon 2011) using Newton’s direct search algorithm. The 95% confidence intervals for growth parameters were estimated by using the calculation of the likelihood profile, assuming a χ2 distribution with m degrees of freedom (Polacheck et al. 1993).
Selection of the best growth model (Akaike information criterion)
The most adequate model was selected using the Akaike information criterion (AIC), according to which the model with lowest AIC value (AICmin) is the most adequate for the description of growth:
where LL is the likelihood value resulting from each of the adjusted models and k is the number of parameters in the model.
The AICi differences (Δi = AICi - AICmin) were estimated to evaluate the statistical robustness of the models. According to Burnham and Anderson (2002), models with Δi > 10 are not statistically supported and should be omitted from the analysis, models with Δi < 2 have substantial support (high), and models with 4 < Δi < 7 have much less support (medium). The plausibility of each model was evaluated by calculating the AIC weight (wi) with the equation proposed by Burnham and Anderson (2002):
According to the multi-model approach the average value of the asymptotic length
where
Comparison of individual growth
Once the model that best described the trend of age-size data by fishing area was identified, differences in parameters between pairs of fishing areas (Bahía Magdalena vs Mazatlán, Bahía Magdalena vs Guaymas, and Mazatlán vs Guaymas) were evaluated using the likelihood ratio test proposed by Kimura (1980):
where k is the degrees of freedom (number of parameters), N is the total number of data from both curves (pair of fishing areas), SRCΩ is the total sum of squared residuals obtained from fitting model to each data set per area, and SRCω is the total sum of squared residuals obtained from fitting the model to the data of the 2 areas combined.
Mortality and exploitation rate
Total mortality (Z) was estimated using the catch curve according to Baranov’s model (Ricker 1975), which takes into account abundance by age group in the catch as a reflection of population abundance:
where n is the number of organisms, a is the ordinate at the origin, b is -Z, and t is the age in years. The empirical equation proposed by Tanaka (1960) was used to estimate natural mortality (M):
where Age t is the maximum observed age of analyzed specimens. Exploitation rate (E) was estimated using the equation described by Cushing (1977):
where F is mortality due to fisheries (Z - M). This equation assumes that the optimum exploitation rate (Eoptimum) occurs when F is equal to M, so the general assumption is that Eoptimum = 0.5.
Results
Age determination
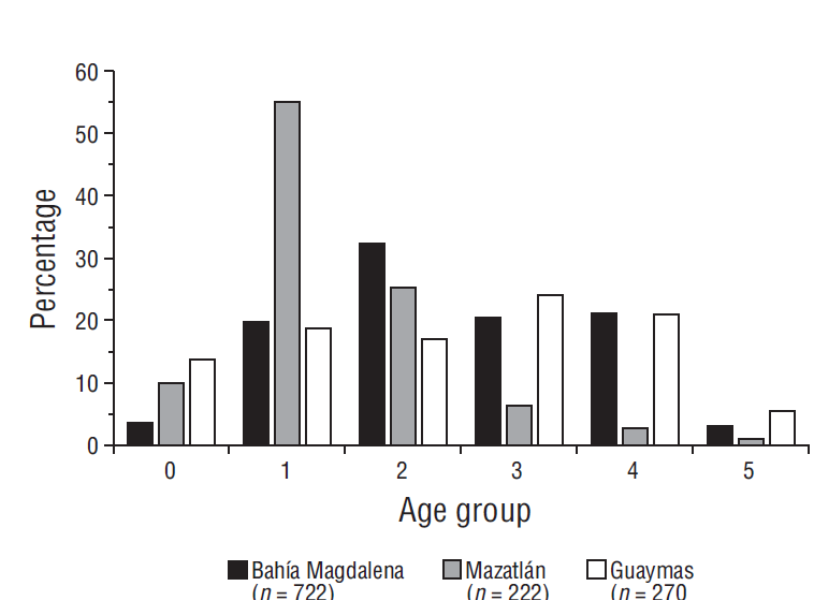
A total of 1,214 otoliths were read, of which 722 were collected in Bahía Magdalena (Adolfo López Mateos and San Carlos ports in Baja California Sur), 270 were collected in Guaymas (Guaymas and Yavaros ports in Sonora), and 222 were collected in Mazatlán (port of Mazatlán in Sinaloa) (Table 1). Reading precision did not show significant differences between readers (APE = 2.7, CV = 4.6). Up to 6 age groups were identified in the 3 fishing areas (0-5). The most representative age groups in landed catches were group 2 (32%) for Bahía Magdalena, group 1 (56%) for Mazatlán, and groups 3 and 4 (45%) for Guaymas (Fig. 2).
Table 1 Sampling information by fishing area for organisms identified as Opisthonema libertate from June 2012 to December 2015 in Bahía Magdalena (BM), Mazatlán (MZT), and Guaymas (GYM). The values in parentheses correspond to the number of organisms examined for age determination.
| No. of months sampled | No. of fish examined | Mean stantard length (cm) | Average age (years) | ||||||||||||
| Year | BM | MZT | GYM | BM | MZT | GYM | BM | MZT | GYM | BM | MZT | GYM | |||
| 2012 | 4 | 151 (61) | 15.3 | 1.5 | |||||||||||
| 2013 | 10 | 466 (152) | 15.9 | 1.9 | |||||||||||
| 2014 | 11 | 1 | 10 | 1,395 (240) | 12 (9) | 348 (242) | 17.4 | 13.4 | 16.4 | 2.5 | 0.3 | 2.3 | |||
| 2015 | 11 | 3 | 595 (482) | 158 (28) | 16.7 | 17.6 | 2.4 | 2.4 | |||||||
Periodicity of growth mark formation
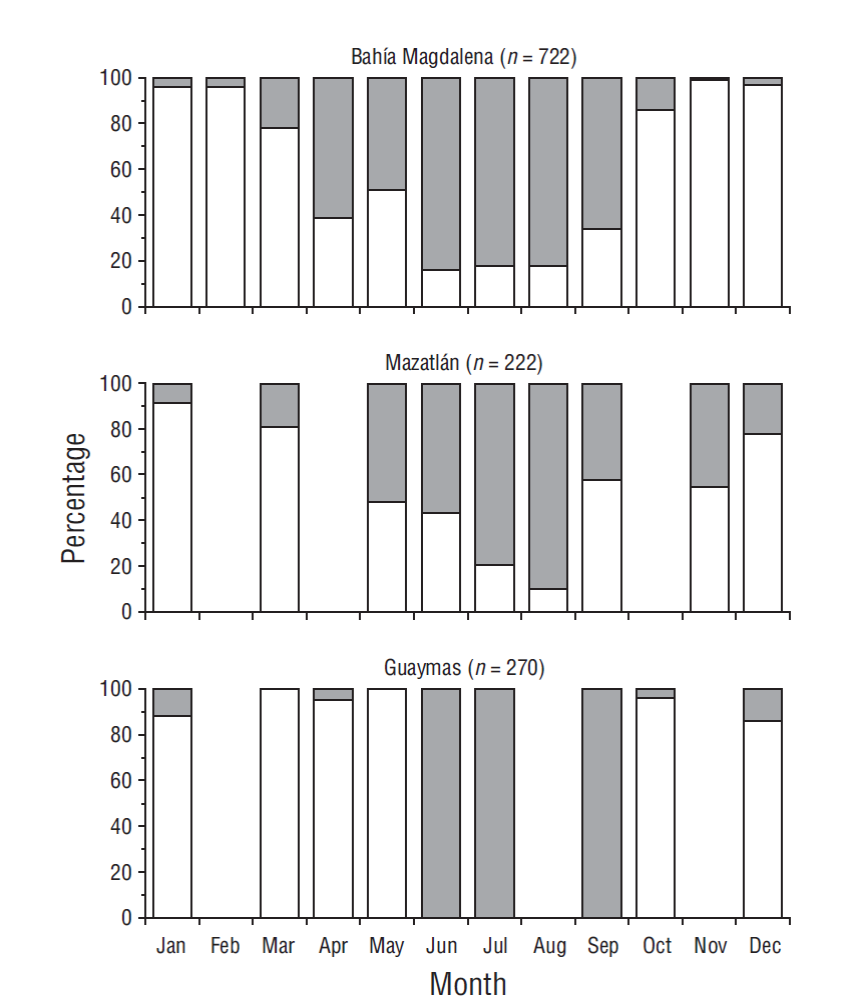
The highest percentage of hyaline edges in otoliths was obtained from June to September in Bahía Magdalena, from May to August in Mazatlán, and from June to September in Guaymas. A high monthly percentage of hyaline edges indicates the end of growth mark formation. Each growth band was formed over approximately 6 months. These results suggest that the periodicity of growth mark formation was annual, and deposition ended, with small variations in the transition, from August to September in all 3 fishing areas (Fig. 3).
Estimation of growth parameters
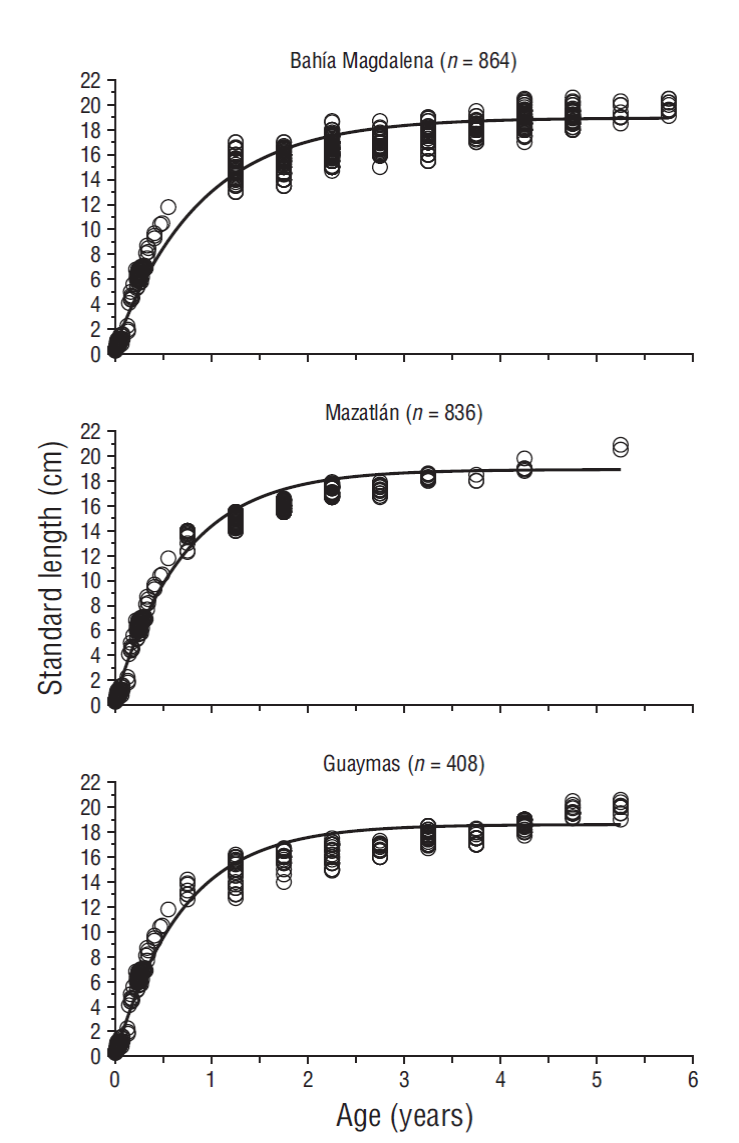
The von Bertalanffy, Richards and Schnute models adjusted satisfactorily to the age-size data, contrary to the Gompertz and logistic models (Fig. 4). Due to the different mathematical formulations of each model, the parameters have a different meaning and cannot be compared, except for L∞, which varied between 17.57 to 20.03 cm standard length.
Selection of growth model (Akaike information criterion)
The model with lowest AIC in the 3 fishing areas was the von Bertalanffy model (Table 2). Results indicated that for the 3 fishing areas the Gompertz and logistic models were not adequate to describe the growth of this species, as Δi (AICi differences) values very close to or higher than 10 were obtained. The remaining models (von Bertalanffy, Richards, and Schnute) had high statistical support (Δi < 2) to describe the growth of the O. libertate with the analyzed data. The von Bertalanffy model had the best statistical support.
Table 2 Individual growth parameter estimates for the Pacific thread herring, Opisthonema libertate, for each evaluated model, by fishing area. Abbreviations are t0, age at inflection point (Gompertz and logístics models) and age at zero length (von Bertanlanffy, Richards, and Schnute models); k, growth coefficient at inflection point; L∞, asymptotic length; m, nondimensional parameter; a, relative growth rate; b, inherent constant for relative growth rate; y1 and y2, observed length at minimum observed age (t1) and maximum observed age (t2); and AIC, Akaike information criterion.
| Model | t0 | k | L∞ | m | a | b | y1 | y2 | AIC |
| Bahía Magdalena | |||||||||
| Von Bertalanffy | -0.03 | 1.13 | 18.68 | 37.40 | |||||
| Gompertz | 0.46 | 1.81 | 18.34 | 47.62 | |||||
| Logistic | 0.73 | 2.64 | 18.18 | 54.45 | |||||
| Richards | -0.03 | 1.14 | 18.68 | 0.002 | 39.40 | ||||
| Schnute (type 1) | -0.03 | 20.01 | 1.1 | 0.97 | 0.7 | 19.98 | 39.40 | ||
| Mazatlán | |||||||||
| Von Bertalanffy | -0.020 | 1.41 | 18.63 | 37.99 | |||||
| Gompertz | 0.340 | 2.63 | 18.09 | 47.86 | |||||
| Logistic | 0.500 | 4.24 | 17.86 | 55.31 | |||||
| Richards | -0.020 | 1.41 | 18.60 | 0.002 | 39.99 | ||||
| Schnute (type 1) | -0.020 | 20.03 | 1.4 | 0.95 | 0.4 | 20.02 | 39.99 | ||
| Guaymas | |||||||||
| Von Bertalanffy | -0.002 | 1.44 | 18.22 | 41.12 | |||||
| Gompertz | 0.340 | 2.72 | 17.76 | 50.56 | |||||
| Logistic | 0.490 | 4.30 | 17.57 | 57.51 | |||||
| Richards | -0.002 | 1.44 | 18.21 | 0.001 | 43.12 | ||||
| Schnute (type 1) | -0.002 | 20.03 | 1.4 | 0.95 | 0.4 | 20.02 | 43.12 | ||
To generate the average growth model for each fishing area, the average
There were significant differences between all pairs of fishing area (Bahía Magdalena vs Mazatlán, P < 0.05; Bahía Magdalena vs Guaymas, P < 0.05; Mazatlán vs Guaymas, P < 0.05) for the growth parameter estimates of the von Bertalanffy model (the most adequate model). The 95% confidence intervals of the parameter estimators of the von Bertalanffy model for each fishing area were L∞ = 17.80/19.70, k = 0.80/1.60, and t0 = -0.10/0.30 for Bahía Magdalena; L∞ = 17.70/19.70, k = 1.00/1.90, and t0 = 0.10/0.03 for Mazatlán; and L∞ = 17.40/19.20, k = 1.10/1.96, and t0 = 0.10/0.03 for Guaymas.
Mortality
The obtained Z estimators were 1.93 y-1 for Bahía Magdalena, 1.39 y-1 for Mazatlán, and 1.40 y-1 for Guaymas. The estimated M was the same for the 3 fishing areas, as the longest-lived Pacific thread herring were the same age (5 y). Mortality by fishing area (F) was 1.33 y-1 for Bahía Magdalena, 0.79 y-1 for Mazatlán, and 0.8 y-1 for Guaymas. The estimated value for E was 0.7 y-1 for Bahía Magdalena, 0.6 y-1 for Mazatlán, and 0.6 y-1 for Guaymas.
Discussion
Periodicity of growth marks
Monthly percentages of opaque and hyaline otolith bands for O. libertate suggested that growth marks formed with annual periodicity and their formation ended at the end of summer. Some authors, such as Manickchand-Heilman and Kenny (1990) and González and Eslava (1999), reported that in tropical fish species growth mark formation is associated with the period of reproductive activity. In the case of O. libertate the formation of the hyaline band coincided with the period of maximum reproductive activity (summer) in the southern Gulf of California, where Pacific thread herring with mature gonads have been detected from June to September.
Previous studies on the age and growth O. libertate did not report precise information on the periodicity of growth mark formation. For example, Carmona and Alexandres (1994) and Gallardo-Cabello et al. (1993) assumed that the periodicity of growth mark formation was annual, without providing qualitative or quantitative analyses. García-Gómez and Molina (1986) reported that the periodicity of growth band formation was semiannual, as they observed 2 growth bands per year in scales, which they linked to 2 reproductive periods (one in the cold season and one in the warm season). However, Pacific thread herring were not identified taxonomically in that study, and it is possible that O. medirastre specimens were included in the sample. The Pacific thread herring, O. libertate, spawns during summer, and the middling thread herring, O. medirastre, spawns during winter. This spawning period would explain why the authors identified the formation of growth marks during different times of the year. Our results indicate that the Pacific thread herring, O. libertate, deposits one growth mark per year.
Similar results to those found in this study have been reported for other small pelagic fish. Alvarado-Castillo and Félix-Uraga (1996) tracked ages through time and reported annual growth marks for the Pacific sardine, Sardinops sagax. The monthly frequency of S. sagax otoliths with opaque and hyaline edges was analyzed and the formation of annual growth marks was identified (Quiñonez-Velázquez et al. 2000). Chiappa-Carrara and Gallardo-Cabello (1992) indicated that growth mark formation in the northern anchovy, Engraulis mordax, was also annual, with formation of an opaque growth mark in summer-fall and of a hyaline mark in winter-spring. For the Pacific chub mackerel, Scomber japonicus, a modal group with hyaline edges (November-March) and a modal group with opaque edges (April-October) were identified, which indicated that each growth mark corresponded to one year (Gluyas-Millán and Quiñonez-Velázquez 1996).
Age determination
Growth marks were evident in all O. libertate otoliths, and up to 6 age groups were recorded. Group 5 was the least well-represented, as the younger age groups were more abundant. Lagler et al. (1977) reported that a low abundance of older specimens in the age structure is a consequence of greater accumulated mortality compared with younger organisms, with fisheries being one of the main factors that considerably decrease the abundance of larger organisms.
The presence of broken otoliths did not prevent readings, as growth marks were counted at the posterior end of the otolith, and therefore absence of the rostrum and antirostrum in some cases did not cause difficulty. The first age groups were easily identifiable during the otolith reading process, whereas marks close to the otolith edge were more difficult to distinguish due to their proximity to each other, which is a consequence of the decrease in the width of growth marks. This situation was more evident in age groups 4 and 5. Lucena and O’Brien (2001) mentioned that this situation is common in several species, as growth rate declines significantly in adults but growth marks continue to be deposited on the otolith edge, with a continually decreasing distance between them.
Prior to the present study, 3 studies focused on direct age determination of O. libertate: Carmona and Alexandres (1994), García-Gómez and Molina (1986), and Gallardo-Cabello et al. (1993). These authors identified up to 4, 6, and 7 age groups, respectively. However, the last 2 did not identify organisms taxonomically, and it is possible that they included more than one of the sympatric species from the Opisthonema genus found in northwestern Mexico. Therefore, the results of previous studies should be used with caution with regard to the age structure of the O. libertate.
Multi-model approach to individual growth
Individual growth in O. libertate showed accelerated growth during the first year of life, with sizes of 13.1-14.4 cm standard length, representing approximately 74% of asymptotic length. Growth rates then gradually decreased, nearing the asymptotic phase.
Of the 5 models evaluated to describe individual growth in O. libertate, the lowest AIC value was obtained with the von Bertalanffy model. This model showed the greatest statistical plausibility and was the most adequate to describe the age-size data trend of O. libertate in the 3 fishing areas. This model assumes that environmental conditions are constant (Araya and Cubillos 2006) and that fish growth is conditioned by the physiological processes of catabolism and anabolism. However, according to the multi-model approach, the Richards and Schnute (type 1) models were also statistically robust (∆i < 2) enough to describe the growth of O. libertate.
The Richards model included a shape parameter that provided greater precision for curve modeling, and the inflexion point could be located at any value between the minimum and the asymptote (Birch 1999). Schnute’s model (type 1) showed a versatile theoretical curve that could take the shape of several models depending on parameter values (Schnute 1981) and allowed parameter estimation in the absence of very young or very old individuals (Cerdenares-Ladrón de Guevara et al. 2011). Guzmán-Castellanos et al. (2014) suggests that Schnute’s model has the advantage of being a mathematical generalization that can describe asymptotic and non-asymptotic growth models, depending on the resolved parameters and on the initial conditions assumed for its solution; it can also be applied to data not only of fish but also of other taxa such as mollusks, echinoderms, crustaceans, and coelenterates (Troynikov and Gorfine 1998, Shelton et al. 2006, Rogers-Bennett et al. 2007, Flores et al. 2010, Schwarz and Alvarez-Perez 2010). The Richards model can also be applied to other taxa and has been successfully used to describe growth in sharks, bovines, and buffalos (Peroto et al. 1992, Katsanevakis 2006).
Sigmoidal models (Gompertz and logistic) did not have enough statistical support to describe the growth of O. libertate. These models described a curve with a relatively slow start, followed by an exponential phase, and finally a decrease in growth rate towards the asymptotic part of the curve. These models could probably be useful to describe O. libertate growth patterns during early life stages. Campana and Jones (1992) stated that the Gompertz model has been frequently used to describe growth of fish larvae and juveniles. Quiñonez-Velázquez et al. (2000) used this model for S. Sagax juveniles in the Gulf of California; Álvarez and Morales-Nin (1992) used it for Sardina pilchardus juveniles in the western Mediterranean Sea; and Watanabe and Kuroki (1997) used it for Sardinops melanostictus juveniles in coastal waters of western Japan.
Mortality
There are no previous reports of M for species of the Opisthonema genus in Mexico. González-Cabellos and Mengual-Izquierdo (1995) estimated M at 0.52 y-1 for Opisthonema oglinum caught in Margarita Island, Venezuela. This value coincides with that estimated in the present study, although it is lower than estimates reported for other clupeids, for which mortalities (M > 1 y-1) (García-Franco et al.1995, Canales and Leal 2009) that match the biological characteristics of small pelagic fish (short life cycle and high growth rate) have been reported.
The estimates obtained in this study for E fluctuated between 0.6 and 0.7 y-1. According to Gulland (1971), the optimum exploitation point of a resource occurs when Eoptimum = 0.5. Moreover, it has been suggested that resources with E > 0.75 are considered to be under intense exploitation (Arreguín-Sánchez et al. 2000). Considering this suggestion, O. libertate off the northwestern coast of Mexico does not show signs of overexploitation.
Differences identified between individual growth parameters and mortality rates per fishing area coincide with results reported by Pérez-Quiñonez et al. (2018), who identified differences in the phenotypic expression of this species in northwestern Mexico. In general, our results strengthen the evidence of the presence of 3 population units or stocks of O. libertate in Pacific waters off northwestern Mexico. This finding will allow management improvement for this fishery resource, as the analysis of the population structure of a species is of great importance for the development of optimal strategies for their efficient exploitation; stock delimitation is a requirement for any evaluation (Cadrin et al. 2005).
Coyle (1998) stated that stock identification must consist of an integral analysis that includes different aspects of the life history. The analyses of phenotypic expression and population parameters complement each other adequately to achieve this objective, as they can show evidence of environmental pressure and fisheries pressure on stocks. Fish from a stock are assumed to respond in a similar manner to perturbations, and these responses can be considered an attribute of the stock (Casselman et al. 1981, Ihssen et al. 1981). Moreover, the estimation and comparison of population parameters derived from age-size data have been widely used over time as tools for stock identification and have also provided basic information for calculations of yield and productivity, which provide the bases for the evaluation and management of stocks (Casselman et al. 1981). The most commonly used parameters are size and age structure (Boyar 1968, Casselman et al. 1981, Hanchet, 1999); maximum age, size, and weight (Begg et al. 1999, Fromentin and Fonteneau 2001); multi-modal analysis and age groups (Hanchet 1999); M rates (Begg et al. 1999, Horn and Hurst 1999, Williams et al. 2003); size-weight relationships (Japp 1990, Lowe et al. 1998); and individual growth parameters (Griffiths 1996, DeVries and Grimes 1997).
Using the information provided thus far on the population dynamics and structure of O. libertate, future studies on this species should be directed towards stock assessment, evaluating different exploitation scenarios and designing proposals for management actions based on sustainability.
In summary, a total of 6 age groups (0-5) and an annual periodicity in growth mark formation were identified for O. libertate. According to the multi-model approach, the von Bertalanffy growth model was the most adequate to describe O. libertate growth on the northwestern coasts of Mexico; however, the Richards and Schnute (type 1) models could also be used. The estimated E suggests that the exploitation level of this resource in northwestern Mexico does not show signs of overexploitation and that it is being used appropriately. There is enough evidence to support the existence of 3 population units or stocks of O. libertate on the northwestern coast of Mexico.

