


 nueva página del texto (beta)
 Inglés (pdf)
 Artículo en XML
 Referencias del artículo
 Enviar artículo por email
 Citado por SciELO
  Similares en
SciELO
Similares en
SciELO 
 Permalink
Introduction
Eastern boundary upwelling ecosystems have been a focus of attention in coastal oceanography due to their high primary productivity. Equatorward and poleward flows are commonly observed in these systems (Hill et al. 1998). Two different equatorward flows are regularly observed in eastern boundary upwelling ecosystems, one associated with the eastern limb of the anticyclonic subtropical gyre and the other with upwelling dynamics (Philander and Yoon 1982). Poleward flows have 2 signatures in the California Current System, a poleward California Undercurrent, confined to the continental slope, and a surface poleward current (i.e., Davidson Current) (Hickey 1979, Gay and Chereskin 2009). Durazo (2015) discussed the seasonality of the geostrophic signatures of the equatorward and poleward flows in the southern part of the California Current and found that the variability of the balanced flows was correlated with wind forcing.
In the eastern boundary upwelling ecosystems, surface poleward currents are regularly associated with wind relaxation; for example, Relvas and Barton (2002), using satellite imagery and observations over the coast of the Iberian Peninsula, found a relationship between winds and the coastal countercurrent. The same relation was found by Garel et al. (2016) for the inner shelf of the Gulf of Cadiz by using a multiyear time series of Acoustic Doppler Current Profiler (ADCP) observations and relating it to winds from different sources. Winant et al. (2003) reported several circulation patterns at the boundary between the central and southern California coasts, showing that when upwelling-favorable winds cease or relax a poleward flow develops. Melton et al. (2009), using wind time series from buoys, identified wind relaxation events over central California waters and associated them with warm poleward currents. Torres and Gomez-Valdes (2015) also found that poleward flow events follow wind relaxation events off the northern Baja California coast.
In the southern part of the California Current System, winds predominantly blow from the northwest (equatorward and parallel to the coast) throughout the year (Bakun and Nelson 1991). This pattern is even observed in average fields over a short period of time (days) or in climatologies as the ones shown in Soto-Mardones et al. (2004). The aim of this study is to evidence from vessel-mounted ADCP data that poleward flow events follow wind relaxation events in the northern Baja California upwelling region. In addition, the upwelling pattern is discussed. A new technique for the separation of the wind field into upwelling-favorable winds and relaxation events is introduced. Ocean wind observations obtained from satellite remote sensors and shipboard observations from 4 Mexican Investigations of the California Current (IMECOCAL, for its acronym in Spanish) cruises with a vessel-mounted ADCP and a conductivity-temperature-depth (CTD) profiler are used to describe ocean dynamics off the northern Baja California coast.
Materials and methods
Cross-Calibrated Multi-Platform (CCMP) and QuikSCAT ocean wind observations,
processed by the Physical Oceanography Distributed Active Archive Center
(PO.DAAC) and by the NOAA National Environmental Satellite, Data, and
Information Service (NESDIS), respectively, were analyzed. Wind observations
lasted from 1 September 2001 to 31 October 2002. Wind over the study area is
mainly upwelling-favorable (coherent in direction). A wind relaxation event
occurs when the regular and coherent wind loses intensity and coherence. This
event is identified by a point-to-point comparison between the time-averaged
field (14 months of 6-hourly data) and the instantaneous fields (6-hourly data).
One reasonable way of doing so is by finding the α value that establishes the
best relation, in a least-squares sense, between the time-averaged field and the
instantaneous field. Because we were dealing with vector quantities, we were
able to use a complex representation of the data. Let
where ek is the vector difference between the instantaneous field and
the estimation. Solving for αk (each time) by minimizing the
summation of the square of the magnitude of the vector difference between
instantaneous and time-averaged fields
where H stands for the Hermitian or conjugate transpose, since the elements in
the vectors are complex numbers. The numerator is a complex number and the
denominator is a real number; therefore, α is a complex number whose magnitude
stretches or squeezes, and its phase rotates the vectors in field
which is the square of the complex correlation coefficient described by Kundu (1976), who used it to estimate Ekman veering between 2 vector time series. Briefly, wind relaxation events were determined by the values of the complex correlation (r) analysis between the 14-month (from September 2001 to October 2002) average wind field and the 6-h wind fields. Relaxation events were found as follows. First, we computed the probability distribution of the complex correlation values. Second, we obtained the average with 95% confidence interval (the probability distribution was exponential). We defined relaxation events as the values of the correlation coefficients outside that interval. Low correlation values are indicators of incoherent winds, which are defined as relaxation events. Although both datasets were used (QuikSCAT and CCMP), only CCMP results are shown because of their better resolution.
The results obtained from the complex correlation technique were validated using 2 independent methods. The method to identify wind relaxation events described in Melton et al. (2009) was implemented first. This method is based on an empirical orthogonal function (EOF) analysis of the wind field. Once the mode that captures the upwelling pattern is found, the wind relaxation event is identified by the reversing in the sign of the principal component (PC) time series. An EOF analysis of the wind stress curl was used as a second validation method. The wind stress curl has a distinctive pattern in the California Current region: it is negative offshore and positive near the coast (Winant and Dorman 1997). Moreover, Ekman pumping (wind stress curl) in the region is as important as Ekman transport (wind stress) for upwelling intensification (Enriquez and Friehe 1995). Therefore, wind can be characterized by performing an EOF decomposition of the wind stress curl and by identifying the mode that is negative offshore and positive near the coast. Computation of EOFs was carried out following Emery and Thomson (1998).
ADCP and CTD observations were used to describe ocean circulation. ADCP observations provide both the balanced and the unbalanced flows (Rossby et al. 2011). The observations were taken by the IMECOCAL program, which is an ongoing observational effort that started in autumn 1997, with continuous quarterly surveys carried out in the southern portion of the California Current (off Baja California) aboard the R/V Francisco de Ulloa and the R/V Alpha Helix. The observations used for this work were taken using the former R/V, which carried a hull-mounted RDI broadband ADCP (153.6 kHz) at approximately 2.8 m beneath the sea surface and a Sea-Bird CTD instrument that was used on a regular basis. The IMECOCAL sampling grid is a reduced CalCOFI (California Cooperative Oceanic Fisheries Investigations) sampling grid off the Baja California Peninsula. A description of the CalCOFI sampling scheme can be found in Lynn and Simpson (1987). The ADCP data were processed and detided according to Vazquez et al. (2011) and the CTD data according to Gomez-Valdes and Jeronimo (2009). Objective mapping (optimum interpolation) was used to estimate the velocity fields from the ADCP data and the dynamic height anomaly from the CTD data using the approach of Jeronimo and Gomez-Valdes (2007). In this work, 4 consecutive IMECOCAL surveys, namely 4-10 October 2001, 19-28 January 2002, 21-27 April 2002, and 12-19 July 2002, were used to describe a typical year with relaxation events and the associated circulation pattern off northern Baja California.
Results
The wind relaxation events identified with the magnitude of the complex correlation coefficients (|rk|) are shown in Figure 1a. The spatial and temporal patterns for the first EOF of the wind stress curl account for 19% of the total variance (Fig. 1b, c). The separation of the coastal zone from the open-ocean zone in the spatial pattern is noteworthy. The PC time series irregularly switched from positive to negative anomalies and was highly correlated with the total kinetic energy of the wind over the region, which means that low kinetic energy corresponds to low or negative wind stress curl over the coast. In general, wind relaxation events were correlated with coastal near-zero or negative anomalies (low kinetic energy values), while coherent winds were correlated with coastal positive anomalies. These results confirm the reliability of our method. Each of the 4 surveys showed at least one relaxation event. In October 2001 a wind relaxation event occurred at the beginning of the cruise. Before the January 2002 cruise, a relaxation event took place, changing to coherent wind (correlation coefficient ~1) at the beginning of the cruise but changing back to a relaxation event a couple of days after the survey started. In the April 2002 cruise, winds were coherent until about halfway through the survey; afterwards, a short wind relaxation event took place. In the July 2002 cruise, 2 relaxation events occurred, one at the beginning and the other after the ship had moved halfway down its pathway.
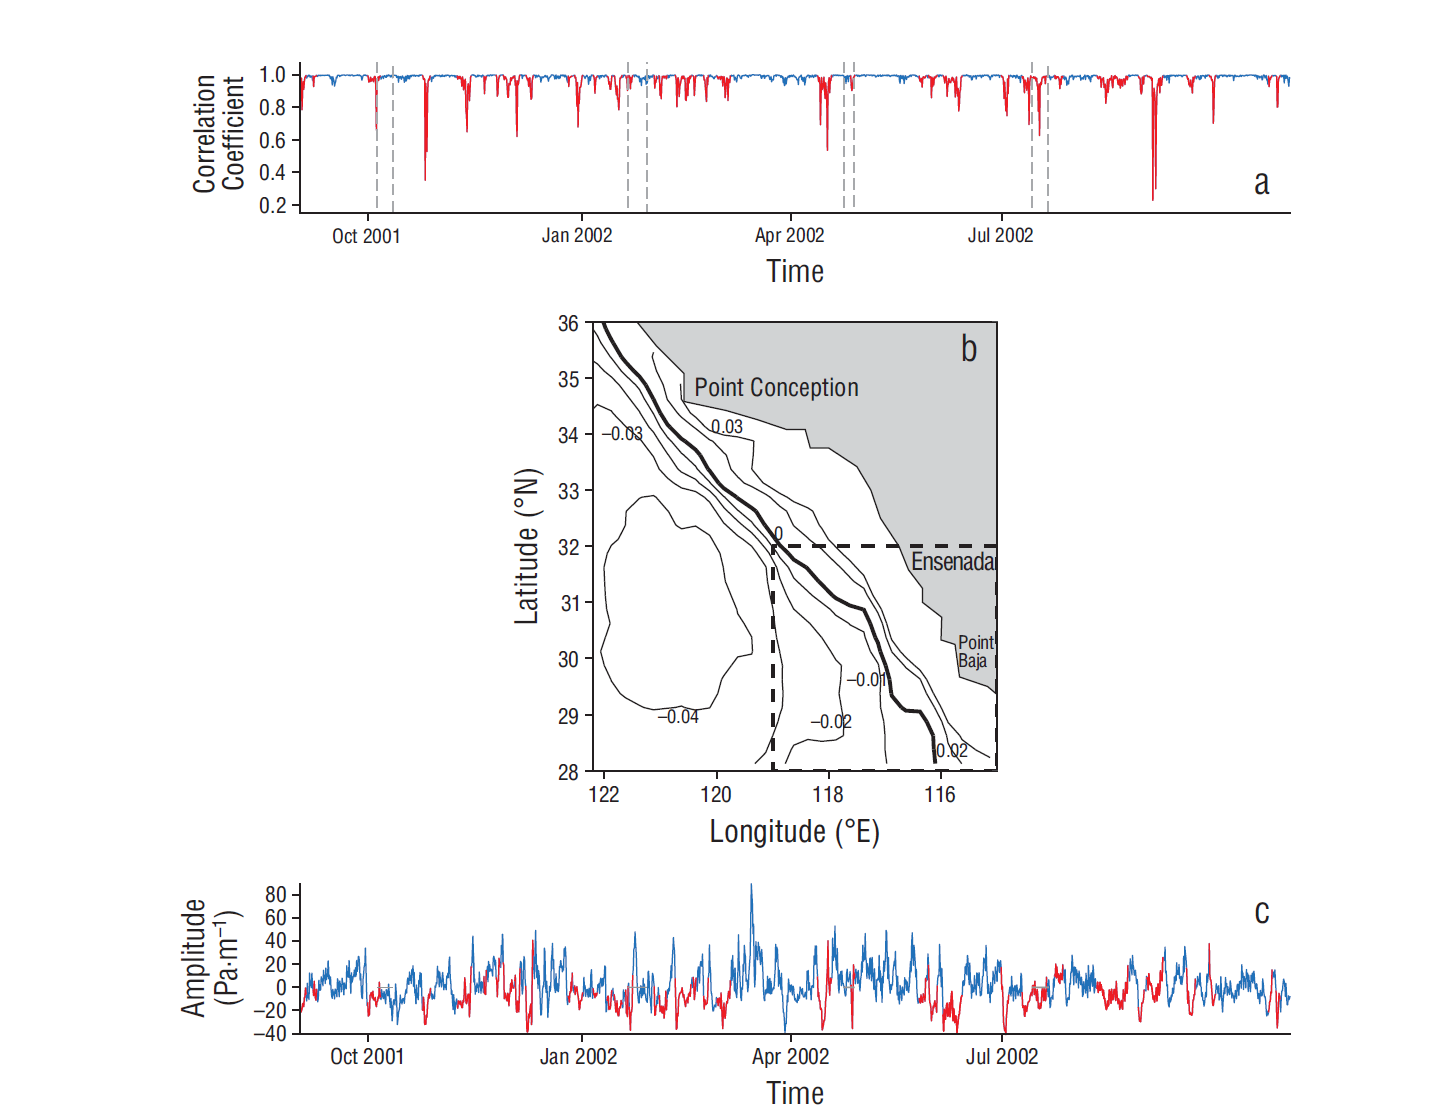
Figure 1 (a) Magnitude of the complex correlation; wind relaxation events are marked with red lines and coherent winds with blue lines. (b) Spatial pattern of the first empirical orthogonal function mode of the wind stress curl and (c) its corresponding principal component time series. The time intervals within which relaxation events occurred are marked in red in the principal component time series. Gray dashed lines in (a) indicate the time periods for the cruises. In (b) isolines indicate the spatial distribution of the first mode (thick line is zero) and the dashed square encompasses the study area.
The method described by Melton et al. (2009) was the first attempt to implement an objective method for the identification of wind relaxation events. The agreement between the results obtained with the Melton et al. (2009) method and our method is a remarkable result. The method described here, based on complex correlation, identified wind relaxation periods that corresponded to a sign reversal of the PC time series with a simple analysis (Fig. 2).

Figure 2 Principal component time series of the first mode that represents the upwelling relaxation pattern (following Melton et al. 2009). Negative values correspond to upwelling-favorable winds and positive values to relaxation events. Marked in red are the time intervals in which the complex correlation technique identified relaxation events. Gray dashed lines indicate the periods for the cruises
The horizontal circulation during the October 2001 cruise was dominated by 2 mesoscale eddies, one cyclonic and the other anticyclonic, both of approximately 160 km in diameter (Fig. 3). A coastal poleward flow between 29.5ºN and 31.5ºN, which was unrelated to the offshore cyclonic circulation at the same latitudes, was observed. The horizontal circulation during the January 2002 cruise was dominated by an anticyclonic eddy, centered at 28.7ºN and 116.5ºW, with a diameter of ~160 km. The eddy was visible in the dynamic height field derived from CTD data and in the vector field derived from ADCP data; in addition, 2 more low-pressure disturbances were present in the dynamic height field. Circulation during the April 2002 cruise was dominated by an apparent meandered equatorward flow, which could have been a product of the relaxed state of the wind that occurred between the middle and the end of the cruise (Fig. 1a). Finally, the horizontal circulation in the July 2002 cruise was dominated by a cyclonic eddy, centered at 31.25ºN and 117.5ºW, with a diameter of ~140 km and 2 high-pressure structures at the boundary of the domain.

Figure 3 Distribution of ADCP velocity at 60 m (arrows) and of dynamic height at 60/1,000 dbar (color scale) in October 2001 (a), January 2002 (b), April 2002 (c), and July 2002 (d). The solid line marks a cross section off Ensenada. The gray circles indicate the CTD casts that reached at least 1,000 m deep.
The analysis was extended to the vertical along the line marked in Figure 3. This line was chosen because wind relaxation events occurred when the ship was navigating along this line in 3 out of 4 surveys. We were therefore able to compare the effect of a relaxation event in the vertical at different times and at the same location, as well as comparing the patterns when coherent winds were present (April 2002). Figures 4 and 5 show the vertical cross section along the line for the velocity component parallel to the coast and for temperature, respectively, during each cruise. In October, a coastal poleward flow was observed penetrating down to 124 m deep, with an average speed of about 0.38 m·s-1 and weak vertical shear (i.e., barotropic-like). An anticyclonic circulation occurred offshore. In January 2002 there were weak flows with strong vertical shear (i.e., baroclinic). A coastal poleward flow was centered at 50 m deep, with an average velocity of 0.10 m·s-1, and a shallow equatorward flow was observed in the surface layer. In April, there were 2 branches of equatorward flow, and a poleward flow developed offshore. A coastal baroclinic equatorward jet (~0.40 m·s-1) was confined to the upper 100 m of the water column. The core of the open-ocean poleward flow was also confined to the upper ocean. The second branch of the equatorward flow was barotropic-like and occurred offshore, beyond 45 km from the coast, with an average speed of about 0.35 m·s-1. The velocity pattern in July was associated with a cyclonic circulation with nearshore poleward flow and offshore equatorward flow. However, the coastal baroclinic poleward flow seemed to be disconnected from the dominant cyclonic circulation further offshore. The disconnection was evident after analyzing the velocity and temperature profiles simultaneously. The poleward flow had its core at 100 m deep and a speed of about 0.30 m·s-1.

Figure 4 Vertical cross section of alongshore current velocity off Ensenada, Baja California (Mexico), during the October 2001 (a), January 2002 (b), April 2002 (c), and July 2002 (d) surveys. Positive values mean poleward flows.

Figure 5 Vertical cross section of temperature off Ensenada, Baja California (Mexico), during the October 2001 (a), January 2002 (b), April 2002 (c), and July 2002 (d) surveys.
In October a core of warm water with an average temperature of 19 ºC was observed offshore, which is in agreement with the structure of the anticyclonic eddy (Fig. 5). In January warm water was observed in the mixed layer, which was ~60 m deep. There was a low-temperature band (10.0-12.5 ºC) close to the coast in April, as a result of strong upwelling. In July 2 cores of warm water were established and separated by the center of the cyclonic circulation.
Discussion
A new method to identify wind relaxation events in two-dimensional wind fields has been introduced. The basis of this method is the complex correlation that measures the square root of the variance explained by a simple complex regression between the average wind stress field and the instantaneous (6 h) field. The method is also useful in identifying intervals of coherent winds, which are associated with upwelling-favorable winds. Our implementation allowed the identification of 45 relaxation events during the period from September 2001 to October 2002, most of which were separated by periods of coherent winds. A long period of coherent winds occurred during April 2002. Because the method is based on intensity and on how well the instantaneous field resembles the average field, it is insensitive to the choice of dataset. The relationship between the wind relaxation plot and the first PC of the wind stress curl is noteworthy; we found that wind stress curl variability is controlled by upwelling-favorable and relaxation wind events. We calculated total kinetic energy over the wind field for each 6-hourly dataset in the area of interest considering constant air density, and we found a high correlation (0.8) between the temporal series of kinetic energy and the first PC of the wind stress curl, which means that the positive phase of the wind stress curl is associated with strong winds and the negative phase is associated with less intense winds and, in some cases, wind relaxations. This is relevant because wind relaxation events in the area are related to the wind stress curl, which is thought to be important in the dynamics of the region (e.g., Enriquez and Friehe 1995; Wang 1997). Although the average wind stress field is predominantly parallel to the coast (upwelling favorable), the presence of relaxations is quite common in the study area (Vazquez 2011). The method proposed is robust and can easily pinpoint wind relaxations.
Using vessel-mounted ADCP and CTD observations, surface circulation associated with wind events in the northern Baja California upwelling region was documented for the period between October 2001 and July 2002. Two circulation patterns were clearly defined: (1) the relaxation pattern, which consists of a coastal warm poleward flow and a cyclonic eddy clearly observed during the October 2001 and July 2002 cruises, with wind relaxation occurring at the beginning of both cruises; and (2) the upwelling pattern, which consists of an equatorward coastal jet and an offshore poleward flow confined to the surface during the April 2002 cruise. Similar patterns have been observed along the coast of California and Oregon. Harms and Winant (1998) found that cyclonic circulation and poleward flow occur concurrently in the Santa Barbara Channel. On the other hand, the observations in our study area for January are quite particular. A large positive wind stress curl occurred at the beginning of the survey, which was associated with the presence of a cold front. The strong equatorward winds thus induced an equatorward flow. However, a wind relaxation event occurred before the start of the survey. From satellite altimetry (not shown) we found that a poleward flow was taking place along the coast on those days, but the IMECOCAL data kept only a fainted poleward flow. Our hypothesis is that the cold front (strong winds) inhibited the relaxation pattern, hence the poleward flow.
Wang (1997) suggested that coastal poleward flows are driven by an alongshore pressure gradient that is generated by a cyclonic eddy. Our observations are in agreement with this author’s hypothesis; his numerical experiment on relaxation shows a good comparison with the relaxation pattern. On the other hand, Oey (1999) hypothesized that the forcing mechanism generating coastal poleward flows is the equatorward weakening of the wind stress curl. Our alongshore scale (~400 km), however, is too small to test this hypothesis. Pringle and Dever (2009) suggested that changes in the intensity of coastal upwelling along the coast drive poleward flows.
The results we obtained are promising and help better understand the coastal dynamics off the northern Baja California coast, highlighting the necessity for analyzing the dynamics of not only upwelling events but also wind relaxation events. Our contribution demonstrated the value of the IMECOCAL database, capturing the dynamics associated with different wind scenarios. A future work will characterize wind events off southern Baja California and study the response of the ocean.

