


 nueva página del texto (beta)
 Inglés (pdf)
 Artículo en XML
 Referencias del artículo
 Enviar artículo por email
 Citado por SciELO
  Similares en
SciELO
Similares en
SciELO 
 Permalink
Introduction
Transparent exopolymer particles (TEP) constitute a key component of nonliving particulate organic matter in seawater (Kaltenböck and Herndl 1992). Transparent exopolymer particles, also defined as a self-assemblage microgels (>0.4 µm) that are stainable with alcian blue, are produced mainly from phytoplankton and bacterioplankton exudates (Bar-Zeev et al. 2012). These particles have highly viscous and sticky properties that allow them to bind to each other and coagulate in a wide range of sizes, becoming part of the size continuum from dissolved to large organic aggregates (Alldredge et al. 1993, Ding et al. 2009, Verdugo 2012). Transparent exopolymer particles have been implicated in the sequestering of trace metals, considered as hot spots of intense microbial activity, and held responsible for the formation of the matrix that embeds sinking particles (Passow 2002). In this way, the contribution of TEP to the cycles of carbon and other elements acquires great relevance due to their interaction with ocean physics and microbial physiology, which may define the amount of compounds that are exported to the ocean floor or are remineralized in the water column.
The biological and environmental factors that control the assembly of TEP in the marine environment are not well known. Marine dissolved organic precursors may coagulate under conditions of strong turbulence and pronounced gradients of salinity (Stoderegger and Herndl 1999, Engel 2000, Surge and Lohmann 2002). Other factors that have been shown to influence the formation or disintegration of TEP are pH, cation availability (such as Ca2+ and Mg2+), and temperature (Chin et al. 1998, Chen et al. 2015, Baltar et al. 2016). Although little is known about the mechanical architecture and chemical composition of TEP, these particles are abundant in carbon-rich acidic polysaccharides that contain some reactive groups (carboxyl and half-ester sulphate) (Passow 2002). These organic molecules may form visible complexes and also be easily quantified by spectrophotometry through staining with alcian blue after filtration of water samples through 0.45 μm pore size filters (Passow and Alldredge 1995). The use of these filters has allowed the creation of a worldwide data stock in the last decades. The smaller pores are known to increase the collection of TEP but this has not been investigated in detail (Villacorte et al. 2015).
There are no previous reports about TEP concentrations or their possible contribution to the carbon budget in Pacific waters off western Mexico. Here we report TEP concentrations under different oceanographic conditions in some locations off the northern coast of Baja California (Mexico). This area has a marked environmental gradient perpendicular to the coast, which is seasonally influenced by upwelling processes associated with the California Current System. We expected to find a triggered increase of exudates derived from primary producers during the upwelling season (e.g., phytoplankton and macroalgae) and that these exudates then coagulate as TEP (Engel 2000, Chen and Thornton 2015). Moreover, we expected TEP to provide organic nutrition and/or hotspots for microbial activity and, consequently, control a significant fraction of the vertical fluxes of organic material (Azetsu-Scott and Niven 2005, Bar-Zeev and Rahav 2015, Bochdansky et al. 2016). We also evaluated the differences of TEP concentrations obtained with 3 different filter pore sizes to put the results obtained with the traditional 0.45 μm pore size in perspective.
Materials and methods
Sampling was carried out on board the R/V Alpha Helix on the eastern North Pacific, off Baja California, during 3 cruises in 2016: MICMAR-II (AH1602-016), from 11 to 12 February; OMCENS/MICMAR-III (AH1604-019), from 26 to 28 April; and OB2016, from 30 June to 1 July (Jun-Jul) (Table 1). Water samples were collected from 5 depths that were arbitrarily defined according to the maximum depth of the water column, except during the last cruise, when water samples were taken at 8 depths at IMECOCAL station 100.30 and the ANTARES station, and 2 depths at the nearshore Todos Santos Bay station. All water samples were collected using a rosette sampler equipped with 12 standard 8-L Niskin bottles. For hydrographic profiling, the rosette included a Sea-Bird 9 CTD, an SBE 43 oxygen sensor, and a Seapoint fluorometer. The mixed layer depth was estimated from temperature profiles as the distance of the quasi-isothermal layer (Kara 2000), and by considering the time-dependent optimal values of the potential temperature differential (∆θ) that were proposed seasonally for this region by Jeronimo and Gomez‐Valdes (2010). Chlorophyll a (Chla) profiles were obtained indirectly from the fluorescence measurements that were calibrated through spectrophotometric determinations on extracts of discrete samples from the water column.
Table 1 Location, environmental features, and collection dates in 2016 for each sampling site.
| Location | Coordinates | Environment | Max. depth | Number of sampling depths | Collection date |
| ENSENADA | 31º40′N | Coastal | ~100 | 5 | 11 February |
| 116º41′W | 27 April | ||||
| 1 July | |||||
| MICMAR | 31º35′N | Coastal | ~1,250 | 5 | 12 February |
| 116º52′W | 28 April | ||||
| ANTARES | 31º45′N | Oceanic | ~1,100 | 5 and 8 | 12 February |
| 116º57′W | 28 April | ||||
| 1 July | |||||
| IMECOCAL 100.30 | 31º41′N | Coastal | ~415 | 8 | 30 June |
| 116º46′W | |||||
| Todos Santos Bay | 31º46′N | Nearshore | ~60 | 2 | 30 June |
| 116º39′W |
The concentration of TEP was evaluated colorimetrically following the method of Passow and Alldredge (1995). Several aliquots of 20-100 mL of unfixed seawater were filtered under constant and gentle vacuum (~10-15 kPa) through 0.45 μm pore size polycarbonate membranes. Additionally, water filtration was performed through 0.22 and 1.00 μm pore sizes at all sampling locations in April, and through the 0.22 μm pore size only at the ANTARES station during June-July. The particulate matter retained on the filters was then stained with pre-filtered (0.22 μm) 0.02% alcian blue (Sigma-Aldrich, C.I.74240) in 0.06% glacial acetic acid (pH = 2.5); before and after staining, the filters were rinsed with pre-filtered (0.22 µm) Milli-Q water. Membranes stained with alcian blue were placed in capped vials and eluted in 2 mL of 80% sulfuric acid for 2-3 h. Vials were centrifuged at 1,500 rpm for 5 min and then the absorbance of the acid supernatant was measured at 787 nm with a UV-visible spectrometer (Lambda 40, Perkin-Elmer) using a 1 cm path-length cell. The TEP concentrations were estimated based on a calibration derived from absorbance values of xanthan gum standards (μg XG eq·mL-1) after processing in the same manner as above and according to the equation proposed by Villacorte et al. (2015). A rough equivalence of TEP (μg XG eq·mL-1) to carbon content (μg C·mL-1) was calculated using the average factor of 0.63 proposed by Engel (2004). Depth-integrated values of carbon associated to TEP were calculated from the vertical profiles of TEP retained by the 0.45 µm pore size membrane.
Quantification by epifluorescence microscopy of hetero-trophic prokaryote cells (Bacteria and Archaea), hereinafter referred to as bacterioplankton, was performed using samples taken from the first 2 cruises and preserved with buffered formalin (final concentration 1%) after staining with 4′,6-diamidino-2-phenylindole (Kepner and Pratt 1994). Coupled with bacterioplankton abundances, aerobic community respiration was assessed in unfiltered samples from the ANTARES station. For this purpose, duplicate water samples were dispensed into 160 mL borosilicate BOD bottles and then incubated for 10-12 d. During incubation, oxygen consumption was measured in each bottle at different time intervals using planar oxygen sensitive spots (SP-PSt3-NAU-YOP) and the Fibox 4 system (PreSens, Regensburg, Germany) (Berggren et al. 2012, Villegas-Mendoza et al. 2015). In April 2016 a set of unfiltered seawater samples from the 3 locations was preserved with phosphoric acid (0.25% V/V final concentration) and frozen for total organic carbon (TOC) analysis by the high temperature combustion method through a TOC analyzer (vario TOC cube, Elementar Americas) at the Laboratory of CeMIEGeo at CICESE. Ampoulated low-carbon water and deep seawater (provided by Hansell laboratory, RSMAS/MAC University of Miami) were used as certified reference materials, which were injected before sample injection while alternating a standard between groups of samples. The relative standard deviations (CV) of 3 replicate TOC analyses were <9% (average: 4.2%). Statistical analyses were performed with Statistica v10 computer software (StatSoft, Tulsa, OK; http://www.statsoft.com).
Results
Hydrography and distribution of chlorophyll a
Overall, all sampled locations presented similar hydro-graphic properties. As expected, sea surface temperature gradually increased by ~2.7-3.5 ºC from February to July, and the mixed layer depth decreased especially at the more oceanic stations (Fig. 1). An exception to this pattern was observed mainly in April, in the upper layer of the ENSENADA station, where the mixed layer depth was shallower (5.2 m), temperatures were lower (average: 14.8 ºC), and seawater was denser (average: 24.8) than at the stations distant from the coast (Fig. 1a-c). This feature was attributed to a larger influence of upwelling processes over this period.
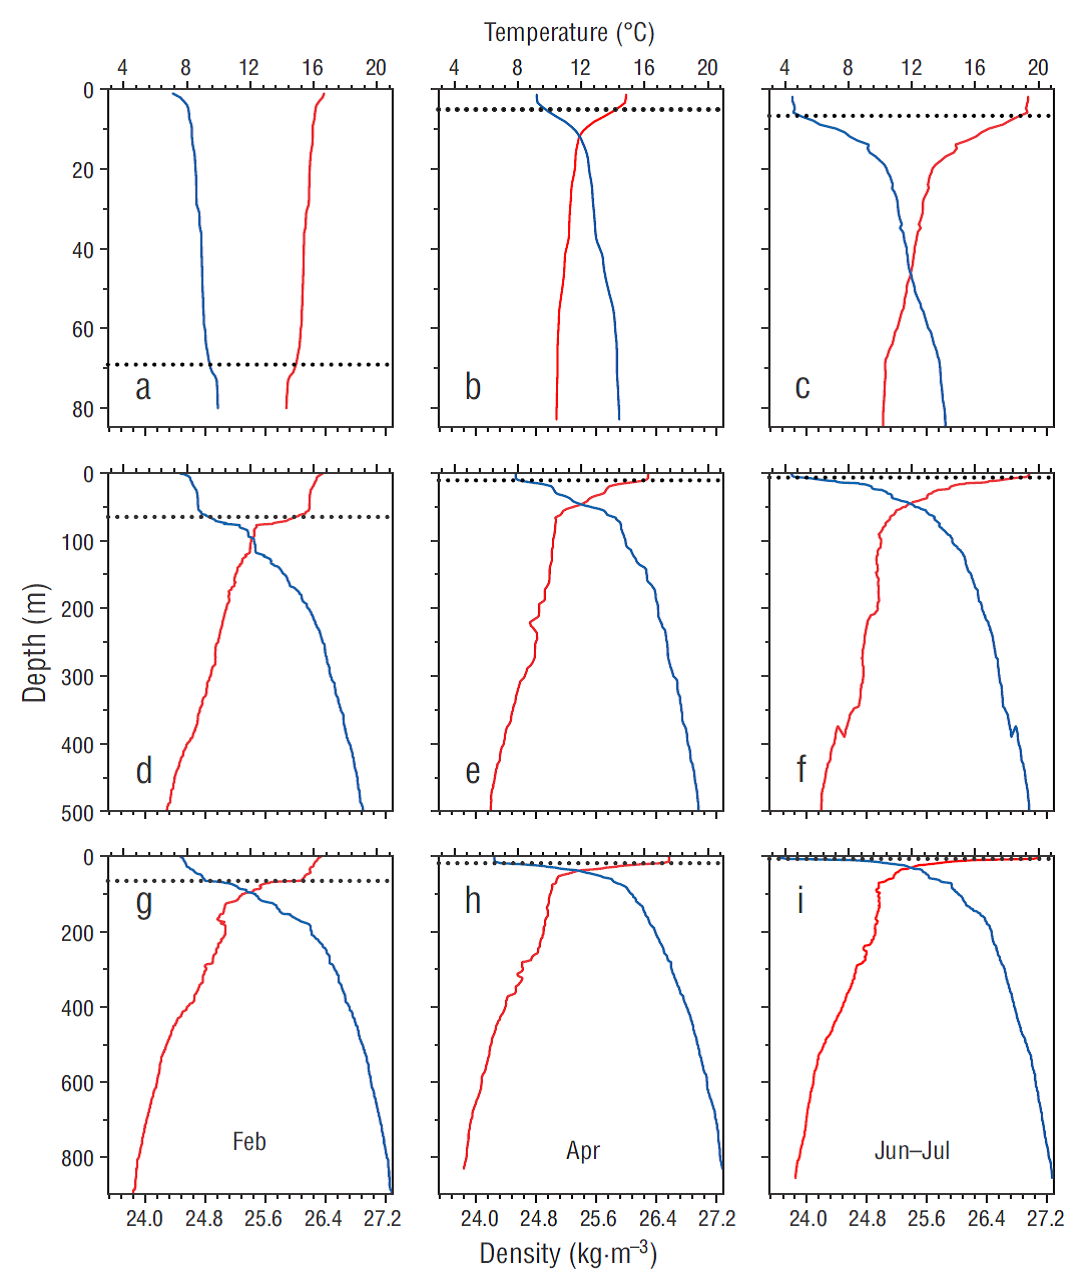
Figure 1 Vertical profiles of temperature (red line) and density (blue line) at the stations ENSENADA (a -c), MICMAR (d-e), IMECOCAL 100.30 (f), and ANTARES (g-i) during the cruises conducted in February, April, and June-July 2016. Dashed line corresponds to mixed layer depth.
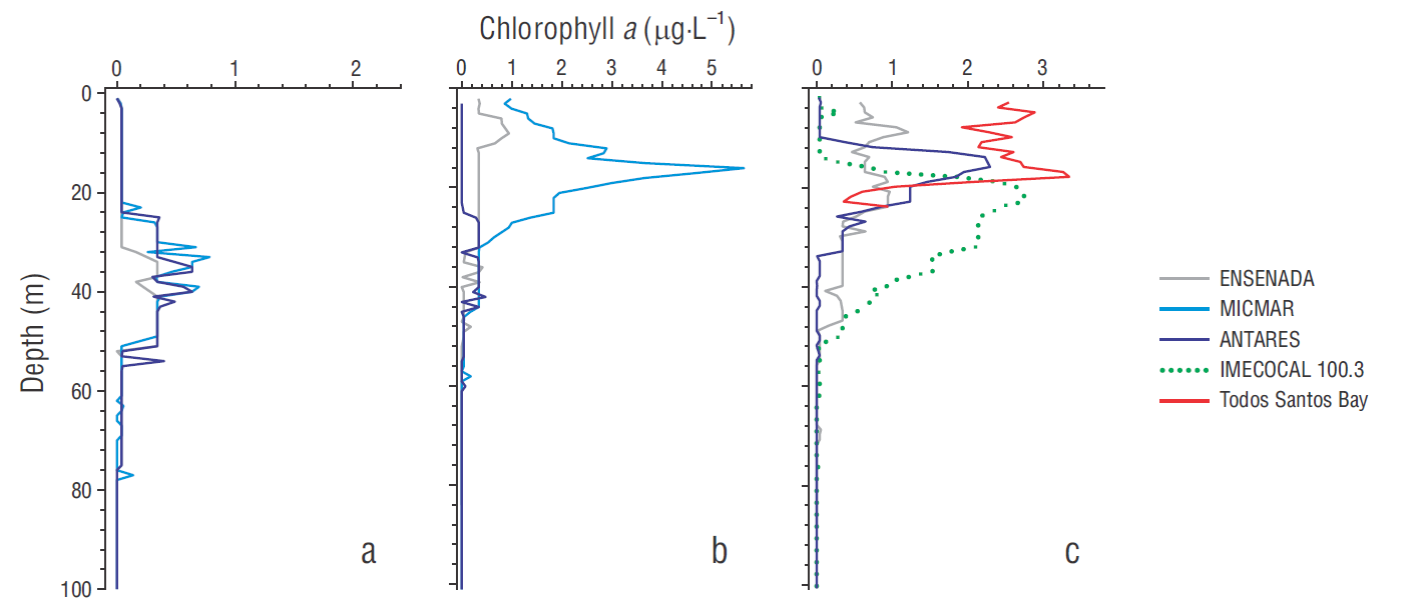
The Chla profiles derived from fluorescence measurements generally showed lowest values in February (from undetectable to 0.78 μg·L-1) and a temporal increase in the magnitude and shallowing of the deep Chla maximum (DCM) from this month onward (Fig. 2). The deepest DCMs were detected at around 15 m (5.64 μg·L-1) in April at the MICMAR station and 21 m (2.74 μg·L-1) in June-July at IMECOCAL station 100.30, whereas at the ANTARES station, DCM was located at 41 m (0.47 μg·L-1) and at 15 m (2.29 μg·L-1) in April and June-July, respectively (Fig. 2b, c). The ENSENADA station was characterized by a shallower DCM, with relatively low Chla values at around 8 m depth in April (0.94 μg·L-1) and June-July (1.21 μg·L-1). Chla remained relatively high throughout the first 18 m depth at Todos Santos Bay (Fig. 2c).
Comparison between TEP retained by different pore sizes
The comparison between the amounts of TEP retained by the different pore sizes of membranes in April and June-July showed large differences that were confirmed by a nonparametric signed-rank test for the combinations of 2 related sets of data (Wilcoxon, Z = 2.84, n = 15 and Z = 4.20, n = 23 for 0.45 μm vs 1.0 μm and 0.45 μm vs 0.22 μm, respectively; P < 0.05). The concentration of alcian blue stainable particles collected by the 0.2 μm pore size was 1.7 to 64.0 fold (average: 11.4 fold; median: 4.1) and 3.0 to 37.0 fold (average: 15.7 fold; median: 8.8) higher than those retained (when they were detectable) by the 0.4 and 1.0 μm pore sizes, respectively (Fig. 3a-c). Only a weak but significant correlation of TEP concentrations retained by filters of 0.22 and 1.0 μm of pore sizes was detected (R 2 = 0.31, n = 15, P < 0.05).
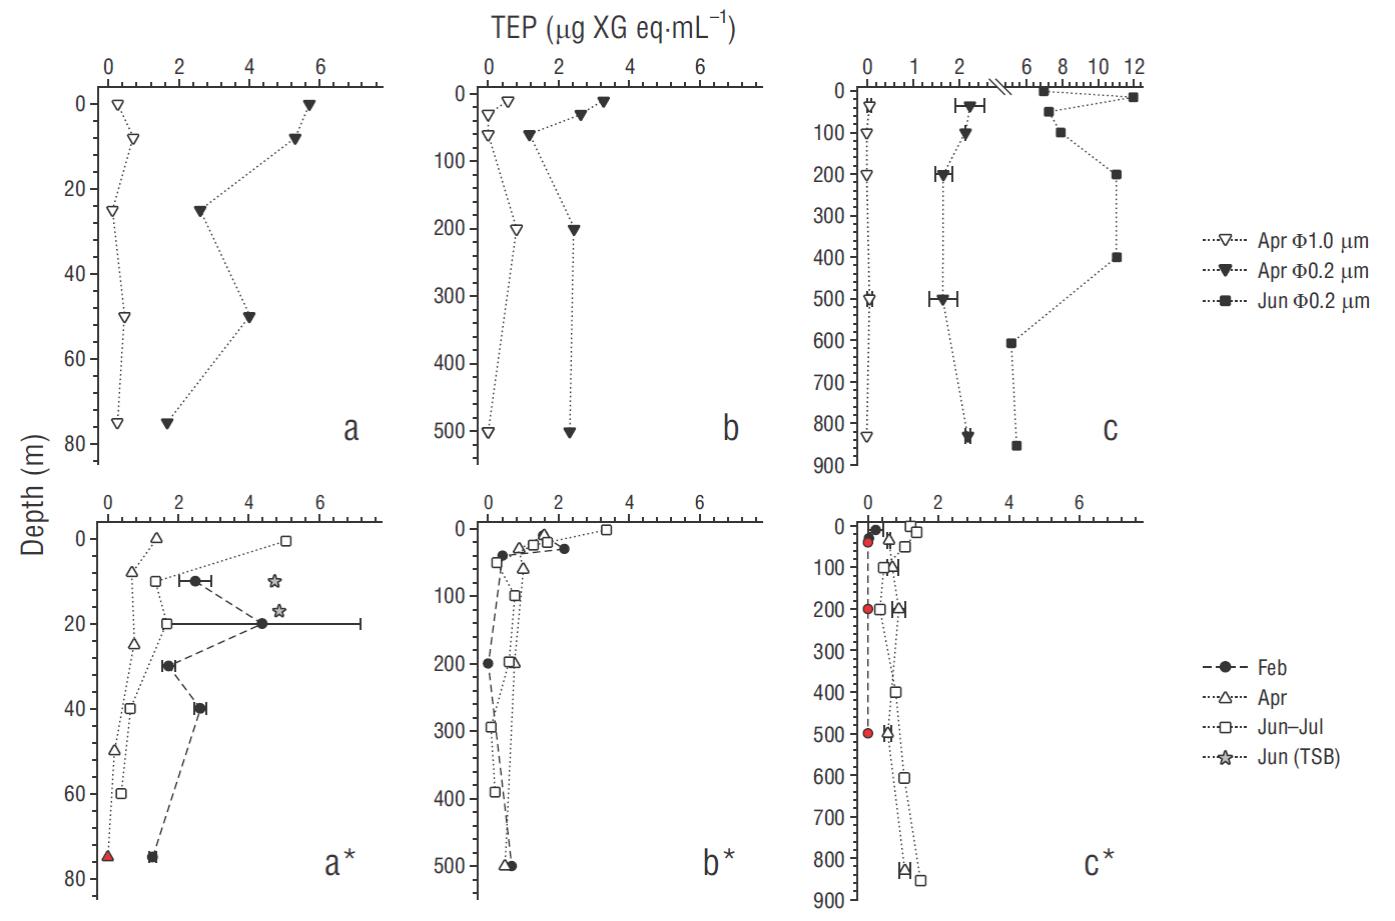
Figure 3 Vertical profiles of transparent exopolymer particles (TEP) at the stations ENSENADA and Todos de Santos Bay (TSB; a, a*), MICMAR and IMECOCAL 100.30 (b, b*), and ANTARES (c, c*). Profiles in the upper panel correspond to TEP retained by nominal pore sizes of 0.2 and 1.0 μm in samples from April and June-July 2016. Profiles with asterisk in the lower panel correspond to TEP retained by the operational pore size (0.45 μm) during the 3 cruises. Error bars indicate standard error. Red color on symbols means undetectable value.
TEP dynamics
TEP estimated from the material retained by the operational 0.45 μm pore diameter ranged from undetectable to7.18 μg XG eq·mL−1 (average: 1.13 μg XG eq·mL−1; median: 0.70 μg XG eq·mL−1), with the lowest concentrations in February at the offshore and deeper stations (ANTARES and MICMAR) and the highest in June-July at mostly all sampled sites, especially at the shallower and nearshore stations (the Todos Santos Bay station and the ENSENADA station, lower panel in Fig. 3) . High TEP concentrations were also detected in February in the water column of the ENSENADA station (Fig. 3 a*). The vertical TEP distribution showed a slight tendency to decrease with depth at most stations, although higher variability within data from the ENSENADA and MICMAR stations was predominantly observed in February (CV range: 47-194%).
At the ANTARES station, depth-integrated TEP concentrations (expressed as grams of carbon per square meter) varied temporally by ~88% (from ~1 to 464 g C·m-2, highest value recorded in June-July), whereas this variation was ~21% and 80% at the MICMAR station (~134 to 181 g C·m-2) and the ENSENADA station (~17 to 107 g C·m-2), respectively. Depth-integrated TEP concentrations followed an increasing trend toward summer except at the ENSENADA station, which showed relatively similar values in February and June-July (Fig. 4a). A rough estimate of depth-integrated TEP in the upper layer (considering the available samples from <100 m depth) revealed a moderately low contribution to the sampled water column at the ANTARES station in April (~7%) and July (14%) and at the MICMAR station in February (~27%) and April (13%) . This contribution was considerably larger in February at the ANTARES station (~100%) and in June-July at IMECOCAL 100.30 (43%). In terms of carbon content, the ENSENADA station predominately showed the highest integrated concentrations (average: 39 ± 15 g C·m-2) in the upper layer, except in June- July, when carbon contents at ANTARES (63 g C·m-2) and IMECOCAL 100.30 (55 g C·m-2) were maxima.
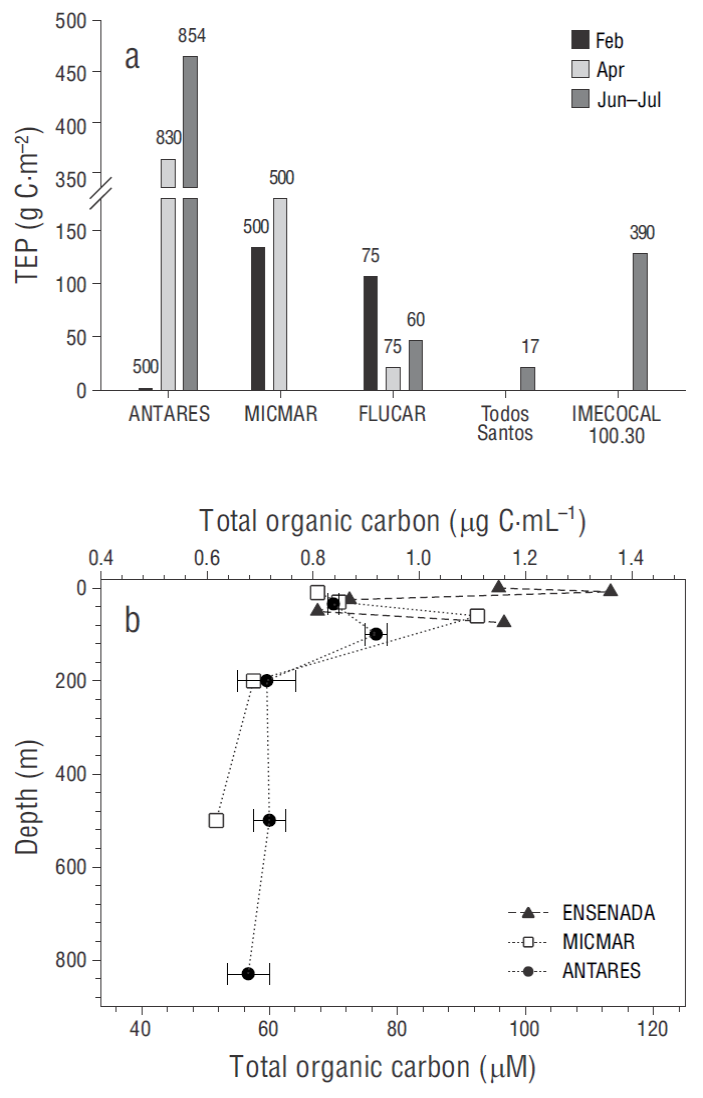
Figure 4 Temporal dynamics of depth-integrated carbon concentration in relation to transparent exopolymer particles (TEP) retained by 0.45 μm pore size (a) and vertical profiles of total organic carbon in April 2016 ( b). Vertical number over the bar represents the depth of integration. Error bars indicate standard error.
As observed for the TEP distribution, TOC showed well- defined differences between locations, revealing higher TOC concentrations at the ENSENADA and MICMAR stations than at the ANTARES station (Fig. 4b). TOC concentrations in April (range: 0.63 to 1.33 μg C·mL-1, average: 0.87 μg C·mL-1) were ~1.3 to 6.8 fold higher (Wilcoxon; Z = 3.61, n = 15, P > 0.05) than the TEP carbon content concentrations (range: undetectable to 0.87 μg C·mL-1; average: 0.43 μg C·mL-1 ) indirectly obtained from the same samples filtered through the 0.45 μm pore size.
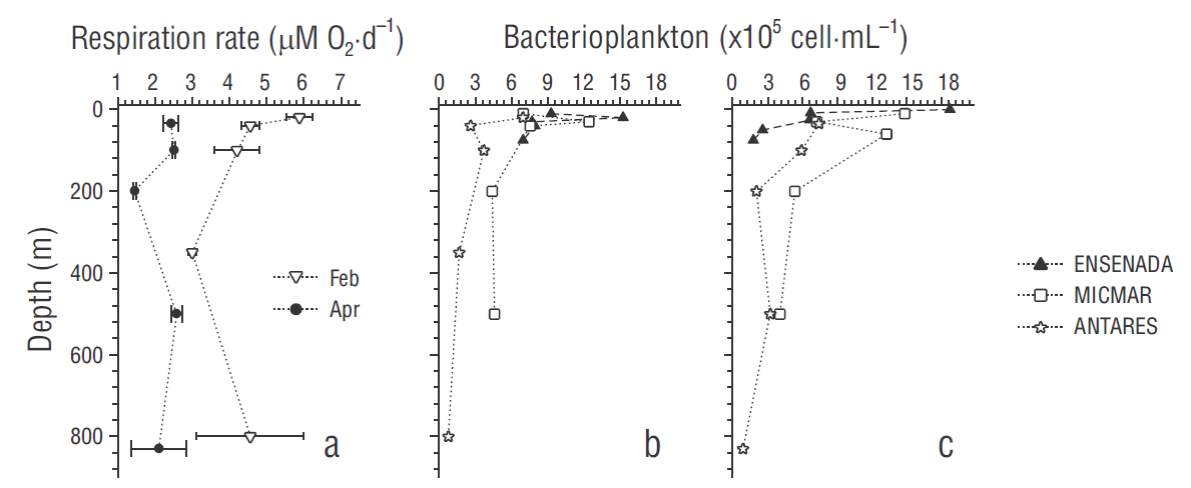
Rates of community aerobic respiration and bacterioplankton abundance
The community respiration rates ranged from 1.45 to 5.88 μM O2·d-1 (average: 3.33 ± 1.39 μM O2·d-1) with greater values in February (average: 3.75 ± 1.03 μM O2·d-1 ) than in April (average: 2.21 ± 0.46 μM O2 ·d-1). There was no clear vertical pattern, although relatively high rates were observed in the upper 100 m depth (Fig. 5a). Bacterioplankton abundance ranged from 7.84 × 10⁴ to 1.87 × 10⁶ cells·mL-1 (average: 7.84 × 10⁵ cells·mL-1). This biological variable showed high values at the surface and eventually the subsurface close to the DCM, with a pronounced tendency to decline with depth. Abundances from April were generally higher than those from February, except for some subsurface values at the ENSENADA station. In the uppermost layers, the ENSENADA station showed the highest abundance followed by MICMAR. However, in April, abundances below 8 m depth were relatively higher at the offshore stations (Fig. 5b, c).
Discussion
Comparison between TEP retained by different pore sizes
Filtration is a crucial and critical step during analyses of particulate and dissolved material in most studies of seawater. Although this study focused on the first description of TEP concentrations in the North Pacific off Baja California, we made some comparisons between the concentrations obtained with the operational pore size (0.45 µm) established by the original method (Alldredge et al. 1993) and those obtained with 2 other pore sizes in order to expose the potential bias that may occur when the nature of this organic compounds allows for self-assembling or disaggregation in the lower range of particulate material (>0.4 µm) or colloidal TEP (0.05 to 0.45 µm). In some experiments with batch cultures of Alexandrium tamarense, Chaetoceros affinis, and Microcystis sp., Villacorte et al. (2015) demonstrated that continuous production measurements of TEP were generally between ~11% and ~23% of the whole fraction of TEP plus TEP precursors (10 kDa-0.4 µm). In general, the results obtained from our study revealed that the average concentration of alcian blue stainable particles collected by the 0.2 µm pore size was ~79% and ~93% higher than that collected by the 0.4 and 1.0 pore sizes, respectively. These percentages are relatively higher compared with some average values (~42-50%) reported for coastal and estuarine systems (Passow and Alldredge 1995, Sun et al. 2012) . The relative importance of this small fraction is consistent with several studies implementing different microscopy techniques coupled with image analysis and energy-dispersive X-ray spectroscopy, which estimated large concentrations of small colloids (0.005 to 0.2 μm) in seawater ranging from ~107 to 109 particles per milliliter (Koike et al. 1990, Wells and Goldberg 1991). Using oceanic samples (surface, 1,600 and 2,600 m depth) collected by cross-flow ultrafiltration in the Gulf of Mexico and Middle Atlantic Bight, Santschi et al. (1998) demonstrated high prevalence of macromolecules and colloids rich in polysaccharides ranging from 0.001 to 0.200 μm in legth, as well as showing an important size fraction of fibrillar polysaccharides measuring 1.0-3.0 nm in diameter and 0.1-2.0 μm long. Analyses of size classes of TEP in samples from estuarine and coastal waters off Netherlands and Belgium revealed that ~36-90% of TEP concentrations (ranging from ~0.5 to 1.6 μg XG eq·mL-1) corresponded to the colloidal fraction (Villacorte et al. 2009).
The lack of a significant relationship between alcian blue stainable particles in size fractions >0.22 μm and >0.45 μm indicates substantial differences between the dynamic interaction of large particles and colloidal particles, since they have a relatively short lifespan and are subject to high rates of assembly/dispersion turnover in the water column (Verdugo 2012). Some experimental approaches suggest that the mass of TEP precursors (>0.2 μm) is much higher under stagnant than under turbulent conditions (Stoderegger and Herndl 1999). Thus, the use of a membrane with a smaller pore size (e.g., 0.2 μm) could increase sensitivity to collect a fraction of stainable colloids at greater depths and even in places under nutrient-depleted conditions. However, we do not discard the possibility that the shape and the amount of TEP precursors in the seawater sample could influence filtration efficiency through the clogging of membrane pores and thus the breakdown or assembly thereof. In addition, cell lysis may also contribute to the formation of new stainable substances on the filters as a result of the increased pressure during filtration (Discart et al. 2015).
TEP and environmental and biological variables
The California Current System off Baja California is considered to be highly dynamic in terms of seasonal and spatial fluctuations of primary production (Hernández de La Torre et al. 2004, Kahru et al. 2009, Gaxiola-Castro et al. 2010, Martínez-Gaxiola et al. 2010). Part of this variability originates from environmental gradients between the coast and the open ocean and also along mesoscale processes (Santamaria-del-Angel et al. 2002, Barocio-León et al. 2007). At the beginning of this research, we aimed to describe the TEP concentration to elucidate how it is influenced temporally and spatially by environmental properties and primary production off northern Baja California. In this area, the incidence of intense upwelling from April to June promotes an increase in the concentration of inorganic nutrients in surface and subsurface layers (Pérez-Brunius et al. 2007, Durazo 2015) that stimulates the growth and accumulation of macroalgal and phytoplankton biomass (Martínez-Gaxiola et al. 2010, Cruz-Trejo et al. 2015). During the study period upwelling was strongest in April, as indicated by a shallowing of the mixed layer depth and the thermocline, and the cooling of the surface layer at the stations nearest to the coast. Biological evidence of upwelling processes was also noted through the Chla dynamics and shallowing of the DCM at the stations closest to shore (Millán-Nuñez et al. 1997). This behavior coincides well with some satellite observations of sea surface temperature and ocean color, and with upwelling indices (e.g., Espinosa-Carreón et al. 2004, Gómez-Ocampo et al. 2017).
Our data showed relatively high concentrations of TEP >0.45 μm (>0.3 μg XG eq·mL-1), even at greater depths, compared to other published concentrations for the open ocean and coastal and estuarine environments (Wetz et al. 2009, Malpezzi et al. 2013, Annane et al. 2015, Benavides et al. 2015). Most field studies have shown increased concentrations of TEP during phytoplankton blooms or immediately after phytoplankton bloom maturity (Passow 2002, Thornton 2002, Wetz et al. 2009). The temporal dynamics of TEP in the study area followed the seasonal trend of primary productivity, which consists in a significant increase toward spring that continues on with relatively high concentrations until early summer (Gaxiola-Castro et al. 2010). In February, the low phytoplankton biomass did not produce a substantial amount of TEP or TEP possibly degraded rapidly. In general, TEP decreased from the coast to the more offshore stations following the pattern reported by comparative studies for similar locations (influenced by upwelling) and other environmental gradients such as salinity (e.g., estuaries) and/or pollution (e.g., infringed by sewage, factories, or agricultural activities) (Chateauvert et al. 2012, Bar-Zeev and Rahav 2015). High concentrations of TEP close to the coast could also be strongly influenced by contributions from benthic invertebrates and macroalgae (Thornton 2004, McKee et al. 2005). This coastal increase in TEP is consistent with the distribution and the gross chemical composition of some macroalgae species from the Baja California Peninsula, which have been reported to contain more than 40% of carbohydrates (dry weight) in biomass (Serviere-Zaragoza et al. 2002, Hernández-Carmona et al. 2009). Thus, reserve and structural polysaccharides could be released to the environment as potential precursors of TEP after exudation or tissue rupture.
Relatively large TEP concentrations in deeper waters could be partly due to the seasonal increase in primary production levels, and these large concentrations are perhaps amplified by the attachment of ballast minerals that strengthen the vertical flux of particles (Ploug and Passow 2007, Iversen and Ploug 2010) and/or by spontaneous coagulation and break-down of particulate organic matter in deeper layers (Engel et al. 2004, Wurl et al. 2011). A rough comparison between the depth-integrated carbon content of phytoplankton biomass estimated from Chla (assuming the μg C to μg Chla ratio = 50; Li et al. 2010), and the TEP carbon concentration for the first 100 m depth at all sampling stations, except the ENSENADA (up to 75 m depth) and MICMAR (up to 40 and 60 m depth in February and April, respectively) stations, suggests that the nonliving organic fraction on average contributes a ~65 fold (range: 2 to 264) larger amount to particulate carbon than phytoplankton cells do. Note that our estimations depend on the TEP-to-carbon conversion factors, which have a wide range of variation (from 0.51 to 0.88 μg C·μg XG eq-1·mL-1; Engel and Passow 2001). We currently lack a conversion factor for changing the concentration of alcian blue stained particles to particulate organic carbon for our region. Our results suggest that TEP could be responsible for up to ~50% of the particulate organic carbon fluxes to the mesopelagic zone, as it has been described for other regions (Martin et al. 2011). In this study, TEP also exhibited relatively high concentrations (>0.3 μg XG eq·mL−1) between ~300 and 900 m depth in June and April. The cause for these high concentrations is not entirely clear, but it has been suggested that new organic precursors derived from physically and biologically mediated disintegration (e.g., sloppy feeding, viral lysis, swimming behavior of macrozooplankton) of settling fecal pellets and marine snow could later self-assemble as TEP in deep layers (Baldi et al. 1997; Prieto et al. 2001; Goldthwait et al. 2004, 2005). Some experimental assays in batch cultures indicate that there may be considerable differences in the origin and composition of TEP between upper and deeper layers. This is based on the fact that TEP in the oceanic euphotic zone proceed predominantly from exudates of photoautotrophic organisms, whereas in the deep layers they are heterotrophically produced through transformations by prokaryotes that increase their stickiness and recalcitrant properties (Barrera-Alba et al. 2008, Rochelle-Newall et al. 2010).
Regarding the ecological role of TEP, a weak but significant positive correlation between bacterioplankton abundances and TEP concentrations (Pearson’s R 2= 0.38, P < 0.05; Fig. 6a) suggests a functional relationship, for example, in the releasing, aggregation, and recycling of organic matter, especially during events of high primary production (Ortega-Retuerta et al. 2010). Moreover, we estimated a statistically significant positive relationship between bacterioplankton abundance and TOC, as well as estimating a negative correlation between TEP and microbial respiration rates for the ANTARES station (Pearson’s R 2 = 0.61 and 0.59, respectively, P < 0.05; Fig. 6b, c). In the surface layer, these observed respiration rates corresponded to intermediate values compared to some estimates from oceanic areas (average: 2.4 µM O2·d-1; range: <0.7-12.7; n = 51) and upwelling zones (average: 6.5 µM O2·d-1; range: undetectable to 33.4; n = 132; Robinson et al. 2002). However, below 100 m depth respiration rates were much greater than those detected in samples from the oxygen minimum zone (at 110 m depth, below the oxycline) in the tropical Pacific off western Mexico that were incubated under different dissolved oxygen levels (Tiano et al. 2014). Similarly, in this stratum and even deeper, TOC data fell in the range of large concentrations according to some data-base from the eastern North Pacific (Wheeler 2013) . These relationships are consistent with the argument that micro-gels may be too large and their components very inaccessible or refractory to be consumed by prokaryotes (Verdugo 2012, Orellana and Leck 2015). In this study, the range of bacterial abundance was similar to the ranges reported for the surface layer in the southern California Current ecosystem (Linacre-Rojas et al. 2012, Samo et al. 2012); therefore, our evidence suggests that the conformation of organic matter during the study period seemed to serve as a physical substrate for settlement of microbial assemblages. This association could provide refuge against from nanoflagellate grazing and viral lysis rather than a supply of semi-labile carbon along the water column (Mari and Rassoulzadegan 2004, Mari et al. 2007, Weinbauer et al. 2009, Bar-Zeev et al. 2012).
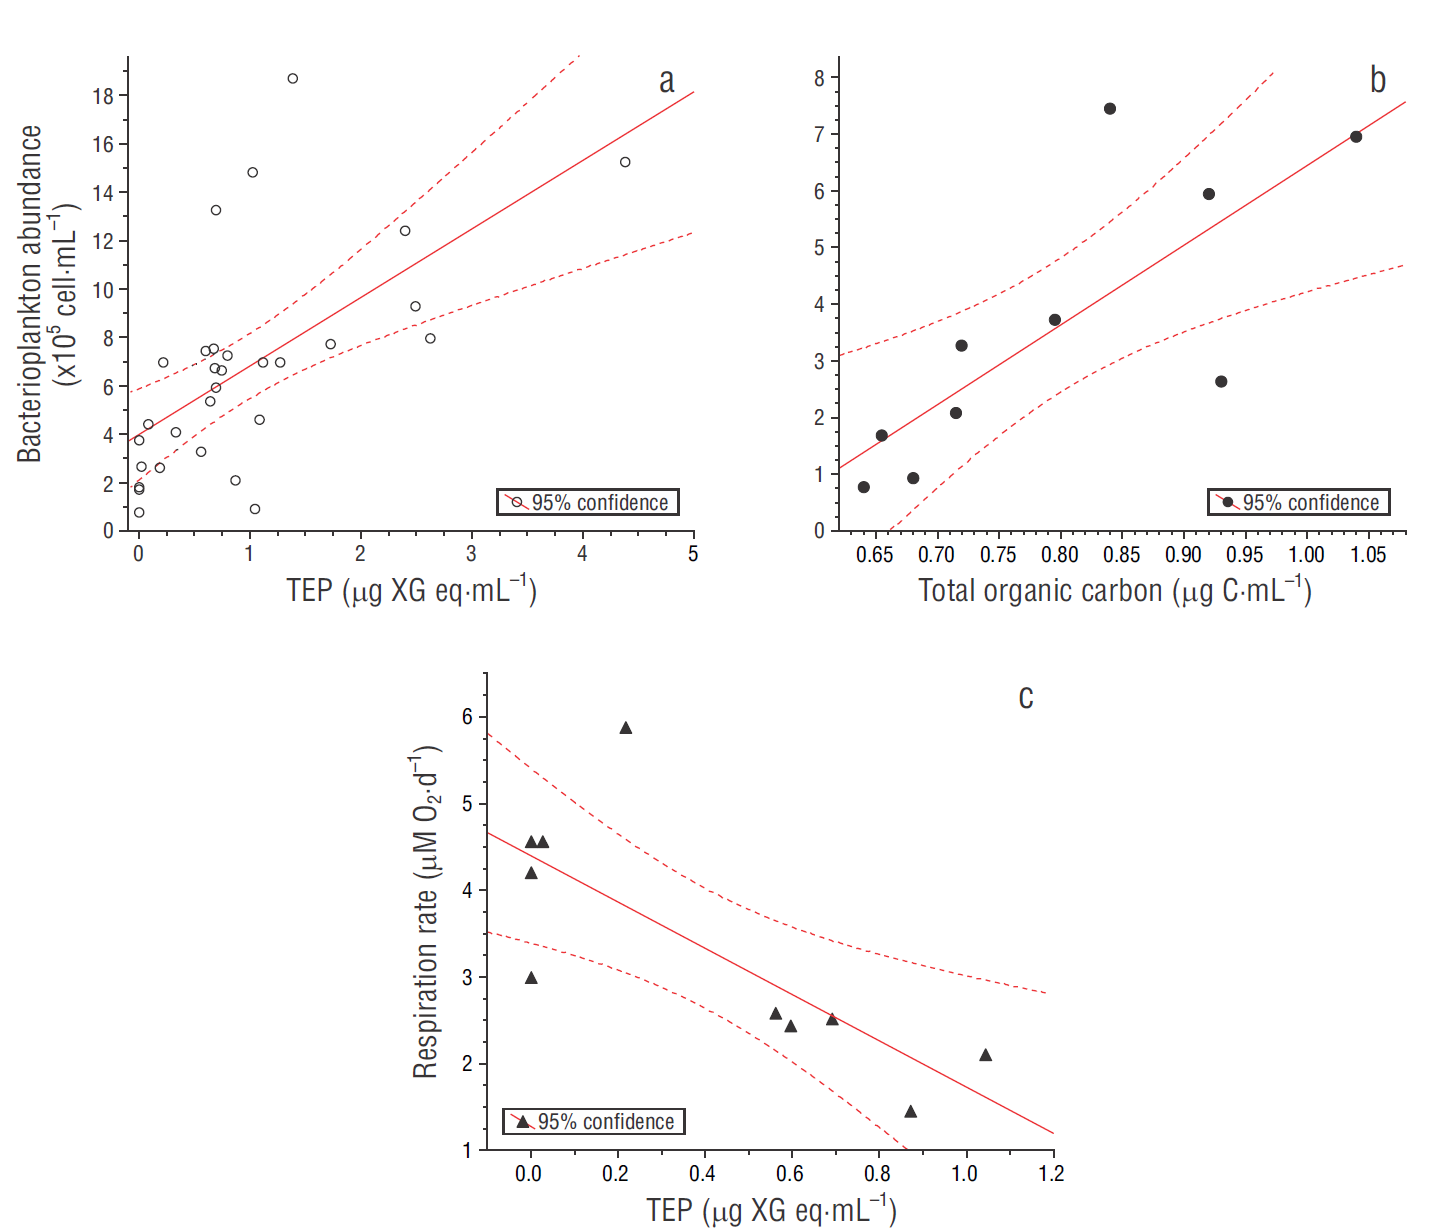
Figure 6 Scatter plots of bacterioplankton abundance vs transparent exopolymer particles (TEP) (a), bacterioplankton abundance vs total organic carbon (b), and microbial respiration rate vs TEP (c). Linear regressions are as follows. (a) bacterioplankton abundance (×105 cell·mL-1) = 2.83 × (μg XG eq·mL-1) + 3.98; R 2 = 0.38, n = 30, P < 0.05. (b) Bacterioplankton abundance (×105 cells·mL-1) = 14.05 × ( μg C·mL-1) - 7.61; R 2 = 0.61, n = 10, P < 0.05. (c) Respiration rate (µM O2·d-1) = -2.6682 × (μg XG eq·mL-1) + 4.3982; R 2 = 0.59, n = 10, P < 0.05.
We are aware that the TEP magnitudes observed during the study period may have been affected by interannual variability or other low-frequency events (Kim and Miller 2006). The year 2016 was relatively warm due the prevalence of El Niño conditions during the first 6 months (NOAA-ERSL 2016). In the California Current System, the presence of El Niño has been associated with the deepening of the nutricline and possibly with a lower input of nutrients to the upper layer (Mann and Lazier 2006, Gómez- Ocampo et al. 2017). A depth-integrated primary production data set from 2003 to 2004 showed lower production values during a weak 2002- 2003 El Niño in the winter time (Martínez-Gaxiola et al. 2010). This low production is consistent with the progressive decrease of chlorophyll biomass during the 2015-2016 El Niño, as determined from satellite oceanic data and the Regional Ocean Modeling System (ROMS). However, this decrease is not as marked as the observed magnitudes of El Niño 3.4 Index suggest (Jacox et al. 2016). Our high concentrations of TEP could be comparable with those observed in some experimental studies, where under nutrient-limited conditions, growing phytoplankton cells are more likely to exude large amounts of polysaccharides (as TEP precursors) in the stationary phase (Guerrini et al. 1998, Wurl et al. 2011) . Given the anomalously warm conditions, a positive effect on TEP aggregation would also be expected due to the increase in temperature to up to 32 ºC (at 8.2 pH), which is the upper threshold experimentally established for the inhibition of marine microgel self-assembly (Seebah et al. 2014, Chen et al. 2015).
Our results indicate that the seasonal and spatial distribution of TEP is influenced by hydrographic properties and the dynamics of primary producers in the upper layer of the water column in the study area, which is part of the California Current System. In spring and early summer, dissolved organic precursors derived mainly from macroalgae and phytoplanktonic exudates and grazing (sloppy feeding, excretion, and defecation) are largely produced and spontaneously self-assembled as TEP in the euphotic zone. Thus, TEP associated to a ballast particle may be efficiently exported to the deep ocean, where their labile carbon is continuously subjected to consumption and heterotrophically transformed into refractory organic carbon. In a spatial scale, TEP tend to decrease predominantly along a trophic gradient from the most influenced upwelling location to offshore or oceanic waters. Hence, the present study corroborates that under relatively mesotrophic- to-eutrophic conditions, TEP seem to be more dependent on nutrient availability and photoautotrophic activity in the uppermost layers, whereas in the deeper layers TEP and their precursors are relatively more controlled by heterotrophically mediated processes that contribute to the increase of their degree of assemblage and recalcitrance (Lechtenfeld et al. 2015, Moran et al. 2016). Our carbon estimates based on depth -integrated TEP are strongly influenced by the conversion factor we chose and the pore size of the filter we used. This influence limits some interpretations regarding the contribution of TEP to the carbon budget, whereby the observed magnitudes can be considered mainly for relative spatiotemporal comparisons until a calibration of the method for this region has been performed. This potential contribution of carbon associated with TEP below the euphotic zone is more relevant in offshore waters than in nearshore areas, and it should be taken into account in future carbon budgets calling for better measurement methods. However, our relatively limited data set suggest that bacterioplankton is tightly coupled with TEP, serving mostly as a physical substrate rather than a labile or semi-labile carbon source. We recommend a more intense time series monitoring of TEP to corroborate their seasonal trends and magnitudes in years influenced by various oceanographic processes at interannual and decadal scales, together with the differences in the concentrations of alcian blue stainable particles collected with different filter pore sizes. Future studies must also assess the physiological implications of TEP on prokaryotic activity and their significance in the organic carbon budget.

