


 nueva página del texto (beta)
 Inglés (pdf)
 Artículo en XML
 Referencias del artículo
 Enviar artículo por email
 Citado por SciELO
  Similares en
SciELO
Similares en
SciELO 
 Permalink
Introduction
The Gulf of California (GC) is the only evaporative basin that communicates with the North Pacific Ocean. The entrance to the GC is wide (~200 km) and deep (~2.5 km), so waters can exchange freely between the gulf and the Pacific Ocean. Water exchange with the Pacific is important to the gulf; estimates from observations of the divergence of heat flux within the gulf indicate maximum heat gain (loss) from the Pacific of ~20 1012 W (approximately -59 1012 W) in May (November) (Castro et al. 1994). These exchanges are accompanied by strong currents (0.3-0.4 m·s-1 in the upper 300 m) that transport both surface and near-surface Pacific waters into the gulf, which are subsequently modified within the gulf. These transports are narrow (~45 km) inflows and outflows that extend throughout the water column (Roden 1972, Collins et al. 1997, Mascarenhas et al. 2004). Since evaporation exceeds precipitation in the GC, there is a positive anomaly in salinity, which must be exported to the Pacific Ocean for balance (Beron-Vera and Ripa 2002).
The upper waters at the entrance to the gulf are characterized by the commingling of 3 surface water masses: cool California Current Water (CCW) of intermediate salinity from the northeastern Pacific Ocean; warm, fresh Tropical Surface Water (TSW) from the eastern equatorial Pacific; and warm, salty Gulf of California Water (GCW) (Griffiths 1968, Castro et al. 2006, Portela et al. 2016). Boundaries between these waters and the water’s mixing patterns result in strong fronts (saline and thermal) (Lavín et al. 2009, Collins et al. 2015). Subsurface waters at the mouth of the gulf are source waters for poleward flow in the California Undercurrent along the west coast of the Baja California Peninsula (BCP) (Goméz-Valdivia et al. 2017). At the mouth of the gulf, waters 150-200 m to about 700 m depth contain little dissolved oxygen, from 2 to 4 μmol·kg-1 (Castro et al. 2011, Cepeda-Morales et al. 2013). Since increased advection of these waters may be responsible for decreasing oxygen concentrations in the Southern California Bight (Bograd et al. 2008), it is important to better understand how the waters of the GC interact with those of the Pacific Ocean.
The flow and water properties at the entrance to the GC have been measured by our group (UABC-NPS) along a section across Pescadero Basin (PB) since May 1992. The section extends from Sinaloa westward to BCP (Fig. 1) and has been occupied by research vessels 18 times. Pegasus coarse spatial measurements of surface -to-bottom current velocity along this section (Collins et al. 1997) showed that the baroclinic features observed by Roden (1972) are deep jets (0.1 m·s-1 velocities at 1,000 m) that are topographically steered in a cyclonic manner into the gulf along Sinaloa and out of the gulf along BCP. Geostrophic currents observed along this section during later cruises also showed a cyclonic flow in PB (Collins et al. 1997, 2015; Mascarenhas et al. 2004) and confirmed the annual cycle of seasonal horizontal heat transport at the entrance to the gulf derived from historical data (Castro et al. 1994).
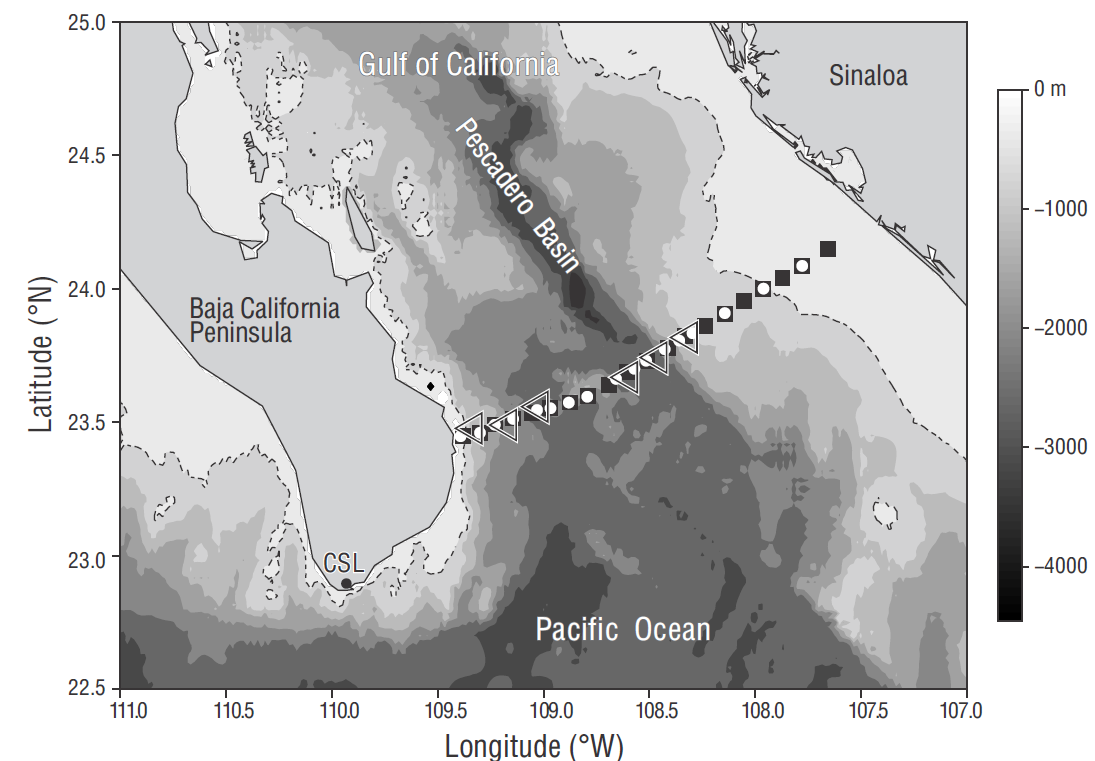
Figure 1 Location of the 20 CTD stations occupied at the mouth of the Gulf of California during the PESCAR24 cruise on 19-21 April 2013 (■) . White circles indicate the location of the CTD stations occupied during the PESCAR01 cruise on 2-5 May 1992, and triangles indicate the location of Pegasus stations during April and May 1992. Bottom depth (m) is given by the shaded area. The 500-m isobath is included (dashed line). CSL = Cabo San Lucas.
The cyclonic flow pattern observed at the entrance to the gulf has been characterized mainly by the presence of GCW on the western side, whereas CCW and TSW have been observed at the center and on the eastern side, respectively (Castro et al. 2000; Collins et al. 1997, 2015) . This pattern appears to be somewhat seasonally modulated. Between late spring and summer, the California Current is better developed and CCW is most persistent at the entrance to the gulf (Durazo 2015, Portela et al. 2016), though intrusions of CCW are also observed in fall and winter (Castro et al. 2000). Gulf of California Water has been observed mainly in late fall and winter at the entrance to the gulf, when southward winds are strongest and persistent over the entire GC, but it was also present in other seasons, mostly on the western side of the entrance (Castro et al. 2000, Collins et al. 2015). Tropical Surface Water is linked with the Mexican Coastal Current, which has greatest incidence at the entrance to the gulf in summer and fall (Kessler 2006, Lavín et al. 2006, Portela et al. 2016).
In 19-21 April 2013, hydrographic stations across the entrance to the gulf were again sampled, taking advantage of the return of the R/V Point Sur to Moss Landing, California, from Antarctica. This cruise was designated PESCAR24 (P24), indicating the 24th cruise of the Pegasus in the Sea of Cortes Area (PESCAR) program. The objectives of this paper are to describe water properties and circulation observed during the April 2013 cruise and to evaluate water and heat exchanges. Results are compared with observations from April and May 1992, PESCAR01 (P01).
Materials and methods
Twenty stations, 10 km apart, composed the hydrographic section across PB (Fig. 1). At each station, a Sea-Bird Electronics 911plus Conductivity- Temperature-Depth (CTD) instrument fitted with a 12-place rosette and a downward-looking Acoustic Doppler Current Profiler (LADCP) was deployed. Each CTD cast extended from the surface to near bottom. The calibration and processing of data were documented in Rago et al. (2013). Water samples for calibration of CTD measurements were collected at the bottom of each cast and then either at the salinity minimum or at the surface of each cast. Geostrophic velocity was calculated from the CTD data using the deepest common depth for 2 contiguous stations as the reference level.
In addition to temperature (dual sensors), conductivity (dual sensors), and pressure, the CTD also measured fluorescence and dissolved oxygen. Oxygen was measured with an SBE 43 oxygen sensor, and data were processed using a post-cruise laboratory calibration. Initial accuracy of dissolved oxygen measurements was ±2% saturation.
LADCP data were processed using IFM-GEOMAR processing software (Visbeck 2002, Thurnherr 2010). Auxiliary data used with this software package included navigation data recorded during CTD data collection at the rate of 24 samples per second and broadband shipboard ADCP (SADCP) data. Processed LADCP data contained zonal and meridional velocity components at 8-m vertical bins. The velocity inversion errors for the LADCP typically ranged from 0.001 to 0.01 m· s-1.
Two Acoustic Doppler Current Profilers (SADCP), a 75-kHz Ocean Surveyor, and a 300-kHz Workhorse Mariner were installed in a well on the keel of the R/V Point Sur. The Ocean Surveyor operated continuously in 2 modes: a broad-band mode, which obtained data in 8-m bins to a depth of about 500 m, and a narrowband mode, which obtained data in 16-m bins to a depth of about 700 m. Data were collected every 2 s and averaged into 5-min ensembles. The Workhorse Mariner collected data at 1-s intervals in 2-m bins to a depth of about 100 m, and data were averaged into 2-min ensembles. Data were processed using software provided by the University of Hawaii (http://currents.soest.hawaii.edu/docs/doc). The SADCP data used here were further averaged at and adjacent to the station positions for both calculation of horizontal fluxes and comparison with LADCP data. After processing, these SADCP velocity data were accurate to about 0.01 m· s-1 (Teledyne RD Instruments 2009a, b).
Volume transport was computed as Vt(z) = ∑ x Vr(x ,z) Δx following the method of Bryden et al. (2005), where Vr is the velocity from LADCP and SADCP rotated perpendicular to the PB section. For the geostrophic transports, Vr was replaced by geostrophic velocity (Vg). Transports were also calculated for P01 using the velocity observations from Pegasus (Spain et al. 1981) during April and May 1992 (Collins et al. 1997).
Results
The regional circulation during the cruise consisted of counter-rotating eddies southwest of PB and anticyclonic flow across PB (Fig. 2). These features were observed by surface geostrophic currents obtained from the absolute dynamic topography for the sea surface as determined by satellite altimeter measurements (http://www.aviso.altimetry.fr/duacs/). The 110.0ºW meridian, which extends southward from Cabo San Lucas (the southern tip of BCP, Fig. 1), separated a ~50-km-radius anticyclonic eddy to the east and a cyclonic eddy of similar size and intensity to the west. The pair of eddies redirected the California Current inflow that normally occurs along Sinaloa (111.5ºW) into the gulf as a narrow inflow jet along the BCP coast. The eddies also blocked the direct southward flow along BCP from the Gulf of California, so that outflow occurred farther to the east, along about 108.0ºW. For the PB section, shipboard current measurements (SADCP) vertically averaged from 8 to 32 m were compared with surface geostrophic currents (Fig. 2). In general, the pattern of the flow measured from the ship was similar to that observed by satellite, but the magnitude of the currents observed from the ship was about twice that obtained from satellite data. Note that comparisons could not be made close to shore due to land interference with satellite altimeter measurements.
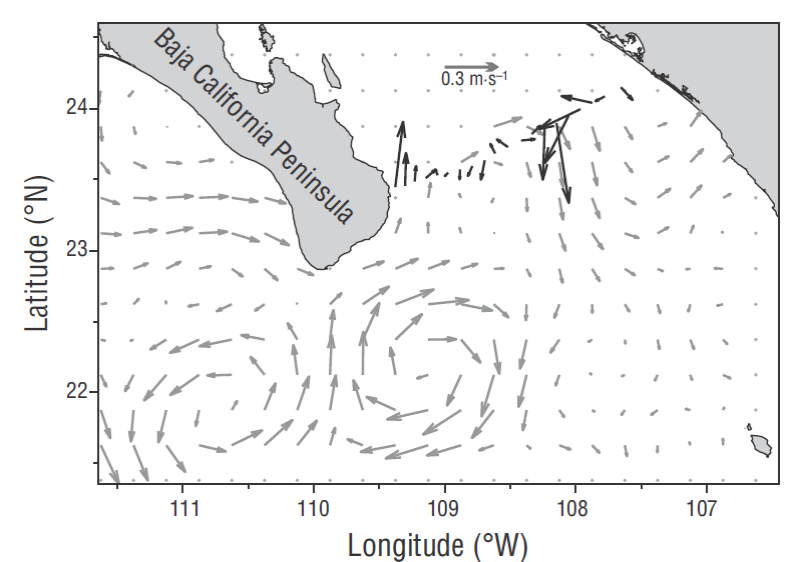
Figure 2 Surface geostrophic velocities (gray vectors) derived from AVISO absolute dynamic topography for 19-20 April 2013. Black vectors represent near-surface currents observed by the shipboard Acoustic Doppler Current Profiler (averaged between 8 and 32 m) during the same period aboard the R/V Point Sur.
The flow across PB, between ~23.5ºN and 109.4º-108.0ºW, was anticyclonic. This is the first time this flow pattern was detected by our shipboard observations. Geostrophic surface current measurements based on altimetry indicated a weak anticyclonic flow (Fig. 2), while the SADCP observations that overlapped the satellite measurements showed a stronger flow. The SADCP data indicated strong outflow (~0.6 m· s-1) at ~108.25ºW and 23.75ºN in contrast to the weak (~0.2 m· s-1) outflow detected by the altimeter. Shipboard observations also showed stronger inflow than that measured by satellite data along BCP (~0.2-0.35 m· s-1).
The thermohaline variability of the water mass structure at the entrance to the GC was charactherized by potential temperature-salinity ( θ-Sp) relationships (Fig. 3). Data are shown for the cruise from April 2013 (P24, stations 1-20; Fig. 2) and for 17 historical cruises between 1992 and 2005 along the same section. Water mass boundaries were obtained from Portela et al. (2016) . Historical cruises included data from winter (4 cruises), spring (4 cruises), summer (4 cruises), and fall (5 cruises). Deeper waters (Pacific Intermediate Water and Pacific Deep Water) showed little salinity variability ( ΔSp = ~0.04) compared to upper waters (<26.5 kg·m-3), in which ΔSp ~ 1.38 and ~ 20.5 ºC. Upper waters included TSW, GCW, CCW, and Subtropical Subsurface Water (SSW). Data from previous cruises indicated spatial and temporal variability at the entrance to the GC, with ranges that characterized the annual cycle and interannual variability in the area (Castro et al. 2000, 2006). But spatial variability for this spring cruise (P24) covered large ranges in salinity ( ΔSp ~ 1.19) and temperature ( ~ 12.6 ºC) for density anomalies <26.5 kg·m-3. Minimum salinities were observed mostly on the western side of the section, whereas higher salinities were observed toward the eastern side (though high salinities also occurred in the west).
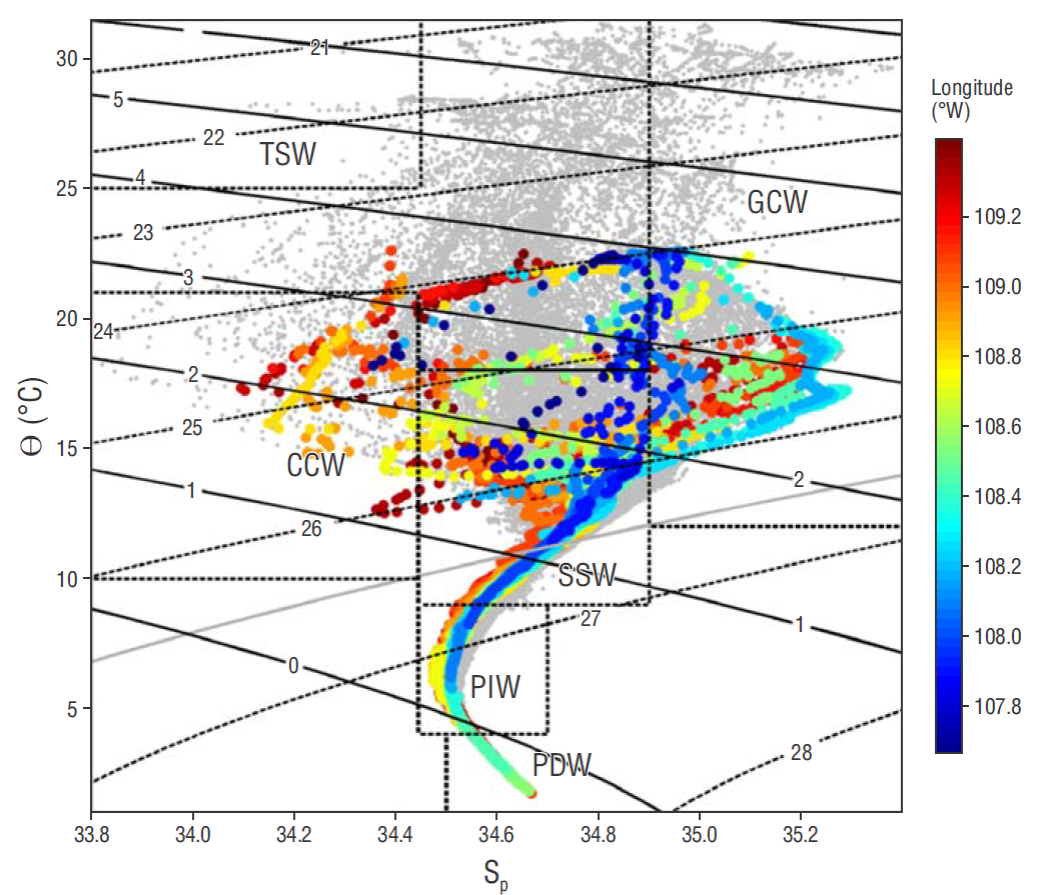
Figure 3 Potential temperature ( θ, ºC) and salinity (Sp) diagram for CTD casts at the entrance to the Gulf of California for PESCAR24 (color circles) and historical (gray circles) cruises. The color-bar at the left indicates the longitude (ºW) of the hydrographic station along the section. Dashed black line contours indicate density anomaly (kg·m-3), and solid black line contours indicate spiciness (kg·m-3). The 26.5-kg·m-3 isopycnal is identified by a solid gray line. TSW = Tropical Surface Water; GCW = Gulf of California Water; CCW = California Current Water; SSW = Subtropical Subsurface Water; PIW = Pacific Intermediate Water; and PDW = Pacific Deep Water.
The vertical distribution of water properties along the PB section showed the subsurface extent of the anticyclonic flow observed in surface waters (Fig. 4). In the upper 150 m, cores of high-salinity GCW were observed on either side of the gulf, with the saltiest water (S 35) centered at about 75 m depth (Fig. 4a). The salinity core observed off Sinaloa was much larger than that observed off BCP; the latter extended only from 50 to 100 m and was overlain and separated from the eastern core by fresher water (S 34.5).
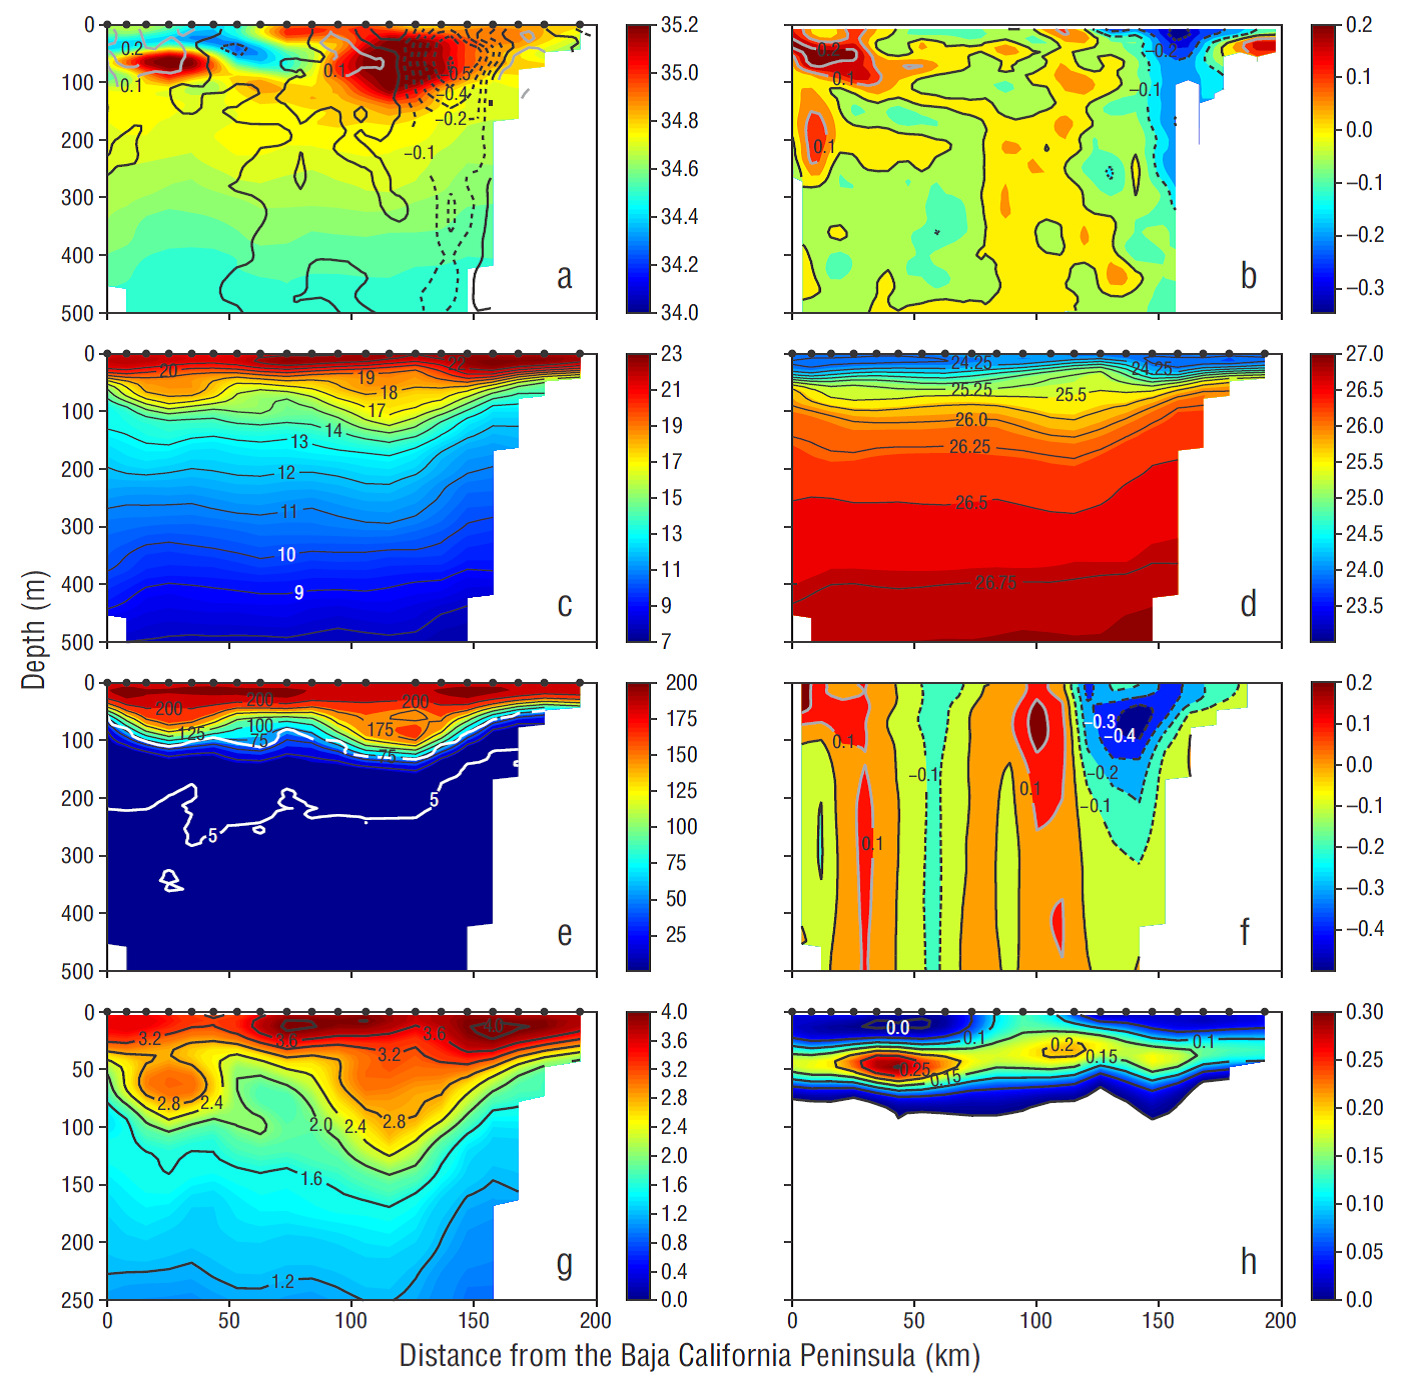
Figure 4 Vertical sections of water properties across Pescadero Basin on 19-20 April 2013: (a) Salinity (color) and flow (contours, m·s-1) into the Gulf of California (GC) (negative contours are indicated by dashed lines and represent the flow out of GC, and velocity data include both SADCP and LADCP observations), (b) flow across the GC (dashed isotachs represent westward flow), (c) potential temperature (ºC), (d) potential density anomaly (kg·m-3). (e) dissolved oxygen (µmol·kg-1), (f) geostrophic velocity (m·s-1), (g) spiciness (kg·m-3), and (h) fluorescence (mg·L-1). The contour intervals are 0.1, 1.0 ºC, 0.25 kg·m-3, 25.0 µmol·kg-1, 0.1 m·s-1, 0.4 kg·m-3, and 0.05 µg·L-1 for (a), (c), (d), (e), (f), (g), and (h), respectively. The 60-µmol·kg-1 (dashed line) and the 5-µmol·kg-1 contours (solid line) are white in (e). The contour interval for the velocity fields (a, b, f) is 0.1 m·s-1; the thick gray line is the zero isotach. Note that depth in (g) and (h) extends to only 250 m. Filled circles along the upper abscissa indicate the positions of the stations (see Fig. 1).
The distinguishing feature of the velocity field was the 50-km wide outflow close to the Sinaloa shelf and slope that extended from the surface to 500 m (Fig. 4a). This outflow partially coincided with a high-salinity core, between about 100 and 150 km from BCP. The zero isotach crossed the center of the salinity core, indicating that some of the high-salinity water was recirculating. Peak outflow rates were greater than 0.5 m· s-1 at 60 m depth. The largest inflow rate occurred close to the BCP coast in the upper 100 m, with a peak flow of 0.3 m· s-1; weaker inflows were also observed on either side of the outflow core at 50-75 m depth. Flows deeper than 500 m (not shown) were weak, generally less than 0.1 m· s-1, but had the same anticyclonic pattern as waters shallower than 500 m.
The flow across the gulf was also strongest close to both coasts (Fig. 4b). On the eastern side of the section, the flow was mostly westward, measured ~70 km wide, and showed maximum velocity values (-0.2 and -0.3 m· s-1) above 50 m. The -0.1 m· s-1 isotach reached ~300 m depth. On the western side, the flow was eastward above 300 m depth and measured >50 km wide; maximum velocity values (0.1-0.2 m· s-1) occurred above 100 m depth. At the center of the section, the across-section flow was mainly eastward but weak ( 0.05 m· s-1).
The 10 ºC isotherm rose almost monotonically from a depth of 375 m off BCP to a depth of 280 m off Sinaloa. The pattern of isotherms warmer than 12 ºC was more complex, with troughs indicative of anticyclonic circulation at distances of 20 and 120 km from BCP (Fig. 4c). Above 50 m, these troughs appeared to be partially compensated by doming isotherms. Warmest surface temperatures (~22.5 ºC) were observed over the Sinaloa shelf and slope. The density field was similar to that of temperature (Fig. 4d). Near the BCP coast, the slope of the deeper isopycnals (26.75 kg·m-3) was opposite to that for shallower isopycnals (25.25-26.25 kg·m-3), indicative of shallow inflow and deep outflow. Along the Sinaloa shelf and slope, however, all isopycnals upwelled, indicative of outflow that extended to depth.
Oxygen values were highest (180-220 µmol·kg-1) above 50 m depth (Fig. 4e) except close to Sinaloa (between 150 and 200 km), where waters upwelled and had values >100 µmol·kg-1. From 50 to 150 m depth, the oxycline changed drastically (175-25 µmol·kg-1), with 2 troughs at 25 and 125 km from BCP and a dome at ~80 km from BCP. Below 120 m, oxygen decreased quickly to minimum values. The lethal oxygen levels (<60 µmol·kg-1, marked with a white dashed line in Fig. 4e) occurred at ~85 m (~50 m) depth next to the BCP (Sinaloa) continental shelf. The bottom of the oxycline (5 µmol·kg-1) reached 275 m at 30 km from BCP and 120 m over the outer shelf off Sinaloa.
The geostrophic flow (Fig. 4f) had features similar to those of the directly measured flow (Fig. 4a). The distribution of the flow along the PB section showed alternating flows with sign changes from the surface to 500 m depth. Next to the Sinaloa shelf, the outflow was ~60 km wide and showed maximum speeds (-0.4 m· s-1) at 60 m depth, while the isotach of -0.1 m· s-1 reached ~300 m depth. Adjacent to this outflow, inflow occurred (~40-km width) with maximum speed (0.2 m s-1) at a narrow core (~10 km) between 40 and 100 m depth. Toward the west, outflow (~30-km width) was relatively weaker ( 0.1 m· s-1), distributed from the surface to 500 m depth. Finally, close to the BCP coast, inflow showed a core at above 100 m depth, with a width of ~30 km and speed of 0.1 m s-1. Between 0 and 50 m depth, close to BCP, the flow was ~0.2 m s-1.
The spiciness (Fig. 4g) and fluorescence (Fig. 4h) sections extended to only 250 m. Spiciness is most sensitive to thermohaline variations, least correlated with density, and conserved by isentropic motions (Flament 2002). Values of spiciness ranged from -0.1 to 4 kg·m-3 (see Fig. 3). Spiciness isopleths (Fig. 4g) were similar to those of temperature. Max-imum spiciness (>4 kg·m-3) was found at 10 m depth both over the outer Sinaloa shelf and at a distance of 70 km from BCP, with temperature (salinity) greater than 22 ºC (34.85). The center of 2 anticyclonic regions at 25 and 120 km from BCP and at 40 to 80 m depth, respectively, was marked by a depth maximum of the 2.8-kg·m-3 isopleth of spiciness and corresponded with thermostads between 19 ºC and 17 or 18 ºC. Spiciness isopleths also mimic temperature and upwell between 120 km and the Sinaloa shelf. Fluorescence was detected only at depths less than about 90 m (Fig. 4h). A sub-surface maximum greater than 0.2 µg·L-1 was found across the entire section except at shallow waters over the inner Sinaloa shelf, at about 40-50 m, where the maximum value was between 0.1 and 0.2 µg·L-1. The largest fluorescence value (>0.25 µg·L-1) was observed at 50 km and was associated with CCW (with the lowest observed salinity, see Figs. 3, 4a), which was observed to flow out of the gulf (Fig. 4a).
Comparison between PESCAR24 and PESCAR01 (May 1992)
The first cruise for the time series of PB observations (P01) took place ~21 years ago (2-5 May 1992). The distribution of properties in the upper layer for P01 (Fig. 5) was very different from that shown for P24 (Fig. 4). Salinity in upper waters (<200 dbar) for P01 (Fig. 5a) was fresher (S < 34.85) than for P24 (Fig. 4a); above 70 dbar, along both sections, salinity was <34.6. Maximum salinity values (S = 34.80-34.85) were marked by a core close to BCP, which was ~40 km wide between 80 and 190 dbar. The most prominent characteristic in P01 was that the isotherms and isopycnals domed below 120 dbar (Fig. 5b, c), which did not occur in P24 (Fig. 4c). Isotherms (isopycnals) were deepest at both coasts: the 10 ºC (26.5 kg·m-3) isotherm (isopycnal) fluctuated from 365 dbar (290 dbar) close to BCP to 250 dbar (175 dbar) 55 km (60 km) from BCP to 405 dbar (310 dbar) close to the Sinaloa shelf. The isopycnal domes were reflected in the velocity field. The velocity component into the gulf (Fig. 5a) was a well -defined, cyclonic flow pattern: waters flowing into the gulf were distributed from ~55 km from BCP to close to the Sinaloa shelf, while the outflow occurred close to BCP. A narrow core (~10 km wide) of 0.3 m s-1 was observed 90 km from BCP between 40 and 180 m depth; speeds of 0.2 m s-1 reached 300 m depth, and the 0.1 m s-1 isotach reached 500 m depth. The outflow also showed a core of 0.3 m s-1 (~30 km wide, 20-100 m depth). The 0.2 -m s-1 and 0.1-m s-1 isotachs reached ~350 m and >500 m depth, respectively.
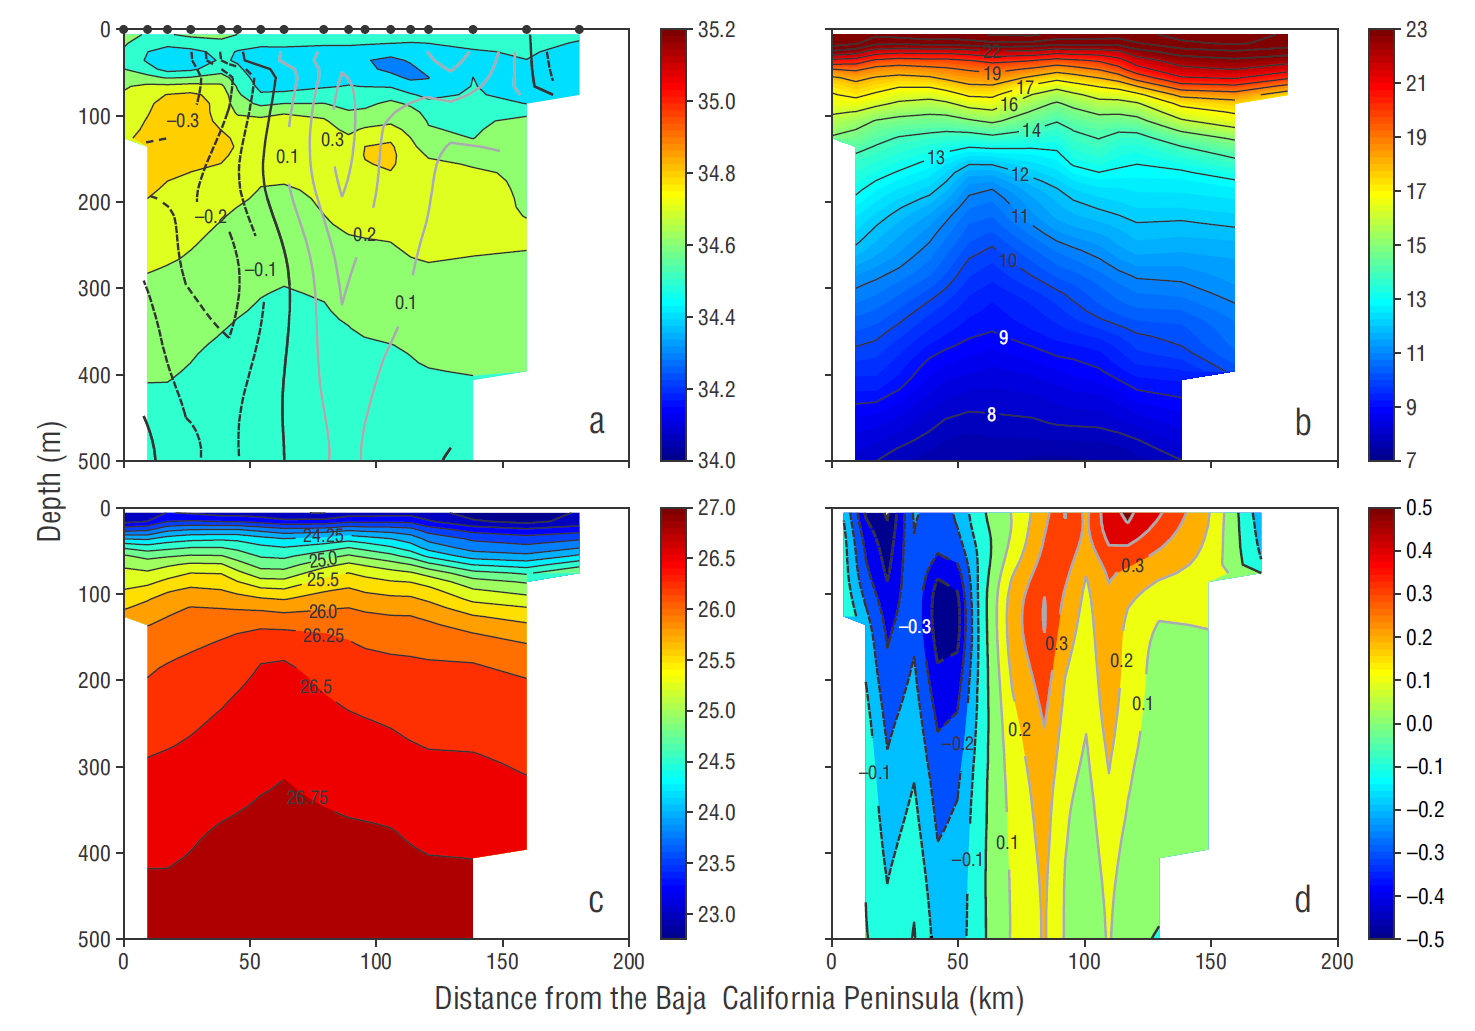
Figure 5 Water properties observed across Pescadero Basin on 2-5 May 1992: (a) salinity (color) and flow into the gulf of California (GC) (contours, m·s-1) measured by Pegasus (dashed lines represent flow out of the GC), (b) potential temperature (ºC), (c) potential density anomaly (kg·m-3), and (d) geostrophic velocity (m·s-1). The contour intervals are 0.1, 1.0 ºC, and 0.25 kg·m-3 for (a), (b), and (c), respectively. The contour interval for the velocity fields in (a) and (d) is 0.1 m·s-1, and the thick black line is the zero isotach. Filled circles along the upper abscissa indicate the positions of stations 1-17.
The geostrophic flow (Fig. 5d) showed the same cyclonic pattern. The zero isotach delimited the main inflow/outflow and was distributed between 50 and 60 km from BCP throughout the water column. The geostrophic flow had greater speed (up to 0.4 m s-1) than that observed with Pegasus (Fig. 4a). The geostrophic inflow occurred between 0 and 40 m (at ~120 km from BCP), while the outflow occurred between 0 and 80 m (15-25 km from BCP) and between 80 and 180 m (~40-50 km from BCP).
Volume transport
Meridional water transport estimated above 500 m depth for P24 using independent velocity measurements indicated net outflow from the gulf (Fig. 6a). The transports computed from SADCP and LADCP generally showed similar behavior, although transport computed with the LADCP was some-what greater, mostly above 230 m depth. Maximum outflow volume transport occurred at ~40 m depth: -8.6 103 m2 s-1 (SADCP) and -11.6 103 m 2 s-1 (LADCP) . Transports indicated inflow between 400 and 440 m and outflow between 440 and 500 m. Below 480 m depth, transport determined from LADCP resulted in a weak inflow, which fluctuated between ~1 103 and 2 103 m2 s-1. Only at 720 m and between 1,525 and 1,580 m depth was there a change in signs for transport (outflow), reaching ~0.5 103 m2 s-1 in the deeper depth range. Geostrophic volume transport generally had a similar structure to LADCP estimates, but with less variability. Outflow decreased from approximately -12.2 103 m2 s-1 at the surface to 0.0 m2 s-1 at 440 m depth, whereafter inflow (positive values) occurred to a depth of 1,300 m (maximum ~1.9 103 m2 s-1 at 800 m depth). A weak outflow (-0.5 103 m2· s-1) was observed between 1,300 and 1,900 m depth. Profiles of heat transport (not shown) were similar to those of volume transport and indicated that heat was transported out of the gulf in the upper 500 m.
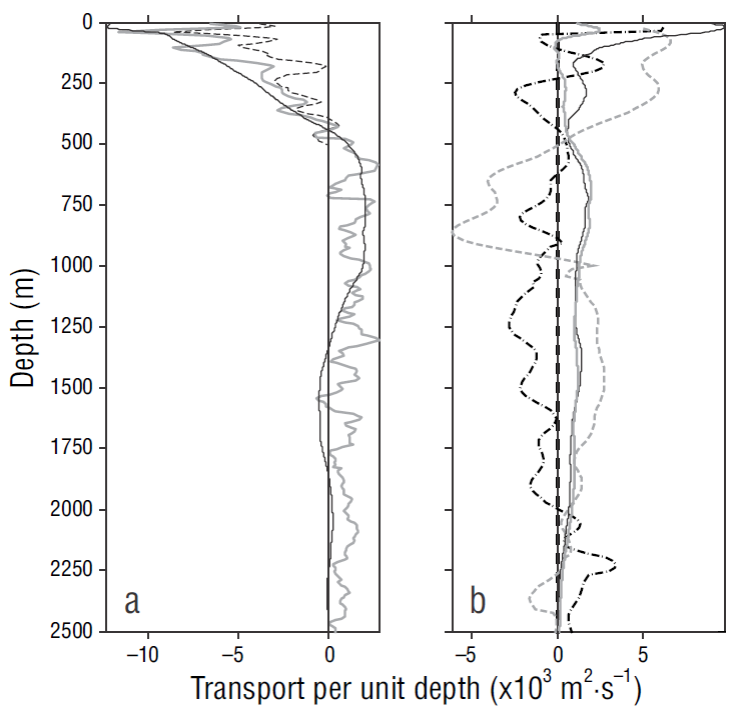
Figure 6 Vertical profiles of the water transports into the Gulf of California across the Pescadero Basin section. Positive (negative) values indicate inflow to (outflow from) the Gulf of California. (a) PESCAR24: lines represent different velocity estimates (gray line, LADCP; black dashed line, SADCP; and black solid line, geostrophic). (b) PESCAR01: gray dashed line represents the Pegasus estimates from April 1992 and black dash-dot line represents the Pegasus estimates from May 1992; the geostrophic transport for PESCAR01 (May 1992) is represented by the black solid line for all stations of the section, while the gray solid line represents only the positions of Pegasus soundings (see Fig. 1).
Transports into the gulf measured in April and May 1992 from Pegasus and geostrophy during P01 (Fig. 6b) were very different from those measured during P24. Above 500 m depth, transport during April 1992 showed inflow between 80 and 260 m depth (maximum ~6.5 × 10³ m2 s-1), outflow between 500 and 1,000 m (-6.1 × 10³ m2 s-1 at 860 m depth), and inflow between 1,000 and 2,250 m depth (maximum 2.7 × 10³ m2 s-1 at ~1,500 m depth). During May 1992, the transport estimates from Pegasus fluctuated above 500 m depth but showed mostly inflow above 250 m (maxima ~6.2 × 10³ m2 s-1 at 50 m depth) and outflow between 230 and 450 m depth (-2.5 103 m2 s-1). Outflow occurred mainly between 650 and 2,000 m depth (maxima -2.7 103 m2 s-1 at 1,250 m) and inflow between 2,000 and 2,500 m depth (maxima 3.4 103 m2 s-1 at 2,230 m). The geostrophic transport using all stations from P01 (Fig. 6b, black line) was positive (inflow) for the entire water column, with maximum values in the upper layer (9.7 × 10³ m2 s-1 at 15 m depth) and at 750 m depth (1.6 103 m2 s-1). However, using only stations which bracket Pegasus soundings, the resulting geo-strophic transport estimate was positive and weaker above 500 m depth and changed to outflow only between 50 and 150 m depth (Fig. 6b, gray line). For P01, heat was transported into the gulf in the upper 500 m.
Discussion
Although currents forced by tides were included in our observations, they are too weak to transport the volumes of water needed to heat and cool the GC (Castro et al. 1994). One of the reasons for weak tides is water depth in PB. But the magnitude and depth of the observed flows should also be noted. Here, P01 is the better example, with 2 deep flows (~0.1 m s-1 at 1,000 m, see Collins et al. 1997) associated with the observed cyclonic circulation that warms the lower gulf. A numerical model of the tides for GC indicates tidal currents of ~10-3 m s-1 in the southern GC deep waters (Marinone and Lavín 2005). The outer shelf off Sinaloa is a region in which strong tidal currents could impact transport estimates. Gutierrez-Othón (2010) measured lunar semidiurnal tidal currents of ~0.02 m s-1 at the 180-m isobath, 50 km west of Sinaloa. Both P01 and P24 resolve the circulation on the outer shelf off Sinaloa, and currents above the outer shelf (see Figs. 5a and 4a, respectively) were linked to offshore flows. Note, too, that our velocity measurements show flow reversal in shallow water (~50 m) off Sinaloa for uniform flows of 0.08 m s-1 over the inner shelf. If these were tidal flows, they would contribute errors of 0.08 Sv to transport sums or 1,600 m2 s-1 to transport estimates between the surface and 50 m (Fig. 6).
In April 2013, observed currents (SADCP, LADCP) indicated anticyclonic flow at the entrance to the GC (PB) (Figs. 2, 4). These results were unexpected, as this was the first time that anticyclonic conditions had been observed from measurements along this section. A cyclonic pattern is typical (Fig. 5) (Roden 1972; Collins et al. 1997, 2015; Castro et al. 2000; Mascarenhas et al. 2004; Zamudio et al. 2008; Lavín et al. 2009). In April 2013 the strongest outflow (~0.6 m s-1) occurred at ~108.25ºW/23.75ºN and coincided with outflow obtained by altimeter observations. The outflow extended to ~500 m depth and carried a core of high salinity GCW in the upper 140 m (Figs. 3, 4). On the western side of the basin, close to BCP, currents indicated a northward flow (~0.2-0.3 m s-1), which transported low-salinity waters with CCW characteristics into the gulf (Figs. 2, 4).
Castro et al. (2000), using 9 oceanographic cruises across the PB section, schematized circulation in the upper 200 m. They suggested a cyclonic interchange between the gulf and the Pacific, with outflow close to BCP carrying surface and subsurface GCW and inflow at the center or eastern portion of the PB section carrying TSW at the surface and CCW at the subsurface (~70 m) . In April 2013, anticyclonic circulation was evident: a core (or intrusion) of CCW near BCP was observed with an outflow of salty water (GCW) at the eastern side of the section (Fig. 4). Historical observations from winter and early spring indicate the occurrence of GCW in the upper 150 m in the southern portion of the gulf and the PB section (Castro et al. 2000, 2006; Portela et al. 2016).
The southeastward flow of the California Current off BCP reaching the entrance to the GC has been reported mainly from satellite altimetry. Godínez et al. (2010) showed that, on average, the surface circulation includes a branch of the California Current heading landward toward GC, and Kurcyn et al. (2012) showed that this branch is well developed in spring. There is only one multiship synoptic survey of the region (US Fish and Wildlife Service vessels Black Douglas and Hugh Smith, Fig. 7), which took place in April 1960 (Griffiths 1968). Salinity distribution at 50 m (Fig. 7a) clearly shows a tongue of fresher CCW at 24.5ºN/113.0ºW, marked by minimum salinity (33.9-34.0), associated with the southward flowing California Current. At 21.5º-22.0ºN off the BCP tip (see Fig. 1), the low-salinity (~34.5-34.6) tongue appeared to penetrate cyclonically into the GC, intersecting the Sinaloa coast at 24ºN. The dynamic thickness computed between 50 and 500 dbar showed that the 0.73 dynamic meter isostere traced this flow into the gulf (Fig. 7b). Although the tongue of low-salinity CCW was found along the eastern side of the GC entrance, it is possible that the flow could be occassionally (April 2013) redirected closer to the western side of the GC (Figs. 2, 4).
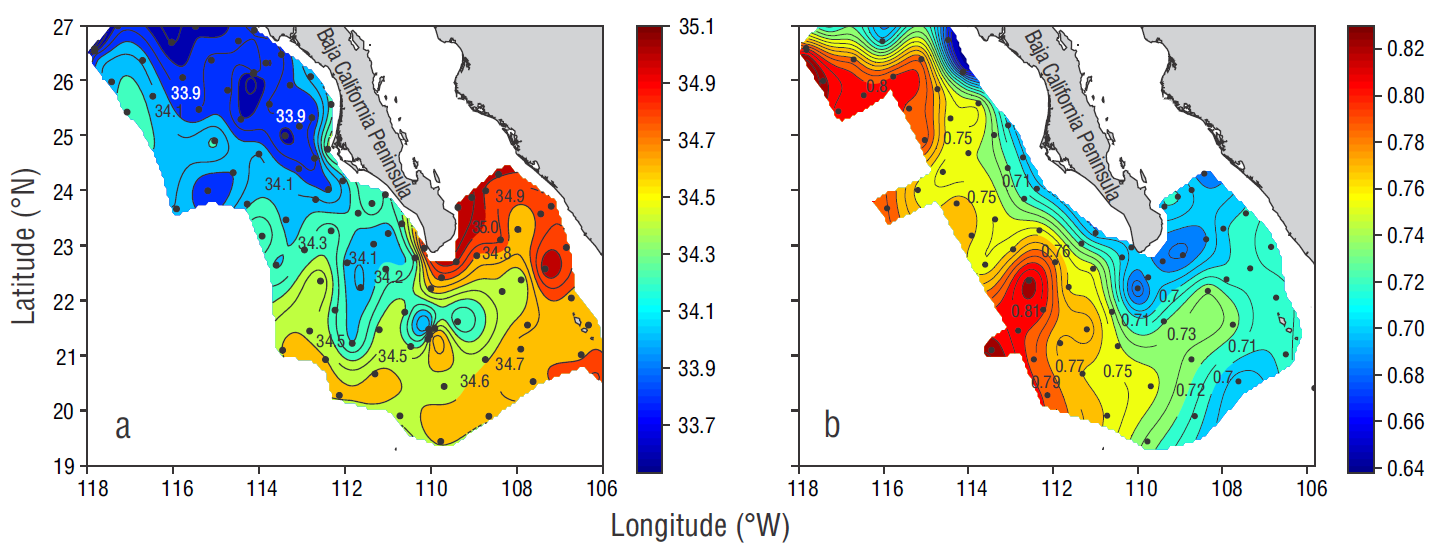
Figure 7 Distribution of (a) salinity at 50 m and (b) dynamic height (50/500 dbar) (dynamic meters) during an April 1960 multiship survey at the entrance to the Gulf of California.
Distribution of water masses estimated from a single cruise during April 2013 showed large variability for density anomalies <26.5 kg·m-3 (above ~260 m depth) due to the interaction between Pacific and gulf waters associated with a pair of eddies south of Cabo San Lucas (Fig. 2). These eddies could have been formed by a variety of processes (including baroclinic instability and topographic interaction) (D’Asaro 1988, Batteen 1997, Zamudio et al. 2008), and they pre-vented the California Current from flowing directly eastward.
To further understand the mesoscale structure of the horizontal flux along the PB section, anomalies of the water properties and inflow along potential density surfaces were determined by first calculating the average of the property on an isopycnal and then subtracting that from the observed data; for example, the salinity anomaly, S´ p , is calculated as S´ p = S p - <S p >, where <S p > indicates the mean value along an isopycnal (Fig. 8a). Likewise, an anomaly for the inflow to the gulf, V́, was determined. For waters with density <26.0 kg·m-3, the same lateral variability of ΔSp as shown in Figure 4a occurred, but with positive high-salinity waters and negative low -salinity waters along the isopycnals. Cores of high-salinity anomaly (S´ p > 0.4) from the GCW occurred on the 25.1 kg·m-3 isopycnal at both 20 km and 120 km, and on the 25.6 kg·m-3 isopycnal at 120 km. Sixty kilometers to the east of BCP, negative (low) salinity anomalies dominated, with a core of -0.4 to 0.7 between density anomalies of 24.1 and 26.0 kg·m-3. These were nearly coincident with the inflow near BCP. Portela et al. (2016) showed salinty maps for the 25.0 kg·m-3 isopycnal near BCP, and they observed separate branches of the California Current that turned south-eastward near the entrance to the gulf and further southward off the mainland Mexican coast.
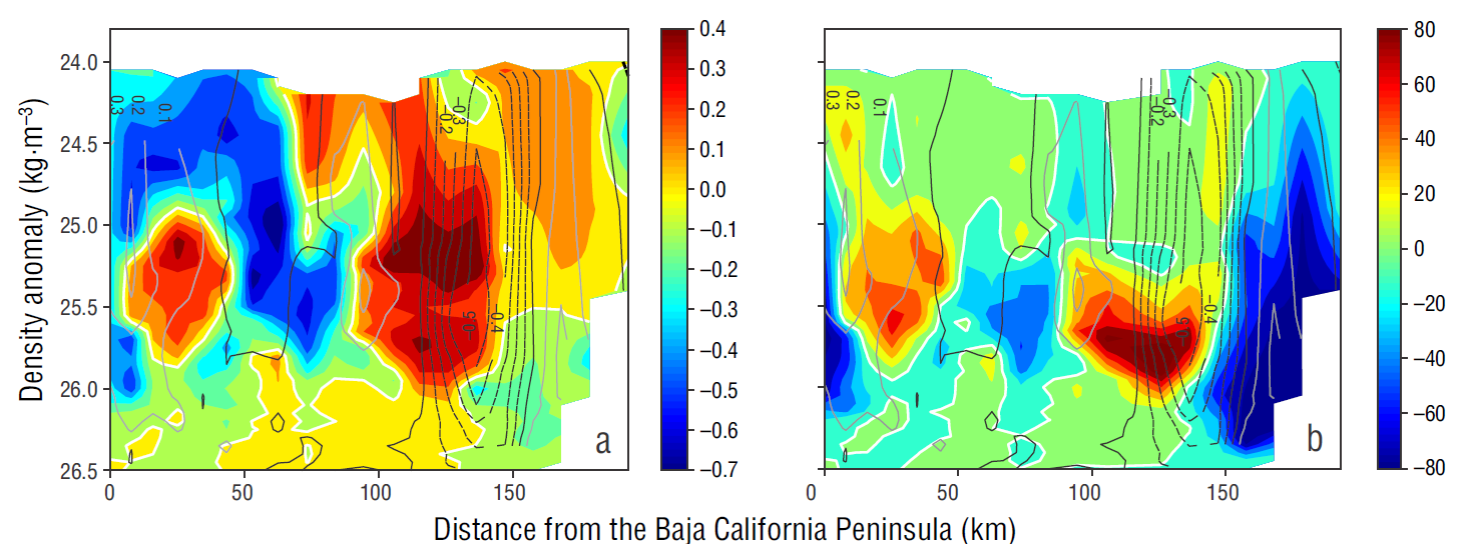
Figure 8 Anomalies of (a) salinity (kg·m-3) and (b) oxygen (µmol·kg-1) on potential density surfaces along the PESCAR section in Pescadero Basin. The contour intervals are 0.2 and 20.0 µmol·kg-1 for (a) and (b), respectively. The white line marks the zero contour. For both (a) and (b), inflow anomalies are shown with gray (positive) and black-dashed (negative) contours, while the zero inflow anomaly isotach is shown with a solid black contour. The contour interval is 0.1 m·s-1 for inflow anomalies.
Dissolved oxygen anomalies were large, partly due to the proximity of the oxygen minimum to the ocean surface but also to water-mass changes along the PB section (Fig. 8b). Note that the 26.5-kg·m-3 (26.0-kg·m-3) isopycnal (Fig. 4d) is similar in depth to the 5-µmol·kg-1 (60-µmol·kg-1) oxygen isopleth and that there was little horizontal variability of oxygen at 26.5 kg·m-3. Largest anomalies of dissolved oxygen (>40 µmol·kg-1) (Fig. 8b) occurred along the 25.8-kg·m-3 isopycnal and at the same location as that of higher salinity waters (i.e., GCW) (Fig. 8a) between density anomalies of 25.6 and 26.0 kg·m-3. Low dissolved oxygen anomalies (less than -40 µmol·kg-1) were observed close to both coasts on isopycnals between 25.0 and 26.4 kg·m-3. Near BCP (Sinaloa) these low oxygen waters were associated with CCW and SSW (TSW and SSW) (see Fig. 3).
The anomaly patterns for dissolved oxygen, salinity, and inflow indicated that GCW and the higher oxygen (>20 µmol·kg-1) were associated with outflow from the gulf and the subduction/mixing of high-oxygen surface waters in the central/northern gulf or Ballenas Channel (Roden 1964, Torres-Orozco 1993) . This is evidence of meridional over-turning circulation in the gulf. (Note that shallow overturning cells associated with coastal upwelling [Davis 2010] could have similar effects.) The highest negative oxygen anomalies were observed ~150 km east of BCP, where strong upwelling occurrred, and were likely due to TSW and SSW.
Observed horizontal transport for the entire water column from the surface to the bottom using 10-km resolution measurements have not been previously reported for the gulf entrance. The exchange of waters between the Pacific Ocean and GC across the PB section was anticyclonic during April 2013. This resulted in negative transports (from GC to the Pacific Ocean) above 500 m depth (Fig. 5a). This pattern was the same regardless of how velocity was observed (SADCP, LADCP, geostrophic balance). The upper layer (<150 m) dominated the horizontal flux into the gulf. The measurements reported here suggested a shallower over-turning circulation, above the ~26.0-kg·m-3 isopycnal (or the 60-µmol·kg-1 dissolved oxygen isopleth).

