


 nova página do texto(beta)
 Inglês (pdf)
 Artigo em XML
 Referências do artigo
 Enviar este artigo por email
 Citado por SciELO
  Similares em
SciELO
Similares em
SciELO 
 Permalink
Introduction
Marine microzooplankton (protists <200 μm in size, represented by heterotrophic nanoflagellates, ciliates, and heterotrophic and mixotrophic dinoflagellates), as components of a microbial food web, play a significant role in different ecosystems by consuming a wide range of prey (from pico- to microplankton cells) . This component represents an important trophic pathway for organic matter (carbon) and energy to be transferred from primary producers to higher trophic levels. Thus, the trophic function, structure (size and composition), and relative abundance of microzooplankton determine the amount of carbon available for higher trophic levels and the amount that can be "pumped" to the deep ocean (Chisholm 2000).
Some studies have shown that many productive and seasonal ecosystems, such as coastal upwelling systems, are characterized by multivorous food webs. In these systems, not only organisms belonging to the typical herbivorous trophic pathway (diatoms, copepods, and pelagic fish) but also microbial trophic components make up a complex trophic structure that gives this type of coastal ecosystems the ability to recycle carbon efficiently within the pelagic zone (Vargas et al. 2007, Linacre et al. 2010a, Teixeira et al. 2011, 2012).
Microzooplankton grazing impact has been measured on a global scale based on the widely used dilution method of Landry and Hasset (1982). On average, microzooplankton consumes 67% of phytoplankton daily production (Calbet and Landry 2004). In particular, significant differences in microzooplankton grazing and, consequently, carbon flow have been reported for several coastal regions. Seasonal dynamics in the composition and size of consumers, coupled with changes in their phytoplanktonic prey, leads to temporal variability in carbon and energy flows to higher trophic levels (Calbet et al. 2008, Texeira et al. 2011, Linacre et al. 2012).
Given the large significance of the trophic transfer of primary production through microbial pathways in a coastal ecosystem, the purpose of this study is to evaluate the daily microzooplankton grazing impact on phytoplankton community in a coastal upwelling system within the California Current System (CCS). Two strikingly contrasting seasons were considered, autumn 2015 and spring 2016, in an environment that has been subjected to intense anomalous interannual warming events in recent years (“The warm Blob” 2013-2015 and El Niño 2015-2016; Cavole et al. 2016, Jacox et al. 2016). These events changed the physicochemical structure of the water column and caused significant biological effects in the CCS (McClatchie et al. 2016, Zaba and Rudnick 2016, Gomez-Ocampo et al. 2017). In this context of anomalous warming, changes in growth and mortality dynamics of the phytoplankton community are expected. Under this environmental scenario, the present study estimated the phytoplankton growth and grazing rates in October 2015 and April 2016. In addition, total phytoplankton biomass (chlorophyll a), autotrophic components (pigment composition and taxonomic groups by microscopy), and potential microzooplankton consumers were determined for each season. These observations were carried out at the ENSENADA station, a coastal site that has been described as representative of the physicochemical conditions off northern Baja California, Mexico, and susceptible to the temporal variability (seasonal and interannual) that occurs in coastal areas (<50 km) (Linacre et al. 2010b).
Materials and methods
Seawater sampling
The ENSENADA sampling station (31.66ºN, 116.70ºW) is located in the northern region of the Baja California Peninsula (Fig.1). To study phytoplankton growth and mortality dynamics, experiments were carried out at this coastal site during 2 oceanographic cruises, one in October 2015 (OCT-15) and the other in April 2016 (APR-16). Continuous measurements of pressure, temperature, conductivity, dissolved oxygen, and fluorescence were recorded down to ~100 m depth using a CTD rosette. Seawater was collected using 5-L Niskin bottles at 7 optical levels within the euphotic zone (100%, 50%, 30%, 20%, 10%, 1%, and 0.1% of surface photosynthetically active radiation [PAR], %Eo) and at the depth level of the deep fluorescence maximum (DFM). For chorophyll a (Chla) (3 replicates) and accessory pigment analyses, 1 L of seawater was collected and filtered through a 25-mm GF/F filter, which was immediately frozen in liquid nitrogen.

Routine seawater analyses
At the laboratory, Chla concentrations were determined by the fluorometric non- acidification method described by Welshmeyer (1994) using a Turner Designs Trilogy fluorometer. Accessory pigment concentrations were determined by high-performance liquid chromatography (HPLC) following the techniques described in Almazán-Becerril and García-Mendoza (2008). Taxonomic assignments were based on known pigment compositions associated with phytoplankton groups previously reported for the study site (Linacre et al. 2012): divinyl chlorophyll a (DV-Chla) is found exclusively in Prochlorococcus populations; zeaxanthin (Zea ) is mostly assigned to cyanobacteria; fucoxanthin (Fuco) is mainly associated with diatoms; and peridinin (Perid) is found only in some dinoflagellate groups. Concentrations of 19'-hexanoyloxyfucoxanthin (Hex-Fuco) and 19'-butanoyloxyfucoxanthin (But-Fuco) are mainly found in some nanoflagellate groups, such as prymnesiophytes and pelagophytes, respectively. Nanoflagellate green algae usually contain chlorophyll b (Chlb), including some types of prasinophytes, whose characteristic pigment is prasinoxanthin (Pras).
Alloxanthin (Allox) is a specific marker for cryptophytes. To estimate the abundance of nano- and microplanktonic groups, 250 mL of seawater were collected with amber bottles at each depth level and fixed with 10% acid Lugol’s solution (Throndsen 1978). At the laboratory, samples were settled in 10, 25, 55, 75, and 100 mL sedimentation chambers, depending on cell density, following the method of Utermöhl (1931). Quantification and taxonomic analyses were carried out using a Leica DMI3000B inverted microscope equipped with 10×, 20×, 40× and 63× objectives. Each sample was quantified until reaching a minimum count of 400 cells. In case of low cell density, the whole chamber was quantified. Diatoms, dinoflagellates, nanoflagellates (autotrophic), ciliates, tintinnids, and other minor autotrophic groups (including silicofla-gellates and euglenoids) were identified and grouped using taxonomic keys (Tomas 1997, Omura et al. 2013). The microzooplankton group, as a potential mixotrophic consumer of phytoplankton, was represented by ciliates, tintinnids, and half of the dinoflagellate group according to the Linacre et al. (2012) approximation.
Preparation of experimental incubations
In order to simultaneously estimate phytoplankton growth and microzooplankton grazing rates, onboard experiments were conducted using seawater collected at the DFM depth in OCT-15 (~14 m) and APR -16 (~5 m) during sunset, following the dilution technique described by Landry and Hassett (1982) . Each experiment consisted of 6 treatments prepared with a fraction of “whole” seawater collected directly from the Niskin bottles and a fraction of “filtered” seawater passed through a 0.1 m filter (10%, 30%, 50%, 75%, 100% “whole” seawater). An additional control experiment was conducted using only “filtered” seawater (0%). These treatments were enriched with a mixture of nutrients (4.9 μM nitrate and 0.3 μM phosphate, final concentrations) to ensure optimal phytoplankton growth during the incubation period. In order to estimate “natural” phytoplankton growth rate, an additional treatment was prepared with only “whole” seawater (100%) and no additional nutrients. Each treatment and the replicates were incubated for a 24-h time period (t) in a blue acrylic container that simulated the optical conditions found in the euphotic zone (~36% Eo). The incubator was placed on the deck of the ship, exposed to sunlight, and connected to a continuous seawater flow to maintain the temperature of the mixed layer during the incubation period.
Estimation of daily growth and grazing rates
At the beginning and end (t = 24 h) of the experimental incubations, seawater was collected to determine the Chla and taxon-specific pigment concentrations (initial, C o; final, C t ) assigned to phytoplankton groups. The temporal change in pigment concentration in each treatment (i), k i = ln(C t /C o)/t, was used to estimate the instantaneous daily growth rates (d-1) of the phytoplankton community (based on Chla) and specific phytoplankton groups (based on taxon-specific pigments). A linear regression analysis between k i and each dilution factor (0.10, 0.30, 0.50, 0.75, and 1.00) was performed to simultaneously determine the daily growth rate of phytoplankton enriched with nutrients (µ n, intercept of the regression line) and the daily grazing rate by microzooplankton (m, slope of the regression line). The "natural” growth rate (µ o) was calculated as the sum of the net growth rate in the undiluted treatment without nutrient addition (k o) and m. The limitation in the growth rate of the phytoplankton community and specific autotrophic groups by insufficient environmental nutrients was estimated as the ratio µ o:µ n. Values of µ o:µ n < 1 indicate limited growth rates under nutrient deficiency in the environment. Moreover, the m:µ o ratio was calculated as a measure of the daily microzooplankton grazing impact on primary production of the phytoplankton community and taxon-specific phytoplankton groups. Initial concentrations of Chla and taxon-specific pigments and the estimated growth and grazing rates were used to assess primary production (PP), protist consumption (G), and the percentage of phytoplankton biomass consumed per day: PP = μ o (C o [e (μo-m) t - 1] / (μ o - m) t); G = m (C o [e μo-m) t -1]/ (μ o - m) t); and G 100/Co, respectively (Calbet and Landry 2004).
Results
Initial hydrographic conditions
During seawater collection at the DFM depth for the experimental incubations carried out at the ENSENADA station in OCT-15 and APR-16, marked seasonal differences in the hydrographic conditions of the surface water column (<100 m) were observed (Fig. 2). During OCT-15, the water column showed warmer waters (~15-21 ºC), higher salinity in the upper 10 m (~33.5), and lower density (𝜎t ~ 23.4-24.8 kg m-3). Although a shallow mixed layer (~10 m) was observed during this cruise, similar to that observed in APR- 16, the vertical temperature and density gradients were more pronounced, with a deeper thermocline depth (~45 m). In APR-16, colder (10.5-14.0 ºC) and less saline waters at the surface were observed, while at depths below 10 m, significantly more saline (~33.5-33.6) and denser (𝜎t ~ 25.0-25.5 kg m-3) waters were recorded, likely due to spring upwelling events (Fig. 2 a-c).

Biological conditions within the euphotic zone
The contrasting hydrographic conditions between OCT-15 and APR-16 and the difference in the depth of the euphotic layer (57 m for OCT-15 and 24 m for APR-16 at 0.1% Eo) were also evident in the variation of phytoplankton biomass (Chla) and abundance (cells L-1) in the euphotic zone (Fig. 3). Chla concentrations were higher in OCT- 15 (1.2-2.7 µg L-1) than in APR-15 (1.0-1.9 µg L-1) but only up to 30% Eo, where the maximum value (2.7 µg L-1) was recorded. Below that optical depth level, Chla concentrations in OCT-15 decreased significantly. In APR-16, the Chla maximum value (2.3 µg L-1) was recorded at 20% Eo (Fig. 3a). In general, phytoplankton abundance in OCT-15 was about half the abundance observed in APR-16 at all optical depth levels (Fig. 3b) . Differences in the relative abundance of phytoplankton groups and their potential microzooplankton consumers were also observed between cruises (Fig. 4). During OCT-15, nanoflagellates and other minor groups comprised on average ~40% of total autotrophs in the euphotic zone, but >60% near the surface. Below 30% Eo, dinoflagellates and diatoms had higher relative importance (>70%, Fig. 4a). In contrast, in APR -16, ~80% of total abundance at all optical depth levels was composed of diatoms, the dominant phytoplankton group during this season (Fig. 4b). In accordance to this relative distribution of autotrophs, potential microzooplankton consumers also displayed seasonal abundance variations. The warmer environmental conditions in OCT-15 favored a larger abundance of mixotrophic and heterotrophic dinoflagellates, which on average reached ~70% of total potential consumers in the euphotic zone. During the spring upwelling event in APR-16, mixotrophic ciliates were the major components of microzooplankton (~60% on average) (Fig. 4 c-d).

Figure 3 Chlorophyll a concentrations (a) and total phytoplankton abundance (b) in the euphotic zone at the ENSENADA station in October 2015 (OCT-15) and April 2016 (APR-16). Panel (a) shows the depth of the euphotic zone for each period. %Eo indicates the percentage of surface photosynthetically active radiation.

Growth and grazing estimates and microzooplankton grazing impact
Differences were observed in the instantaneous rates of natural growth (µ o), enriched growth (µ n), and grazing (m), as well as in primary production (PP) and daily microzooplankton consumption (G) on the phytoplankton community between OCT-15 and APR- 16 (Table 1). Strong limitation by nutrients (µ o:µ n < 1) was observed in the phytoplankton growth rate in OCT-15, with µ o almost 10 times lower than m (Table 1). The same pattern was recorded for some taxon-specific growth rates (Table 2). Particularly in OCT- 15, negative µ o estimates were observed for Fuco and Pras, and they were associated with the null growing of diatoms and prasinophytes, respectively. Other nano- and picoplanktonic groups, including cryptophytes and cyanobacteria assigned to Allox and Zea, respectively, showed very high µ o values and were apparently not limited by nutrient deficiency (µ o:µ n ≈ 1) (Table 2). In contrast, growth rates for the phytoplankton community and specific groups were not limited by nutrients in APR-16, with µ o up to 3 times higher than m (Tables 1, 2). Moreover, accessory pigment concentrations that were below the detection limit in previous seasons and are representative of some autotrophic nano- and microplankton groups, such as some types of dinoflagellates (Perid), prymnesiophytes (Hex-Fuco), and pelagophytes (But-Fuco), were detected during that spring season, allowing taxon- specific growth and grazing rates to be estimated (Table 2). High µ o values for diatoms (Fuco), dinoflagellates (Perid) and chlorophytes (Chlb), including prasinophytes (Pras), were observed in APR-16, whereas low growth rates were observed in crypto-phytes (Allox) and cyanobacteria (Zea) (Table 2). In OCT-15, G >> PP values were estimated for the phytoplankton community and specific phytoplankton groups, while in APR-16 G was always lower than or equal to (e.g., cyanobacteria) community and taxon-specific PP (Tables 1, 2). In addition, the differences in PP and G observed between the 2 seasons were reflected upon microzooplankton grazing pressure (m:µ = PP:G) on the initial biomass (C o) and daily PP of the phytoplankton community and on taxon-specific PP (Fig. 5). During OCT-15, grazing impact on C o was, on average, 72% (Fig. 5a), and grazing impact on community PP (Fig. 5b) and on PP of some small autotrophs was >100% (Fig. 5c). In contrast, an average microzooplancton impact of 62% on C o (Fig. 5a), 34% on community PP (Fig. 5b) and, overall, 51% on specific groups (Fig. 5c) was recorded in APR-16.
Table 1 Depth of maximum fluorescence (DFM, in meters) at which seawater was collected for the dilution experiments; chlorophyll a initial concentration (mean ± standard error) (C o, µg L-1); instantaneous rates (mean ± standard error) of natural growth (µ o, d-1), enriched growth (µ n, d-1), and grazing of the phytoplankton community (chlorophyll-a based) consumed by microzooplankton (m, d-1); nutrient limitation index (µ o:µ n); daily phytoplankton (chlorophyll-a based) primary production (PP, µg Chla L-1 d-1) and microzooplankton consumption (G, µg Chla L-1 d-1) rates; microzooplankton grazing impact on phytoplankton biomass (% Chla standing stock [SS] grazed, d-1); and percentage of microzooplankton grazing impact on daily primary production (%PP grazed). Values shown are those estimated at the ENSENADA station during this study (OCT-15 and APR-16) in comparison with values obtained in November 2008 (NOV-08), November 2007 (NOV-07), and April 2008 (APR-08).
| Cruise | DFM (m) | Co | µo | µn | m | µo:µn | PP | G | %Chla SS grazed | %PP grazed | Reference |
| Autumn | |||||||||||
| OCT-15 | 14 | 2.64 ± 0.03 | 0.12 ± 0.01 | 0.70 ± 0.14 | 1.14 ± 0.05 | 0.17 | 0.20 | 1.89 | 71.60 | 957.24 | This study |
| NOV-08 | 10 | 2.53 ± 0.07 | 0.30 ± 0.02 | 0.22 ± 0.03 | 0.48 ± 0.06 | 1.33 | 0.68 | 1.10 | 43.57 | 161.44 | Linacre, unpublished data |
| NOV-07 | 15 | 0.81 ± 0.03 | 0.47 ± 0.03 | 0.47 ± 0.03 | 0.13 ± 0.05 | 1.00 | 0.46 | 0.13 | 15.70 | 27.70 | Linacre, unpublished data |
| Spring | |||||||||||
| APR-16 | 5 | 2.08 ± 0.03 | 1.19 ± 0.00 | 1.04 ± 0.05 | 0.41 ± 0.09 | 1.14 | 3.73 | 1.29 | 61.84 | 34.47 | This study |
| APR-08 | 13 | 2.79 ± 0.05 | 0.66 ± 0.01 | 0.57 ± 0.02 | 0.49 ± 0.03 | 1.16 | 1.99 | 1.49 | 53.42 | 74.94 | Linacre, unpublished data |
Table 2 Initial concentration (C o, µg L-1) of accessory pigments associated with specific phytoplankton groups such as diatoms (fucoxanthin: Fuco), dinoflagellates (peridinin: Perid), prymnesiophytes (19'-hexanoyloxyfucoxanthin: Hex-Fuco), pelagophytes (19 - butanoyloxyfucoxanthin: But-Fuco), prasinophytes (prasinoxanthin: Pras), green algae (chlorophyll b: Chlb), cryptophytes (alloxanthin: Allox), cyanobacteria (zeaxanthin: Zea), and Prochloroccus spp. (divinyl chlorophyll a: DV-Chla). The instantaneous natural growth (µ o, d-1), enriched growth (µ n, d-1), and grazing (m, d-1) rates for specific phytoplankton groups consumed by microzooplankton were estimated based on taxon-specific pigments, nutrient limitation index (µ o:µ n), and daily taxon-specific (specific pigment-based) primary production (PP, µg L-1 d-1) and microzooplankton consumption (G, g L-1 dd-1) rates. Experimental values were estimated at the ENSENADA station during this study (OCT-15 and APR-16).
| OCT-15 | Fuco | Perid | Hex-Fuco | But-Fuco | Pras | Chlb | Allox | Zea | DV-Chla |
| Co | 0.50 | nd | nd | nd | 0.16 | 0.25 | 0.19 | 0.18 | 0.08 |
| µo | -0.10 | nd | nd | nd | -0.84 | 0.20 | 1.32 | 0.90 | 0.10 |
| µn | 0.10 | nd | nd | nd | 0.50 | 0.62 | 1.94 | 0.97 | 0.08 |
| m | 1.25 | nd | nd | nd | 1.07 | 0.87 | 2.68 | 0.71 | 0.74 |
| µo:µn | 0.10* | nd | nd | nd | 0.02* | 0.32 | 0.68 | 0.93 | 1.31 |
| PP | 0.00* | nd | nd | nd | 0.00* | 0.04 | 0.14 | 0.18 | 0.01 |
| G | 0.36 | nd | nd | nd | 0.11 | 0.16 | 0.28 | 0.14 | 0.04 |
| APR-16 | Fuco | Perid | Hex-Fuco | But-Fuco | Pras | Chlb | Allox | Zea | DV-Chla |
| Co | 0.28 | 0.07 | 0.30 | 0.07 | 0.07 | 0.14 | 0.07 | 0.06 | nd |
| µo | 1.11 | 1.35 | 0.74 | 0.67 | 1.50 | 1.70 | 0.48 | 0.54 | nd |
| µn | 1.36 | 1.47 | 0.95 | 0.95 | 1.63 | 1.58 | 0.56 | 0.68 | nd |
| m | 0.29 | 0.43 | 0.26 | 0.35 | 0.94 | 0.96 | 0.30 | 0.54 | nd |
| µo:µn | 0.82 | 0.92 | 0.78 | 0.71 | 0.92 | 1.08 | 0.86 | 0.78 | nd |
| PP | 0.48 | 0.15 | 0.29 | 0.06 | 0.13 | 0.36 | 0.04 | 0.03 | nd |
| G | 0.13 | 0.05 | 0.10 | 0.03 | 0.08 | 0.20 | 0.02 | 0.03 | nd |
*µ o = 0.01 (d-1) is assumed for µ o:µ n and PP estimates
nd = no data
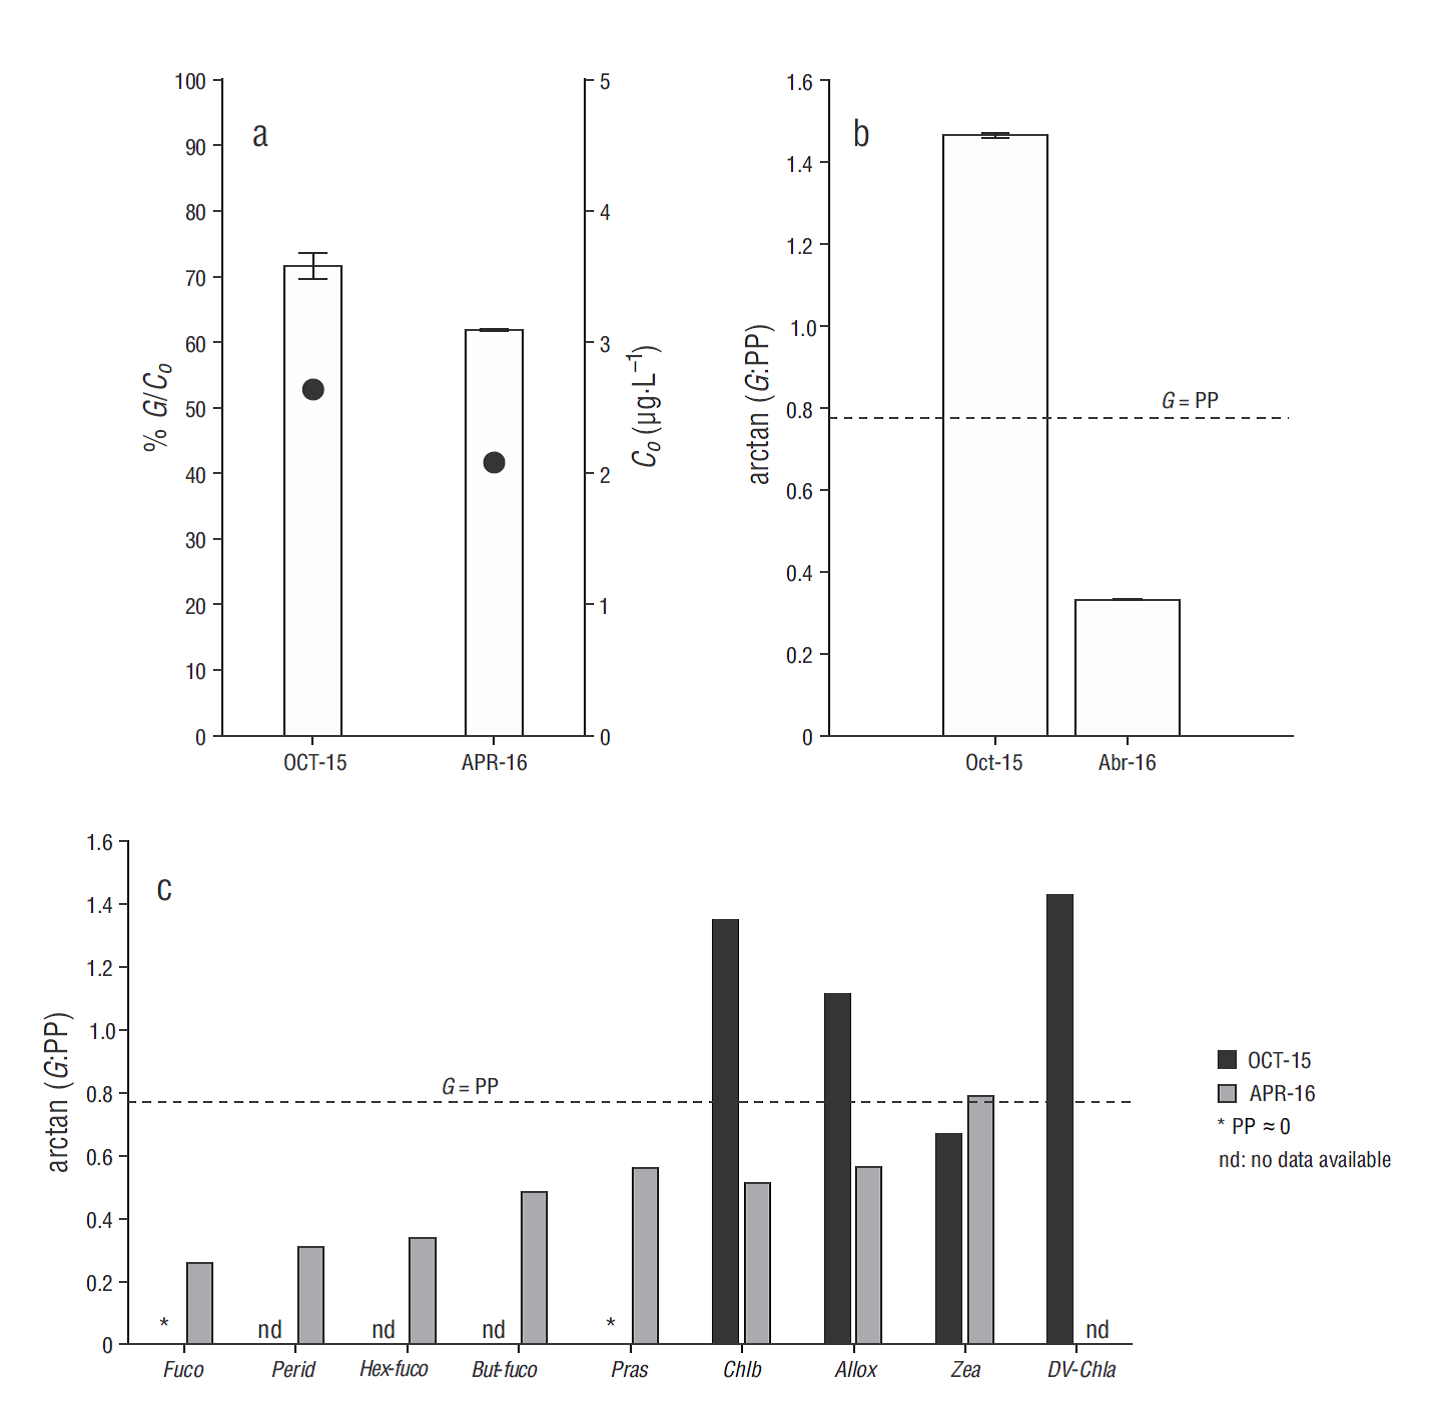
Figure 5 Microzooplankton grazing impact in October 2015 (OCT-15) and April 2016 (APR-16) on (a) phytoplankton biomass (bars, left y axis), estimated as the initial chlorophyll a concentration (C o) (filled circles, right y axis); (b) daily primary production (PP) of the phytoplankton community; and (c) daily PP of specific phytoplankton groups associated with specific pigments such as diatoms (fucoxanthin: Fuco), dinoflagellates (peridinin: Perid), prymnesiophytes (19'-hexanoyloxyfucoxanthin: Hex-Fuco), pelagophytes (19'-butanoyloxyfucoxanthin: But-Fuco), prasinophytes (prasinoxanthin: Pras), green algae (Chlorophyll b: Chlb), cryptophytes (alloxanthin: Allox), cyanobacteria (Zeaxanthin: Zea), and Prochlorocccus spp. (Divinyl chlorophyll a: DV-Chla). Dashed line indicates G is equal to the PP value
Discussion
This study was conducted in a coastal upwelling system (ENSENADA station) that is representative of the physico-chemical conditions off northern Baja California (<50 km). The system is characterized as a CCS transition zone because it is influenced by arctic waters from the north and tropical/ subtropical waters from the south (Linacre et al. 2010b). Historical analysis of temperature and salinity records indicate that the ENSENADA station reflects seasonal changes in the water column hydrography of this CCS region, which are associated with coastal upwelling events (frequent and intense in spring-summer) and with the mesoscale circulation activity in summer, autumn, and winter. The ENSENADA station is also a site that is susceptible to interannual events, such as La Niña 2007-2008 (Linacre et al. 2010b).
During the present study, 2 anomalous warming events were observed in CCS waters: “The warm Blob” 2013-2015 (Cavole et al. 2016) and El Niño 2015-2016 (Jacox et al. 2016). Both events apparently influenced the thermohaline conditions in the upper layer of the water column (<100 m), mainly in OCT-15, when warmer (~3-4 ºC) and more saline (~0.1) waters than expected in a climatological autumn (data not shown) were observed at this coastal site. These observations are consistent with the temperature and salinity anomalies recorded in northern Baja California by the IMECOCAL program (Durazo et al. 2017). During APR- 16, the temperature and salinity profiles show an apparent return to spring conditions in this coastal upwelling system and, although to a lesser extent, this recovery was also evident towards more oceanic northern Baja California areas.
Under this environmental context of interannual variabilityand partly seasonal variability-significant differences in hydrographic conditions were observed in this study. These differences likely influenced not only nutrient availability for phytoplankton in the euphotic zone (McClatchie et al. 2016, Zaba and Rudnick 2016) but also the contrasts observed in phytoplankton growth rates (µ) and, consequently, in daily community PP (based on Chla) and taxon-specific PP (based on specific pigments) between OCT-15 and APR-16. Since no information on nutrient concentrations was available for this study, reference nitrate levels reported for the CalCOFI region in the CCS were considered. In this region, during 2015-2016, average nitrate values in the mixed layer were low, and the thermocline was unusually deeper, in comparison with the previous 15 years, because of marked stratification in the upper 100 m of the water column (McClatchie et al. 2016). The low availability of inorganic nutrients in the CCS led to low Chla concentrations in 2015, due to moderate upwelling events and El Niño 2015-2016, particularly in the southern California coastal area. For the northern IMECOCAL region, which is near the study area, negative anomalies of integrated Chla over the upper 100 m were reported in the system during autumn 2015. By April 2016, Chla concentrations apparently returned to levels close to the climatological average (McClatchie et al. 2016). According to these reports, the low temperatures (<14 ºC) recorded in the euphotic zone at the study area in APR-16 may indicate upwelling of cold nutrientrich subsurface water, once the system returned to its normal conditions (Durazo et al. 2017). The dominance of diatoms in APR-16 might be an indication of this nutrient enrichment by upwelling, since vertical turbulence increases the proportion of larger cells in the illuminated layer (Rodríguez et al. 2001, Linacre et al. 2012). The higher surface temperatures (>20 ºC) with a stronger vertical gradient and the deeper thermocline in OCT-15 could be associated not only with El Niño 2015-2016 but also with a seasonal cyclonic recirculation of the California Current, mainly in summer, autumn, and winter, when an eastward flow brings oligotrophic ocean waters towards the coast (Linacre et al. 2010b). Thus, smaller planktonic cells that grow efficiently in low-nutrient environments could be carried to nearshore waters (Linacre et al. 2010a). In fact, in OCT-15 the growth of larger cells, such as diatoms (µ o-Fuco :µ n-Fuco < 1), was severely limited. Furthermore, dominance of nanoflagellates and picophytoplankton was inferred from the high concentrations of Zea and the presence of DV-Chla, which are pigments that are characteristic of Synechococcus and specific for Prochlorococcus, respectively (Fig. 4a, Table 2).
Another factor that probably influenced the temporal contrasts in PP could be related to the trophic response of microplanktonic consumers. Previous studies conducted at the site (Linacre et al. 2012) have shown that, under contrasting oceanographic conditions, there is a complementary coupling of microplankton consumers in terms of community structure (relative abundance, size, and composition) with the seasonal changes of their prey (ranging from bacteria to large diatoms), in response to the trophic dynamics that allows efficient carbon recycling within the euphotic zone. In OCT-15, the increased consumption of prey- mainly nano/picophytoplankton - was seemingly associated with the larger fraction of mixotrophic and heterotrophic dinoflagellates (e.g., Gyrodinium and Gymnodinium) observed at this coastal site during the warmer conditions, which have been described as a major component of microzooplankton and active diatom grazers (Sherr and Sherr 2007). In addition, many of the dinoflagellates previously thought to be exclusively autotrophic have been reclassified as mixotrophic, because they feed on diverse types and sizes of prey, suggesting a new ecological insight by their significant role as phagotrophic in microplankton food webs (Jeong et al. 2010) . In APR-16, a lower impact on PP was observed, likely due to the type and size of potential predators (ciliates) and the relative dominance of certain autotrophic prey (diatoms). Although ciliates have been reported as active microplankton consumers of whole chains and solitary diatom cells in coastal systems (Aberle et al. 2007, Teixeira et al. 2011, Linacre et al. 2012), the relative abundance of this group (average ~60%) or the size of its components (nanoplankton) in APR-16 were likely not important enough to significantly limit the dominant diatom group. This is suggested by the minor grazing impact on diatom PP, unlike the greater grazing pressure on cyanobacteria during both seasons (Fig. 5c). The large loss rate of picoplankton cells observed in this study seems to be a trophic pattern that occurs throughout the year in coastal upwelling ecosystems (Linacre et al. 2010a, Teixeira et al. 2011).
The effects of the anomalous warming period from 2014 to early 2016 on the CCS pelagic ecosystem have already been evidenced by the decrease in biomass and PP, especially in coastal areas (McClatchie et al. 2016, Gómez-Ocampo et al. 2017). Apparently, these effects were also reflected in the ENSENADA station, as indicated by the 2- to 30-fold decrease in the abundance of nano- and microphytoplankton relative to previous records for 2007-2008 (data not published) and by the growth and mortality dynamics controlled by microzooplankton grazing (Table 1). In this regard, Table 1 shows a comparison of the experimental rates observed during this study (OCT-15 and APR-16) and those estimated from previous cruises in autumn (NOV-07-NOV-08) and spring (APR-08) at the same coastal site. Although OCT-15 yielded the highest phytoplankton biomass of the 3 autumns, µ o values are ~2-4 times lower, µ n ~1.5-3 times higher, and m ~ 2-9 times higher than estimates for autumn 2007 and autumn 2008 (Table 1). In APR-16, when a lower initial Chla value was observed, the low µ o and µ n rates were almost 2-fold and m was similar to the values recorded in spring 2008, a typical year of the cold conditions of La Niña 2007-2008.
The results of this study indicate that the effects of the sequence of warm events (“The warm Blob” 2013-2015 and El Niño 2015-2016) in this CCS coastal region were most evident in OCT-15, when growth of the phytoplankton community, particularly the growth of larger components such as diatoms, was severely restricted. This occurred not only because of the limitation of nutrients caused by the increased supply of warm water and the sinking of the thermocline/ nutricline, but also because of the strong impact of microzooplankton grazing, which actively consumed phytoplankton biomass (72%) and PP (>100%), even when a greater seasonal grazing impact was expected in autumn (e.g., NOV-08, Table 1). The maximum PP value recorded in APR- 16, compared to other seasons (Table 1), could reflect the environmental recovery of this coastal ecosystem during the spring of 2016.

