


 nova página do texto(beta)
 Inglês (pdf)
 Artigo em XML
 Referências do artigo
 Enviar este artigo por email
 Citado por SciELO
  Similares em
SciELO
Similares em
SciELO 
 Permalink
Introduction
A large portion of the variability that occurs in the transition zone of the California Current System is associated with interannual events. This transition zone is defined as the area off the Baja California Peninsula where the relatively cold and low-salinity water of the California Current meets warmer and more saline tropical and subtropical waters. Interannual variability affects the physical properties and ecosystem processes in the area. During warm events (e.g., El Niño), the positive temperature anomalies detected in the equatorial region were also detected off the peninsula. The connectivity results from the modification of local atmospheric processes due to atmospheric teleconnections and the propagation of remote signals across the ocean (Frischknecht et al. 2017). In addition to positive temperature anomalies, the responses of the ocean to warm events in the transition zone include increased salinity, deepening of the thermocline and nutricline (Durazo and Baumgartner 2002, Zaba and Rudnick 2016), decreased chlorophyll concentrations (Espinosa-Carreon et al. 2004), and regional changes in species composition of marine zooplankton (Cavole et al. 2016). Some of these changes are related to the reduction of heat exchange between the ocean and the atmosphere (Bond et al. 2015, Jacox et al. 2016) or to the weakening of alongshore winds that favors the advection of tropical and subtropical waters from the south, off the Baja California peninsula, due to a poleward coastal flow (Durazo 2009).
During cold interannual events (e.g., La Niña) oceanic conditions generally contrast those observed during warm events. When a La Niña event occurs, the eastern Pacific high atmospheric pressure center intensifies, leading to stronger alongshore winds that promote coastal upwelling. As a result, offshore Ekman transport increases, upwelling of nutrientrich subsurface waters intensifies, and chlorophyll concentration increases (Espinosa-Carreon et al. 2004, Gaxiola-Castro et al. 2008). During La Niña, water temperature in the region is lower than average and salinity is higher due to the higher input of more saline subsurface waters (~50-70 m). However, a more intense transport of subarctic waters also takes place, contributing water of lower salinity that predominates over the newly upwelled water (Bjorkstedt et al. 2011). In addition, zooplankton communities are dominated by temperate species during La Niña (Linacre 2004).
An unusual event that occurred recently (2013-2016) was the anomalous rise in temperature in the upper layer of the northeast Pacific caused by a decreased cooling of the ocean surface and weaker winds (Bond et al. 2015, Gentemann et al. 2017). These warmer temperatures were first detected in the subpolar coastal region, and within a few months spread down to the region off California and Baja California. Due to the rapid spatial expansion and the dimensions of the warm water mass, this phenomenon was named “The Blob”, after a science fiction movie. By mid-2015, the thermal anomalies stretched across a broad area in the northeastern Pacific, and early signs of an El Niño event were observed in the California Current System in August 2015 (Cavole et al. 2016). Due to the transition from the preexisting warm conditions associated with the Blob, El Niño was expected to be a major event and was thus described as “El Niño Godzilla,” after another science fiction movie. This unusual coincidence of the 2 warm events raised considerable uncertainty about the potential effects on climate at a regional scale.
The anomalous conditions accompanying the successive warm events (the Blob and El Niño Godzilla) resulted in major changes in the hydrographic and trophic conditions in the California Current System (Leising et al. 2015, McClatchie et al. 2016) . Although some of these effects have already been described in the literature (Zaba and Rudnick 2016, Gómez-Ocampo et al. 2017), a detailed description of changes that occurred at a regional level is still missing. In this paper, the hydrographic conditions off the northwestern coast of the Baja California peninsula are analyzed, particularly at Todos Santos Bay and nearby waters, to characterize the response of the region to such events. In addition, evidence from satellite data was analyzed to explore the effect of remote forcings on local coastal waters.
Materials and methods
As part of the field surveys organized for students by the Faculty of Marine Sciences at the Autonomous University of Baja California (UABC, for its acronym in Spanish), 3-day oceanographic cruises are conducted on board Mexican Navy ships. Two cruises are conducted per year, typically in March and September (spring and fall). Onboard activities include performing routine vertical casts to measure conductivity, temperature, and hydrostatic pressure along 3 transects from the inner part of the bay toward the California Current System domain (Fig. 1a) . Between September 2010 and March 2013, measurements were made with a factory-calibrated Seabird SBE19Plus v2 CTD from the surface down to a few meters above the sea floor. A handheld CastAway-CTD instrument was used between March 2014 and April 2017 to take readings between the surface and ~80 m depth. Typically, the Seabird CTD records temperature, conductivity, and pressure with accuracy of ±0.005 ºC, ±0.0005 S m-1, and ±0.1% in the 0-600 m scale, respectively. The CastAway instrument measures these same parameters with ±0.05 ºC, ±0.05 S m-1, and ±0.25% accuracy, respectively. The data collected with the latter instrument showed discrepancies (0.2 g kg-1) in salinity values, so correction was done by comparing data with measurements obtained from water samples that were collected in bottles and analyzed at the laboratory with a Guildline Autosal 8400B salinometer (±0.002 accuracy). For this work, we analyzed data collected from a total of 260 vertical casts carried out during 12 oceanographic cruises.
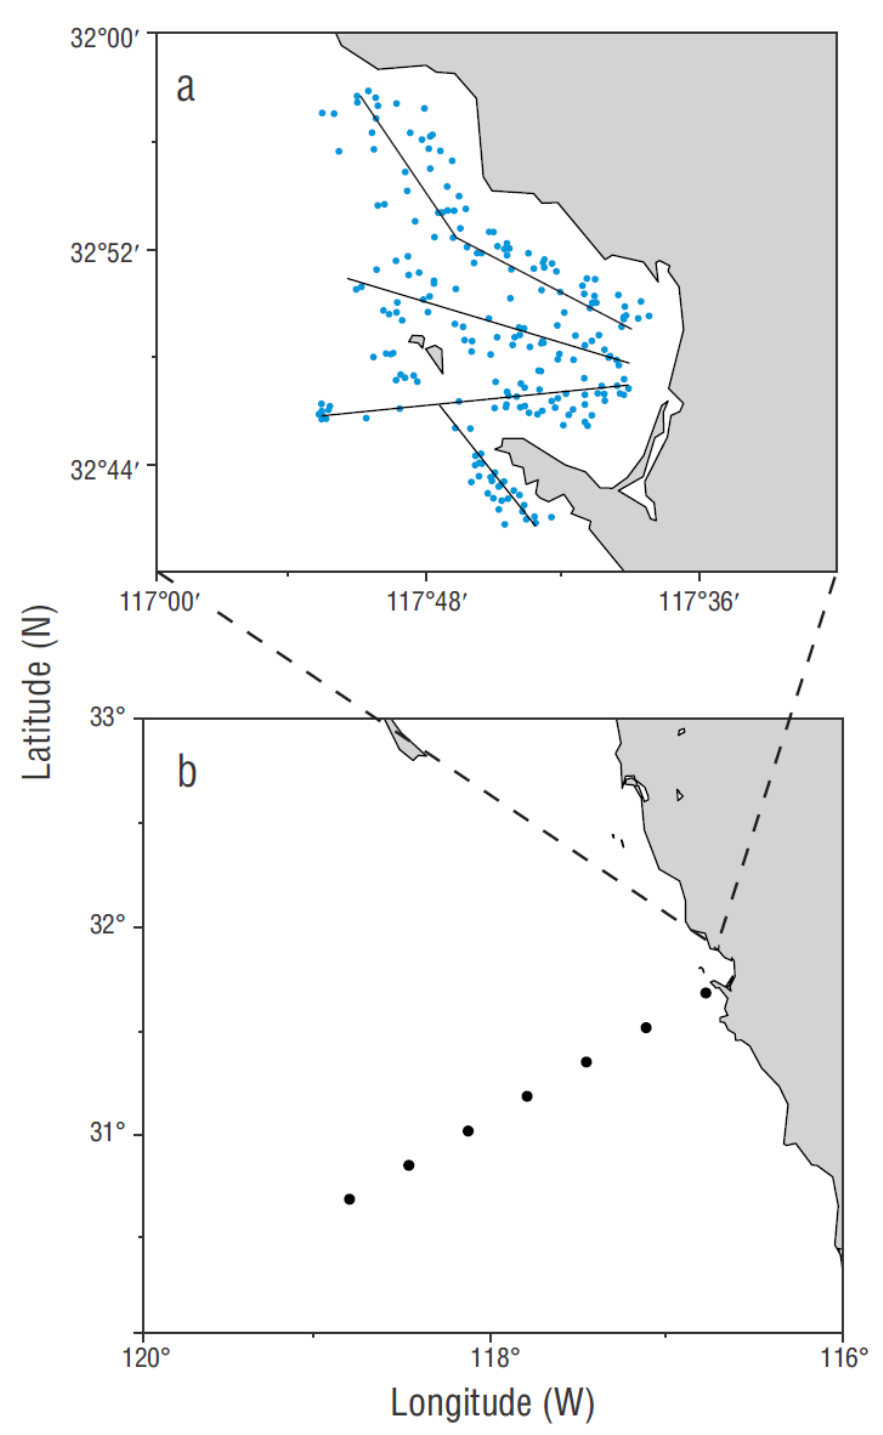
Figure 1 Map of the study area where CTD measurements were recorded: (a) location of the stations at Todos Santos Bay, Baja California (Mexico), occupied between 2010 and 2016, approximately defined by the 3 superimposed lines; (b) location of the hydrographic stations (filled circles) along line 100 of the IMECOCAL program.
In addition to data gathered from the oceanographic cruises, data recorded off the bay by the Investigaciones Mexicanas de la Corriente de California program (Mexican Research Program of the California Current; IMECOCAL, for its acronym in Spanish) were also used. The data considered for this work corresponded to information obtained from 55 vertical casts performed at 7 hydrographic stations along line 100 of the program (Fig. 1b). In total, data from 7 cruises were analyzed: January and April 2013 (1301 and 1304), July and October 2014 (1407 and 1410), October 2015 (1510), and January and April 2016 (1601 and 1604). These readings were recorded on board the Francisco de Ulloa and Alpha Helix research vessels. A factory-calibrated Seabird 911Plus CTD was used in all cruises. In order to identify temperature and salinity anomalies along line 100, measured data were contrasted with the long-term (1997-2016) climatology obtained using a harmonic fit with the annual signal (Emery and Thomson 2001).
Analysis of in-situ data was supplemented by using daily sea level data obtained from satellite altimetry for the 1992- 2016 period. The data corresponded to absolute Dynamic topography mapped on a grid with a 0.25º (~25 km) spatial resolution from the Copernicus Marine Environment Monitoring Service of the European Commision (http://marine.copernicus.eu).
Results
Variability in hydrographic conditions, both in Todos Santos Bay and along IMECOCAL line 100, is depicted as average temperature-salinity (T-S) curves per cruise (Fig. 2). At Todos Santos Bay, hydrographic conditions in March (Fig. 2a) showed slight fluctuations in salinity but relatively constant temperatures, with no noticeable effects of warm interannual events. Salinity, which does not necessarily respond to interannual events (Bjorkstedt et al. 2011), showed a transition from low average salinity values (<33.5) in the surface layer (σθ < 26 kg m-3) during 2011 to ~33.7 in 2014. The low salinity values observed during 2011 apparently resulted from the intensification of the California Current, which carried a larger volume of subarctic water (Bjorkstedt et al. 2011). The higher salinity values recorded in 2014 were likely related to the Blob because of the increased transport of waters from the south or because of a change in the evaporation rates at the air-sea interface (Bond et al. 2015, Leising et al. 2015). The rest of the samples for March showed very similar average curves, including the data from 2015, when the Blob displayed its peak influence at the regional level.
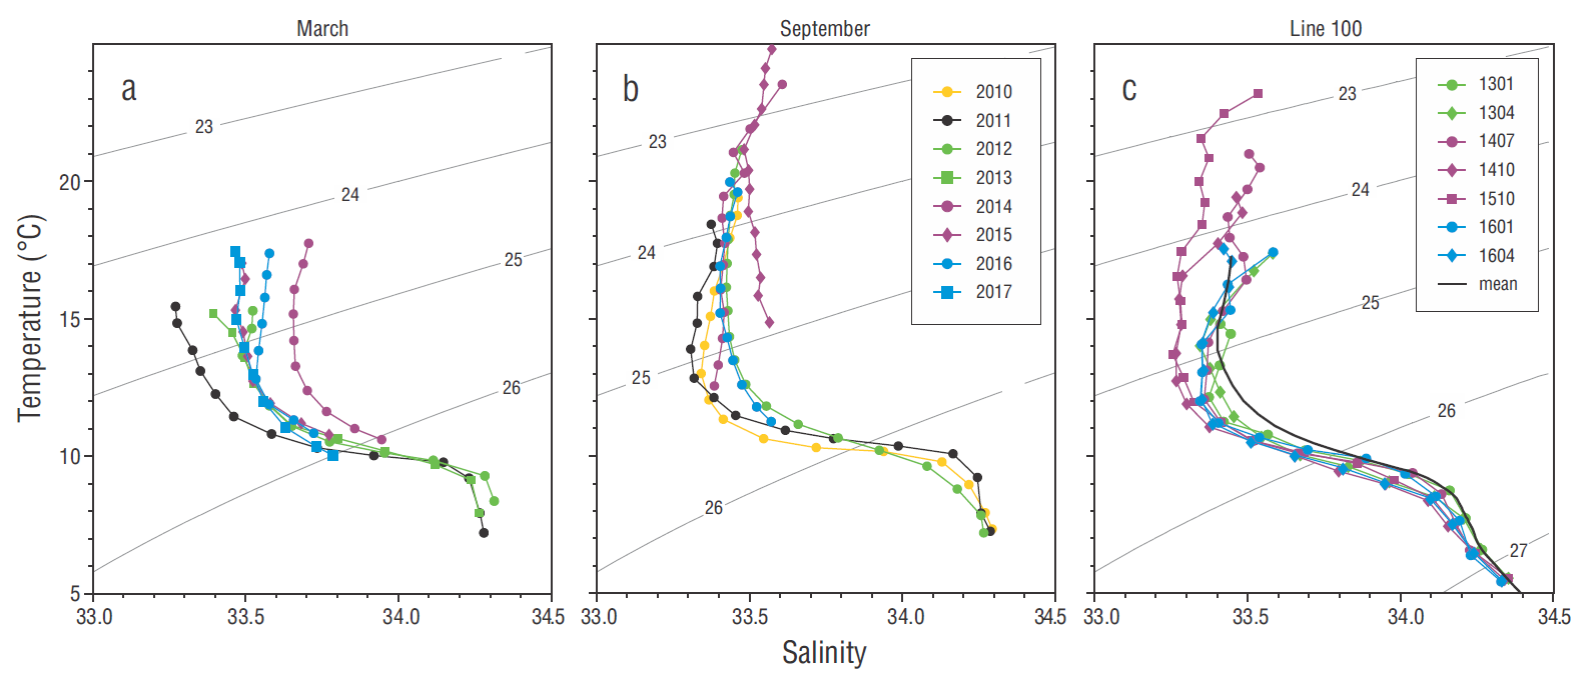
Figure 2 Average temperature-salinity curves for each survey conducted at Todos Santos Bay in March (a) and September (b) from 2010 to 2017, and average curves for each oceanographic cruise conducted along IMECOCAL line 100 (c). The black line in (c) depicts the long-term mean obtained from data recorded by the program between 1998 and 2016. Contours indicate density anomaly (kg m-3) relative to the surface.
Unlike the spring T-S curves, average curves for September show relatively homogeneous salinity (33.3-33.5) and relatively high temperature values in the upper layer (Fig. 2b). The average curves for September 2014 and September 2015 are worth noting, with average sea surface temperatures of up to 23 and 25 ºC, respectively. Before the September 2014 cruise and after September 2015, the curves per cruise indicate that relatively normal conditions persisted, with maximum sea surface temperatures of ~20 ºC. The extreme temperature values observed in 2014 and 2015 are a clear response to interannual events: the Blob in 2014 and El Niño in the second half of 2015.
The outside of Todos Santos Bay (line 100), which includes the California Current domain, also showed evidence of the alternation of events (Fig. 2c). The average T-S curves per cruise show salinity values below the climatological mean around the relative subsurface minimum located in the σθ ~ 25.0-25.4 kg m-3 isopycnal range. At depths above and below this range, the curves show profiles very similar to the long-term mean (1998-2016). Exceptions were the curves for July 2014 (1407), October 2014 (1410), and October 2015 (1510), when mean sea surface temperature was higher than average. The observed maximum average temperatures were ~20, ~21 and 23 ºC for October 2014, July 2014, and September 2015, respectively.
The time evolution of temperature anomalies along line 100 showed conditions close to the climatological mean for 2013 (cruises 1301 and 1304), with anomalies around zero in the upper layer of the water column (0-300 m, Fig. 3). The positive slope of the σ θ = 25.2 kg m-3 isopycnal in both cruises revealed coastal upwelling, which was more intense in April. In this same month, the effect of coastal upwelling is reflected in the positive slope of the σθ = 26.3 kg m-3 isopycnal. Similarly, salinity anomalies were within the normal range, with slightly positive anomalies (~0.2) in the first 50 m and negative anomalies (-0.1 to -0.2) at greater depths.
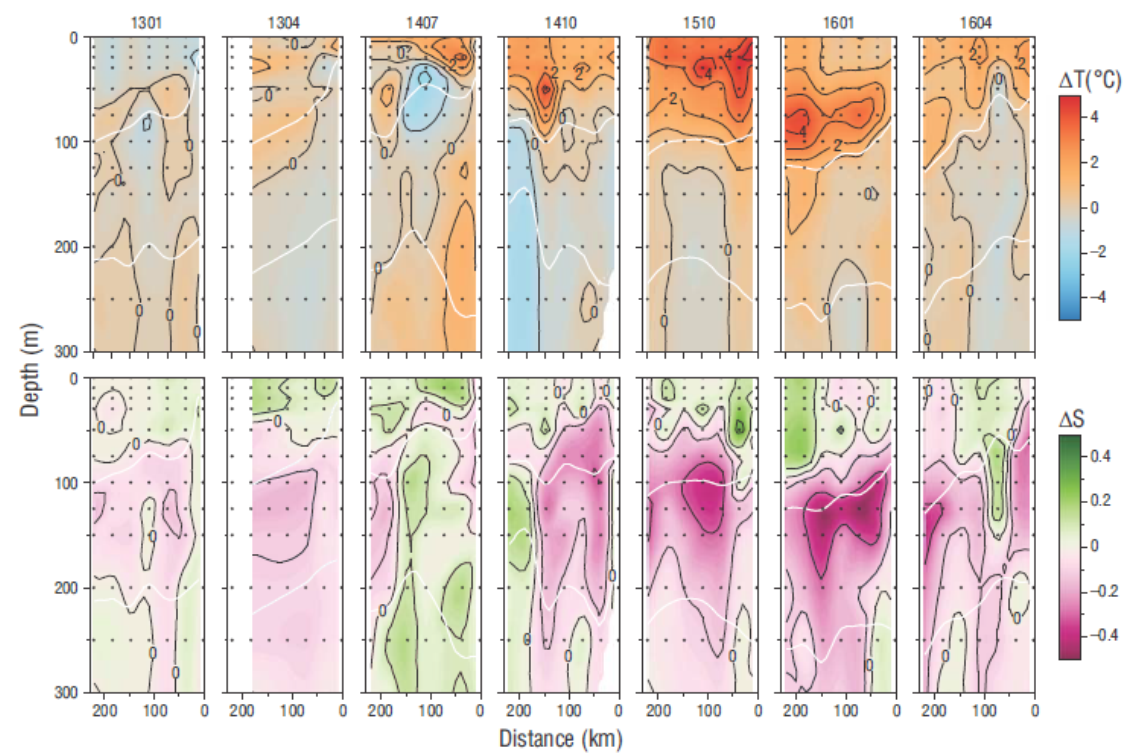
Figure 3 Temperature (ºC, above) and salinity (below) anomalies calculated for each oceanographic cruise conducted along IMECOCAL line 100 between 2013 and 2016. White contours represent the isopycnal surfaces of σθ = 25.2 kg m-3 and σθ = 26.3 kg m-3, corresponding to the upper limit of the California Current core and the location of California Undercurrent core, respectively. The contour intervals for temperature and salinity are 1 ºC and 0.2, respectively. Distance is relative to the station nearest to the coast. Dots indicate standard depths at each station.
The effect of warm events was evident in July 2014 (1407), with positive temperature anomalies (up to 3 ºC) in the upper 50 m of the water column close to the coast. The σθ = 25.2 kg m-3 isopycnal had a small positive slope throughout virtually the entire section. Anomalies were close to zero between 50 and 200 m depth but became positive again at greater depths or near the coast where the core of the California Undercurrent flows (Durazo 2015), as indicated by the negative slope of the σθ = 26.3 kg m-3 surface toward the coast. In general, the distribution of positive salinity anomalies during this cruise was similar to that of the positive temperature anomalies, with positive salinity anomalies at the same depths where temperature was higher than average.
The effects of the Blob and El Niño were clearly visible in the temperature and salinity anomaly sections for October 2014 and 2015 (cruises 1410 and 1510, respectively) and January 2016 (1601) (Fig. 3). During cruise 1410, the effects of warming were evident at greater depths (80-90 m) and in the null slope of the σθ = 25.2 kg m-3 isopycnal surface, as well as in the increase in spatial coverage (almost the entire section) and magnitude of temperature anomalies (up to 4 ºC). In the case of salinity, slightly positive anomalies remained within the surface layer (0-50 m), while negative anomalies occurred between 50 and 300 m depth within the first 200 km off the coast. These negative anomalies were apparently related to the deepening of the California Current, as suggested by the vertical position of the σθ = 25.2 kg m-3 isopycnal. For October 2015 (cruise 1510), the same isopycnal that borders the California Current maintained a zero slope and sank even deeper (up to 100 m) relative to the observations from previous cruises, with positive temperature anomalies (maxima greater than 5 ºC) across virtually the entire surface layer between 0 and 300 m depth. The σθ = 26.3 kg m-3 isopycnal also reached greater depths, with a negative slope close to the coast indicating a poleward flow of the California Undercurrent. Salinity showed the same distribution of negative anomalies as that observed for data from cruise 1410 the previous year, but with even greater magnitudes (>0.4) between 100 and 125 m depth, from the coast to approximately 250 km offshore. The anomaly fields and distribution of isopycnals for October 2015 remained the same for January 2016. On the latter date, the maximum temperature anomaly was similar to that observed in October 2015, though it was located below the surface between 50 and 70 m depth. The corresponding isopycnals sank even more, down to 125 and 225 m depth for σθ = 25.2 kg m-3 and σθ = 26.3 kg m-3, respectively. This deepening of isopycnals was also evident in the position of the maximum salinity anomaly below 100 m resulting from the deepening of the California Current core.
The reappearance of normal conditions was observed in the smaller temperature anomalies in April 2016 (Fig. 3, cruise 1604), with a maximum of approximately 2 ºC. Although the system did not attain full recovery on this date compared with April 2013, isopycnals showed a shallower position and a positive slope. As for salinity, values were either within the normal range or slightly positive in the first 100 m, with persistent negative anomalies (although of lesser magnitude) below 100 m depth.
Discussion
This study showed the effects of the sequence of events, from the Blob to El Niño, on the hydrographic features off the northwestern coast of the Baja California peninsula, Mexico, using data collected during oceanographic cruises conducted at Todos Santos Bay and along line 100 of the IMECOCAL program. In the bay, data revealed differences in hydrography between March and September, in response to interannual events. In March, the average T-S curve, with lower salinity values, corresponded to data obtained under a cold La Niña event in 2011. The lower salinity values were likely associated with an increased transport of subarctic water from the California Current, as documented for other regions of the California Current System (Bjorkstedt et al. 2011). Peak salinity values were associated with the anomalous warming due to the Blob. The factors that may have led to increased salinity values during this event are the anomalous advection of tropical and subtropical waters associated with coastal poleward flows, and the higher evaporation rate at the interface. Although there are insufficient elements to assess the relative importance of the latter, previous studies (e.g., Zaba and Rudnick 2016) showed that at the regional level, within the California Current System, salinity increase was partly due to the changes in air- sea exchange rates and wind weakening. The present study assessed the potential existence of coastal poleward flows based on sea-level data.
The effects of the Blob and El Niño warm events on average temperature in the upper layer of the water column (σθ < 26 kg m-3) became evident only in September of all years, not in March. This difference suggests that in spring, coastal upwelling may be more important than the effects of remote signal propagations. With stronger, more persistent winds during spring, remote signals can be masked by local forcings and reduce the effects on hydrography at a broader timescale, as noted in the bay. This also seemed to be the case for the outer part of the bay during spring 2016, given the rapid recovery of the system as of January. This observation is consistent with observations recorded off California (Gentemann et al. 2017) and with the results of numerical models that attribute the initial forcing of a warm event to the propagation of signals from the equator and the decline of the event to the relative influence of local forcings (Frischknecht et al. 2017). Remote forcings exerted considerable influence on hydrography in September. During this time of the year, although winds promote upwelling, they are less intense and upwelling rates are lower than in spring. Therefore, under these conditions, the combination of processes (weak along-shore winds, remote signals) can uphold the observed anomalies, as suggested by Frischknecht et al. (2017), so that remote oceanic forcing prevails over local effects.
The data on temperature and salinity anomalies in the upper 300 m along line 100 (Fig. 3) indicated that the succession of events from The Blob to El Niño prompted major effects. This succession was unusual since anomalous abnormal conditions preceded El Niño due to the warming in the northeastern Pacific region. This sequence of events prompted considerable changes at 100-150 m depth, especially in September 2015, when positive temperature anomalies of up to 5 ºC were observed along with the deepening of the California Current core-typically located between 30 and 50 m depth (Durazo 2015)-to between 100 and 150 m depth. This deepening occurred because the relatively cold California Current (σθ ~ 25.4 kg m-3) seeks an isopycnal balance below warmer and less dense water. The peak anomalies observed in September 2015 are consistent with the maximum anomaly reported for southern California based on the analysis of satellite images of sea surface temperature (Gentemann et al. 2017).
The presence of water with higher temperature and salinity during the Blob and El Niño could have resulted from the advection of tropical and subtropical waters. To further explore this hypothesis, anomalies of sea surface absolute dynamic topography for September 2013, 2014 and 2015 were calculated relative to the long-term monthly climatological mean (1992-2016) (Fig. 4). In accordance with the average T-S curves and the anomalous hydrographic conditions described above, maps of anomalies and geostrophic currents associated with spatial gradients of sea level revealed that conditions were nearly average in September 2013 (Fig. 4a). However, in September 2014 (Fig. 4b), anomalies become positive throughout the region off Baja California, particularly in the coastal region. This was even more evident in September 2015 (Fig. 4c). The existence of peak positive anomalies near the coast implies a positive (west-east) slope at the surface, suggesting a geostrophic surface poleward current along the coast. This is clearly marked by the geostrophic current vectors superimposed on anomaly maps for September 2014 and 2015, and reveals that advection of tropical waters occurred in 2014 and 2015 as a surface countercurrent that influenced the hydrographic conditions observed in the study area. This pattern is very similar to the spatial field of the first mode of empirical orthogonal functions that reproduces the interannual variability, which was applied to the monthly maps of absolute dynamic topography anomalies (not shown).
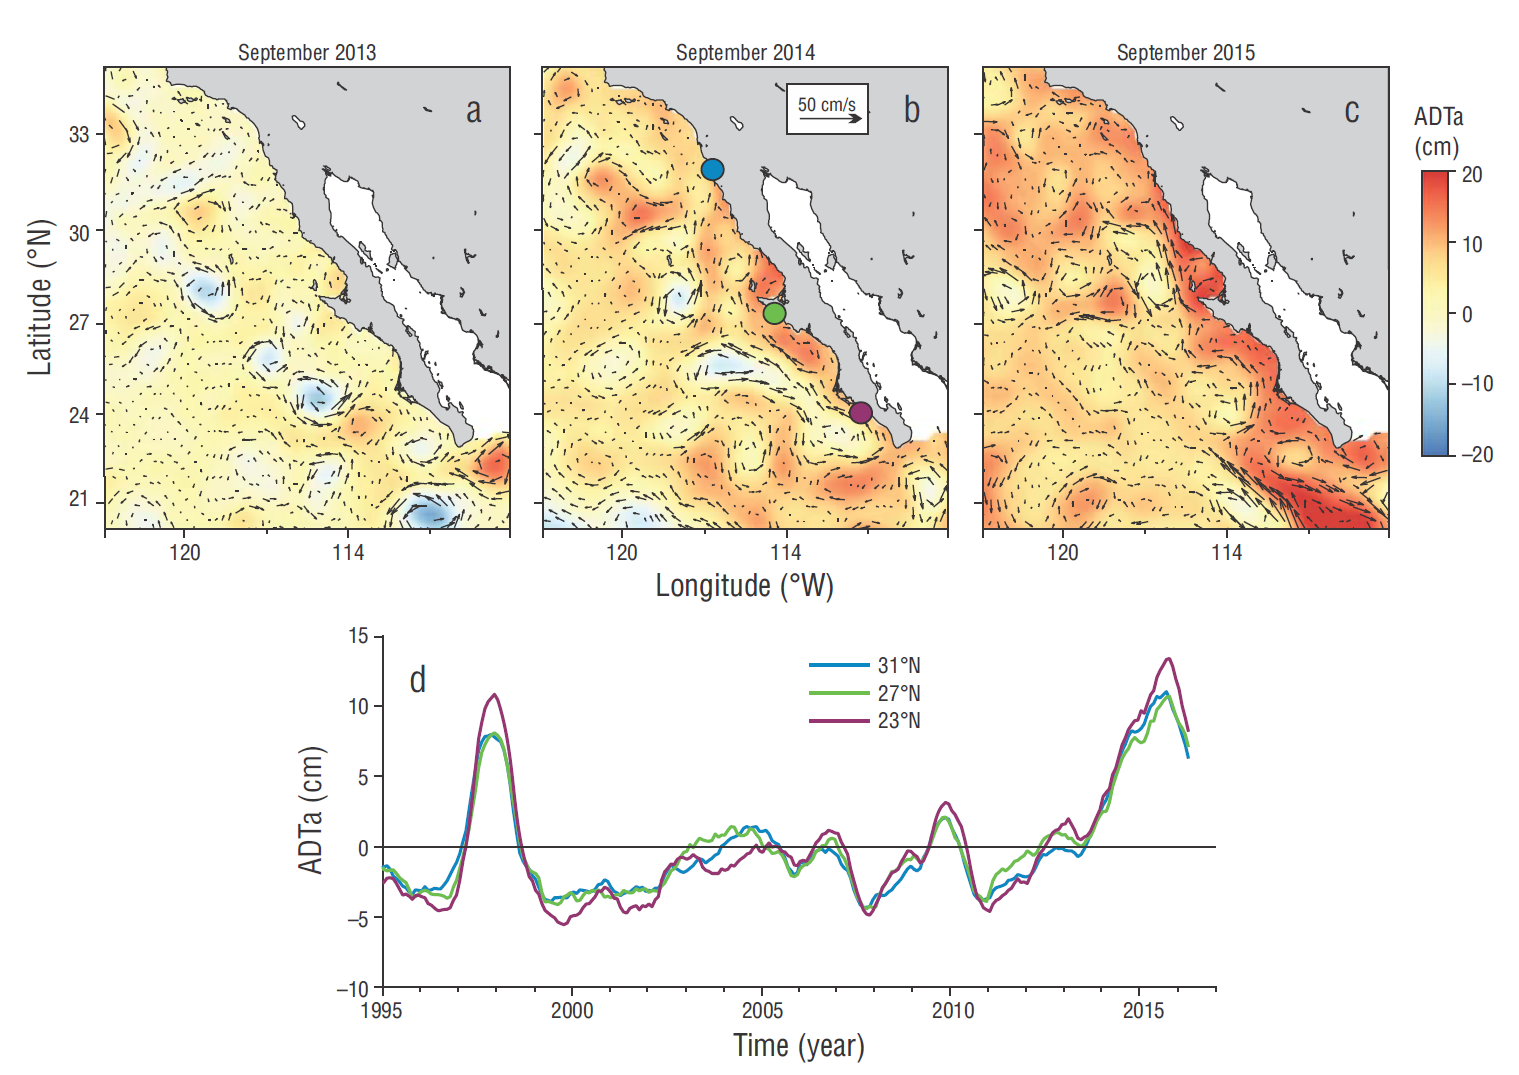
Figure 4 Maps of absolute dynamic topography anomaly (ADTa, cm) for September 2013 (a), 2014 (b), and 2015 (c). Vectors indicate geostrophic currents associated with horizontal sea level gradients. (d) Temporal variation of the average anomaly (cm) in the 3 coastal regions indicated as colored circles in (b).
It is important to analyze not only the spatial distribution of anomalies that allows understanding of coastal dynamics, but also the temporal evolution. To summarize this analysis, the temporal evolution of the dynamic topography anomaly was examined in 3 coastal regions along the coast of the Baja California peninsula, at 24ºN, 28ºN and 32ºN (Fig. 4d). These latitudes coincide more or less with the eastern end of 3 IMECOCAL cardinal lines, namely lines 150, 120 and 100, respectively (Fig. 4b). For each region of approximately 80 × 80 km, the average absolute dynamic topography anomaly was obtained with a monthly temporal resolution. The temporal evolution in the 3 sites is spatially consistent, since sea surface varies in phase at the 3 locations in response to interannual events. In general, sea surface topography shows larger anomalies to the south (24ºN) relative to the central and northern regions of the peninsula. Other important aspects also emerged from these time series. The negative anomalies observed in 1999-2003, 2008 and 2011 are indicative of La Niña events and imply a greater offshore Ekman transport and a higher coastal upwelling rate. Positive anomalies indicate warm events. During El Niño 1997-1998, the coastal ocean responded with a sea level rise of about 10 cm above the climatological mean, while in other El Niño events, such as the 2007 and 2010 events, sea -level rise was relatively modest (~2 cm). The maximum magnitude of these anomalies (~12-14 cm) occurred during the succession from the Blob to El Niño. This peak was the culmination of a process that started in 2011 as a recovery from La Niña, and the anomalous warming that lasted until the winter of 2015- 2016.
In summary, positive coastal anomalies resulting from warm events promote a positive zonal slope that implies a near surface poleward coastal countercurrent and the advection of tropical and subtropical waters, which in turn influence the hydrographic conditions in the northwestern coastal region of the Baja California Peninsula. These coastal flows are expected to intensify under extreme conditions such as observed in 1997-1998 or in the succession of warm events between 2013 and 2016. At the local level (i.e., in Todos Santos Bay) the local forcings seem to play a key role, at least during the upwelling season, by masking the contributions of the interannual pulses. The effects of this type of local variability and adaptability to the various trophic levels of the ecosystem merit further research.

