


 text new page (beta)
 English (pdf)
 Article in xml format
 Article references
 Send this article by e-mail
 Cited by SciELO
  Similars in
SciELO
Similars in
SciELO 
 Permalink
Introduction
Understanding the spatiotemporal patterns of gene flow among isolated populations has long been a major focus in ecology (Spaet et al. 2015). Sharks are likely to display different patterns of population structure. Low levels of intraspecific genetic differentiation have been detected mainly in highly migrant pelagic species (e.g., Rhincodon typus) across large ocean basins (Vignaud et al. 2014), while high levels of population structure have been detected mainly in demersal species (e.g., Stegostoma fasciatum) on relatively small geographic scales (Dudgeon et al. 2009). Absence of population structure was detected for the deep-water Centroscymnus coelolepis (Veríssimo et al. 2011), whereas almost global panmixia was found for Cetorhinus maximus (Hoelzel et al. 2006). These population patterns are commonly promoted by geographic barriers or dispersal, or can be influenced by environmental gradients throughout continuous areas (Spaet et al. 2015).
Knowing the processes that affect genetic diversity and population structure is crucial for the conservation of exploited species (Arenas et al. 2012). Overfishing can decrease genetic variation through bottlenecks, cause loss of genetically unique stocks, select for early sexual maturation, and ultimately reduce the adaptability of wild populations (Hutchings and Reynolds 2004). Understanding population structure and connectivity of marine resources is an essential prerequisite for devising effective fishery management strategies in at least 2 critical ways: (i) the delineation of an appropriate spatial scale for management and (ii) the specification of subareas, nested within broader management units, that must be protected from exploitation (Fogarty and Botsford 2007, Hilário et al. 2015).
The Pacific angel shark, Squatina californica Ayres 1859, is a demersal shark found off the coast of North America, from Alaska to the Gulf of California, where it is associated with soft-bottom habitats (Compagno et al. 2005). It is a lecithotrophic viviparous shark that has low fecundity (10 embryos per year), with gestation lasting 10 months (Compagno et al. 2005, Romero-Caicedo et al. 2016). This species is frequently targeted by the artisanal elasmobranch fishery along the norwestern coast of Mexico (Villavicencio-Garayzar 1996, Ramírez-Amaro et al. 2013) . The population trend remains unknown, but reported landing data (2003-2015) from Baja California (Mexico) suggest population decline (Ramírez-Amaro et al. 2013). The Pacific angel shark is categorized as Near Threatened in the International Union for Conservation of Nature Red List of Endangered Species, with a suspected population decline approaching 30% over 3 generations (Cailliet et al. 2016). Currently, no information on stock or structure has been documented for this species.
Assessing the differences in the population structure of a fishery resource is necessary to understand the extent to which populations are genetically isolated from each other and need different management plans to protect the species (Nielsen and Powers 1995). It is important to select a locus or loci with a relative high mutation rate in order to detect sufficient polymorphism in population-level studies (Heist et al. 1996). The mitochondrial DNA genome includes a small non-coding region known as the mitochondrial control region (mtCR), which serves as the origin of replication for the mitochondrial genome and is usually more variable than other coding genes (Avise 1994). Several shark population studies have used the mtCR to infer processes responsible for observed patterns of spatial genetic differentiation and to identify fishery management and conservation units (see Dudgeon et al. 2012 and references therein). In the present study, we assess the levels of genetic diversity, population structure, and demographic history of the Pacific angel shark along the northwestern coast of Mexico based on mtCR.
Materials and methods
DNA extraction, amplification, and sequencing
Sampling was conducted at 2 localities where artisanal fishermen often land elasmobranchs: the port of Ensenada (27 samples) on the western coast of the Baja California Peninsula and El Portugués fishing camp (11 samples) on the eastern coast (Fig. 1). A small piece of muscular tissue was excised from each individual and stored at 4 ºC in absolute ethanol. Genomic DNA was extracted by a standard phenol-chloroform method (Aljanabi and Martinez 1997). The polymerase chain reaction (PCR) was carried out to amplify mtCR using universal primers: cytb-1040 (5 -GGN CAA CCM GTY GAA CAA CC-3 ) and 12 rev 326 (5 -ACT CGT ATA ACG CGG TGG CT-3 ) (J Sandoval-Castillo pers. comm.). Cycling conditions were as follows: an initial denaturation step at 96 ºC for 5 min; 35 cycles for 60 s each at 94 ºC, 60 s at 60 ºC, and 60 s at 72 ºC; and a final extension step for 10 min at 72 ºC. PCR products were purified using the QIAquick PCR Purification Kit (QIAGEN, Hilden, Germany). Both heavy and light strands were sequenced (Arizona Research Laboratories, Tucson, AZ) using direct sequencing reactions with a 3730XL DNA Analyzer (Applied Biosystems, Carlsbad, CA) and a BigDye Terminator Cycle Sequencing Kit (Applied Biosystems, Foster City, CA). The resulting DNA sequences were imported into ChromasPro v2.0.1 (Technelysium, Brisbane, Australia) and checked for quality and accuracy of nucleotide base assignment, and multiple sequence alignments were obtained using Clustal X implemented in MEGA v3.1 (Kumar et al. 2008).

Analysis of mtCR
Molecular diversity indices for the mtCR fragment, including the number of polymorphic sites, nucleotide composition, haplotype diversity (h), nucleotide diversity, and nucleotide divergence, were estimated for each sample using Arlequin v3.1 (Excoffier et al. 2005) and DnaSP v5.0 (Librado and Rozas 2009).
The level of differentiation among populations was assessed by estimating the pairwise F ST values for mtCR, based on the mean number of pairwise differences among sequences, using Arlequin. The hierarchical genetic structure of populations was assessed for the mtCR by an analysis of molecular variance (AMOVA) implemented in Arlequin. Statistical significance was estimated using 10,000 permutations. The Bayesian phylogeographic and ecological clustering (BPEC) method (Manolopoulou et al. 2011, Manolopoulou and Emerson 2012) was used to detect genetically and geographically distinct population clusters. This test was implemented in R 3.3.1 (R Development Core Team). Different tree and migration event scenarios were explored through the Markov chain Monte Carlo procedure to estimate the geographically clustered structure. Migration events were assumed to occur when a haplotype (with or without a mutation from its parent haplotype) migrated to a new cluster. The inputs for the BPEC analysis were 107 iterations, 2 dimensions, 1 parsimony relaxation parameter, and a maximum of 3 migrations.
Network and phylogenetic analyses
The relationships among the mtCR haplotypes were represented with a median-joining network (Bandelt et al. 1999) that was constructed using DNA Alignment v1.2 and PopART v3.0 (AWC 2007).
Phylogenetic analysis was performed by Bayesian inference (Huelsenbeck and Ronquist 2001, Huelsenbeck et al. 2001). The Bayesian phylogeny was estimated using the GTR + I + G model as the substitution model selected with the Bayesian information criterion implemented in MrModeltest v2.3 (Nylander 2004). Bayesian tree inferences were performed using MrBayes v3.1.2 (Ronquist and Huelsenbeck 2003). We used Markov chain Monte Carlo sampling with 4 chains, which ran simultaneously for 107 iterations with trees sampled every 10,000 generations. The first 25% of the trees were discarded as burn-in and the remaining trees were used to construct a 70% majority-rule concensus phylogeny. For phylogenetic reconstruction Squatina formosa was used as an outgroup (GenBank accession number: KM084865.1).
Demographic history
Two methods were applied to the mtCR data set to explore the demographic history of the Pacific angel shark samples that showed genetic differentation. First, evidence for population expansion was evaluated with Tajima’s D (Tajima 1989) and Fu’s F S (Fu 1997) statistics using Arlequin. Second, to further explore the possibility of demographic changes, a mismatch distribution analysis (distribution of pairwise differences) (Rogers and Harpending 1992) was performed for both geographical groups in Arlequin. Mismatch analysis models assume that any population growth or decline will reveal a genetic signature (Rogers and Harpending 1992, Schneider and Excoffier 1999).
Results
Genetic analysis
A fragment of 980 bp from the mtCR was sequenced for all samples (GenBank accession numbers: KP792162to KP792190). The nucleotide composition of this fragment consisted of 21.59% cytosine, 35.11% thymine, 29.66% adenine, and 13.64% guanine. Altogether, 29 haplotypes were found (Table 1) . Overall haplotype and nucleotide sequence diversities were 0.977 and 0.013, respectively. A total of 19 and 10 haplotypes occurred at the Gulf of California (El Portugués) and Pacific (Ensenada) sites, respectively. The most common haplotypes, GCF5 and GCF7, occurred at the gulf site. There were no shared haplotypes between sampling areas.
Table 1 Genetic diversity indices based on the mitochondrial control region sequences of Squatina californica from the Gulf of California and the Pacific coast of the Baja California Peninsula: n, number of samples; PS, number of polymorphic sites; SN, number of substitutions; Tr, number of transitions; Tv, number of transversions; NH, number of haplotypes found; h, haplotype diversity; π, nucleotide diversity. The asterisk indicates statistical significance at P < 0.05.
| Sampling area | n | PS | SN | Tr | Tv | NH | h | π | D 1 | F S 2 |
| Gulf of California | 27 | 52 | 54 | 18 | 36 | 19 | 0.982 | 0.008 | -1.978* | -2.985* |
| Pacific Ocean | 11 | 90 | 90 | 17 | 73 | 10 | 0.957 | 0.055 | -1.875* | -2.377* |
| Total | 38 | 127 | 134 | 33 | 101 | 29 | 0.977 | 0.013 |
The results of the molecular variance and pairwise analyses were concordant. The null hypothesis of global panmixia across the study area was rejected because there was significant genetic heterogeneity between sampling areas (Table 2). The pairwise F ST value was significant (F ST = 0.123, P < 0.01) for the pairwise comparison between the Pacific and Gulf of California samples. This genetic differentiation is also consistent with the number of clusters identified by BPEC. Based on the mtCR data set, BPEC revealed the highest probability (P = 0.97) at 2 clusters, indicating this as the best estimate of the true number of genetic clusters, which clearly correspond to the gulf and Pacific areas (Fig. 2).
Table 2 Variance of pairwise genetic distances and estimated nucleotide divergence (K) based on the mitochondrial control region sequences of Squatina californica from waters off northwestern Mexico.
| Source of variation | Variane | % total | P | F ST | K (%) |
| Among populations | 3.77 | 44.51 | 0.00 | 0.4451 | 2.13 |
| Within populations | 4.70 | 55.49 |

Figure 2 Results from Bayesian phylogeographic and ecological clustering analysis based on the mitochondrial control region sequences of Squatina californica from the Pacific coast of the Baja California Peninsula and the Gulf of California. The simulated contour areas are centered for each population cluster, and the shaded areas show the radius of 50% concentration contours around it.
The Bayesian phylogenetic tree for the S. californica samples collected off northwestern Mexico showed 2 clusters (Fig. 3), the G cluster comprising the gulf samples and the P cluster comprising the Pacific samples. Both clusters were reflected in the haplotype network because no haplotypes were shared between the Pacific and the gulf samples (Fig. 4).

Figure 3 Bayesian phylogenetic reconstruction based on the mitochondrial control region sequences of Squatina californica. Posteriori probabilities are indicated in the nodes. Squatina formosa (SF) was used as the outgroup. P, sample from the Pacific coast of the Baja California Peninsula; G, sample from the Gulf of California. Colors show the clusters according to the Bayesian phylogeographic and ecological clustering results.

Figure 4 Haplotype network based on the mitochondrial control region sequences of Squatina californica. Black circles indicate haplotypes from the Pacific coast of the Baja California Peninsula (PCM) and blue circles indicate haplotypes from the Gulf of California (GCF). Relative area of circles reflects sample size and the red nodes represent possible haplotype ancestors. Concerning bars represent mutation steps.
Demographic history
The unimodal mismatch distribution analysis (Fig. 5a), together with the negative values of Tajima’s D and Fu’s F S statistics (Table 1), indicated a recent population expansion scenario for the gulf population. In contrast, the mismatch distribution analysis showed a multimodal distribution for the Pacific population, suggesting demographic stability (Fig. 5b).
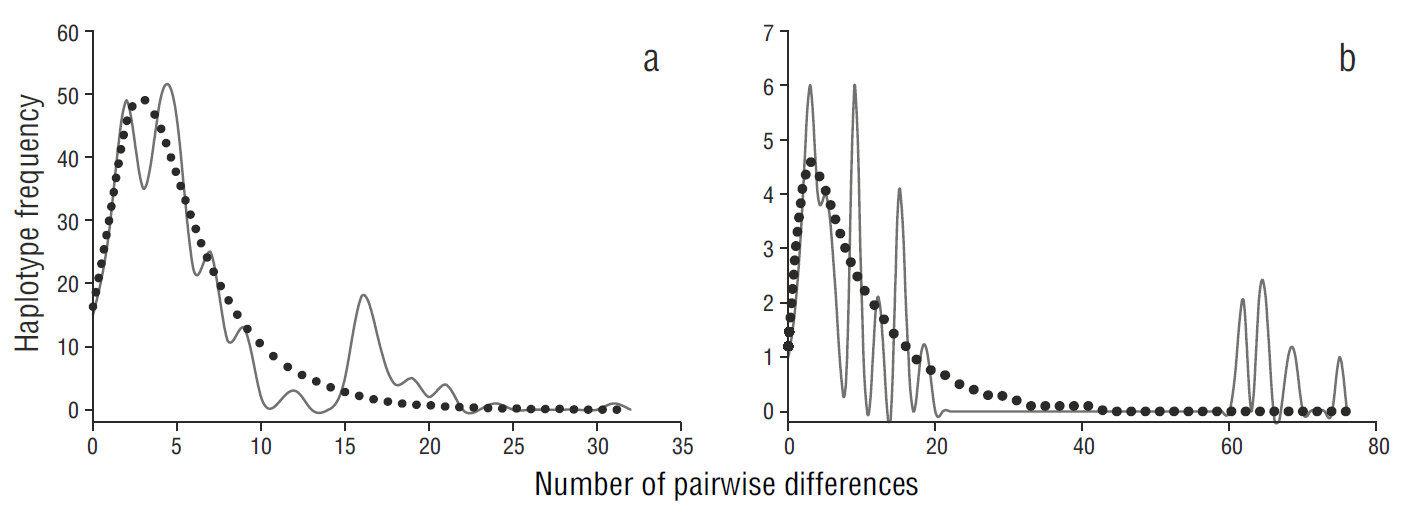
Figure 5 Pairwise mismatch distribution of relative effective population size of Squatina californica based on the mitochondrial control region sequences of samples from the (a) Gulf of California and (b) Pacific coast of the Baja California Peninsula. The solid line represents expected frequency and the dotted line represents observed frequency.
Discussion
The present study provides a first approach to learning the genetic diversity, population structure, and demographic history of S. californica off northwestern Mexico using mtCR. The mtCR sequence of this shark species is shorter than that observed in most cartilaginous fishes (~1,200 bp, Stoner et al. 2003). Overall haplotypic diversity was high, mainly due to the presence of many unique haplotypes. These high diversity values are similar to those reported for Pacific angel sharks in the Gulf of California (h = 0.97; Grijalva-Chon et al. 2002). High haplotype and nucleotide diversity could likely be due to high mutation rates commonly recorded in the mtCR (Randi 2000).
Given the significant levels of genetic heterogeneity and differentiation and the lack of shared haplotypes between the Pacific and gulf samples, we suggest that there has not been sufficient gene flow between both areas. In fact, this population division was observed in the global phylogenetic analysis of angel shark (genus Squatina) samples performed by Stelbrink et al. (2009). The regional genetic variation observed in our study could be linked to ontogenetic differences in S. californica between study areas. Length at sexual maturity (LSM) and maximum total length (MTL) are lower in individuals from the gulf area (LSM = 70.0-77.7 cm; MTL = 88-99 cm) than in individuals from the Pacific area (LSM = 99 cm; MTL = 117 cm) (Villavicencio-Garayzar 1996, Romero-Caicedo et al. 2016). Morphological differences and genetic differentiation are both in agreement with the population structure of this species in the study area.
The genetic differentiation observed in the Pacific angel shark can be attributed to the low dispersal ability of this species because of its life history traits, particularly its preference for coastal and benthic habitats and the lack of pelagic development stages such as the larval stage (Compagno 2005). In general, angel shark species have limited ability for sustained swimming due to their morphological and anatomical features, which limit swim power and suggest low dispersal potential and short migration events (Pittenger 1984). Taking into account the characteristics of S. californica, we consider that the submarine canyons constitute a natural barrier for its dispersal. Geomorphology off northwestern Mexico is complex, and there are numerous submarine canyons and great depths (at the mouth of the Gulf of California, the ocean basin drops to over 3,000 m) (Gutiérrez et al. 2004). Furthermore, the continental shelf along the Pacific coast of Baja California is typically narrow (usually <20 km), with great depths close to it (Allen and Horn 2006). The effect of deep marine basins as barriers to dispersal has also been suggested for the Pacific angel shark in waters between the northern and southern Channel Islands (California) (Gaida 1997) and even for other demersal elasmobranchs such as the thornback ray (Raja clavata, Chevolot et al. 2006) and the nurse shark (Ginglymostoma cirratum, Karl et al. 2012).
The Baja California Peninsula has been reported as an important biogeographic barrier for several species of elasmobranchs such as the shovelnose guitarfish (Rhinobatos productus, Sandoval-Castillo et al. 2004), California butterfly ray (Gymnura marmorata, Smith et al. 2009), golden cownose ray (Rhinoptera steindachneri, Sandoval-Castillo and Rocha-Olivares 2011), and banded guitarfish (Zapteryx exasperata , Castillo-Páez et al. 2014). The dynamic history of the area as a transition zone (Álvarez-Borrego 1983) could have produced multiple events of population fragmentation, likely influencing the genetic differentiation in elasmobranch populations (Sandoval-Castillo and Beheregaray 2015).
Reproductive behavior may also promote the observed genetic differentiation of Pacific angel shark populations. Philopatric behavior reduces the possibility of gene flow among breeding areas (Dudgeon et al. 2012). Female reproductive philopatry to nursery areas has been recorded for several elasmobranchs, such as the zebra shark (Stegostoma fasciatum, Dudgeon et al. 2009), thornback ray (R. clavata, Chevolot et al. 2006), and small-spotted catshark (Scyliorhinus canicula, Kousteni et al. 2015), and it even has been associated with the genetic variation in the banded guitarfish (Z. exasperata, Castillo-Páez et al. 2014) between the Pacific and gulf areas. However, no tagging or biological marker studies are available to determine whether S. californica returns to the same breeding areas every reproductive season. In this sense, tagging studies are required to assess reproductive philopatry.
In the present study, we found private or unique haplotypes for both sampling areas probably due to the small sample size (Kalinowski 2004). An adequate sampling scheme is needed to properly analyze biological questions regarding geographic genetic structure (Mona et al. 2014). Small sample sizes can overestimate population division and fail to yield statistical significance in the pairwise AMOVA (Sinclair and Hobbs 2008). Because of this and given the genetic variation, we consider that fine-scale sampling and larger sample sizes are required to detect intermediate populations.
The demographic analyses suggest a sudden growth for the gulf population, which could be associated with the formation of the Gulf of California. The formation of the Gulf of California (Pleistocene, Jacobs et al. 2004) provided new habitat and propitious conditions. The Pacific population showed patterns of population stability, but the mismatch distribution showed a ragged distribution (Fig. 5a), indicating a population in disequilibrium that is less likely to expand. A similar distribution has been documented for the Guadalupe fur seal (Arctocephalus townsendi, Weber et al. 2004), suggesting a substantial loss of genetic variability associated with a recent population bottleneck. Divergence time studies using more molecular markers are nevertheless required to adequately assess the demographic history of both Pacific angel shark populations.
Our results have implications for the design of management and conservation policies because they suggest 2 populations or stocks for the Pacific angel shark off northwestern Mexico. The adoption of genetic and evolutionary criteria in the management of natural resources has led to the recognition of management units, which represent functionally independent populations, or groups of populations, characterized by low levels of gene flow (Moritz 1994). In this sense, we suggest that both populations should be considered as separate management units. Future stock assessment should be done separately for each population. In Mexico, however, tools for legislation (e.g., NOM- 029-PESC) do not account for population or stock structure or population dynamics of shark resources. An inadequate management strategy can cause a stock to collapse or lead to local extirpation with ecological and economic consequences (Dulvy and Forrest 2010).
In particular, demographic analyses for the Pacific population of S. californica suggests population stability but with tendency to decline, likely due to the effect of fisheries. Reported landing data (2003-2015) from Baja California suggest that Pacific angel shark landings declined by >99% (Cailliet et al. 2016). This shark species has been heavily exploited off the western coast of the Baja California Peninsula (e.g., San Ignacio Lagoon and Magdalena Bay) over the past 3 decades (mainly in the 1980s and 1990s; Villavicencio-Garayzar and Abitia-Cardenas 1994, Leet et al. 2001). A recent study of elasmobranch fisheries along the western coast of the Baja California Peninsula (Ramírez-Amaro et al. 2013) found that Pacific angel sharks were not reported in previously known landing areas. It is therefore necessary to pay attention to the current and future effects of fishing on the population of S. californica off the western coast of the Baja California Peninsula.

