text in
  English (pdf)
 Article in xml format
 Article references
 Send this article by e-mail
 Cited by SciELO
  Similars in
SciELO
Similars in
SciELO 
 Permalink
Introduction
Fishing activity has important consequences for both the exploited communities and the ecosystems where these activities are conducted. Fishing activity is part of the ecosystem, and its effects are numerous and widely studied (Hollingworth 2000, Cury et al. 2005). Among the most important effects are habitat destruction, mortality of non-target species, changes in population demographics, and changes in the function and structure of ecosystems (Jennings and Kaiser 1998, Pikitch et al. 2004, Sánchez and Olaso 2004).
This focus has changed the foundations of fisheries management and administration towards what has been called ecosystem-based fishery management (Sinclair et al. 2002, Link 2005). According to Pikitch et al. (2004), the main objective under this paradigm is to preserve the health of marine ecosystems and the fisheries that depend on them. Accordingly, the concepts of ecosystem approach to fisheries (EAF) and marine protected areas (MPAs, including marine reserves) have been developed as governance and management measures, respectively (Jones 2001, Pauly et al. 2002, Claudet and Pelletier 2004, García and Cochrane 2005). For the implementation of an EAF, it is necessary to obtain a better understanding of how the ecosystem functions (Gislason et al. 2000, Sinclair et al. 2002, Fréon et al. 2005), taking into consideration fisheries as part of the ecosystem and not only as a fishing activity to regulate. In this sense, knowing the behavior of fishing activities, the target species, and the space where they are working are essential aspects for the development of future management plans that minimize the socioeconomic effects on fishing activity and maximize the protection of habitats and target species.
In this context, the countries of the European Union have to create a network of MPAs to ensure the conservation and protection of habitats, resources, and breeding areas, connectivity between areas, etc. Continuous and intensive fishing occurs in many of the MPA candidate sites and any implementation of regulatory measures could bring about large social conflict (Baelde 2005). Therefore, it is essential to gain an understanding of the fishing activity and its relationship with the ecosystem in order to spatially characterize the possible effects on the ecosystems.
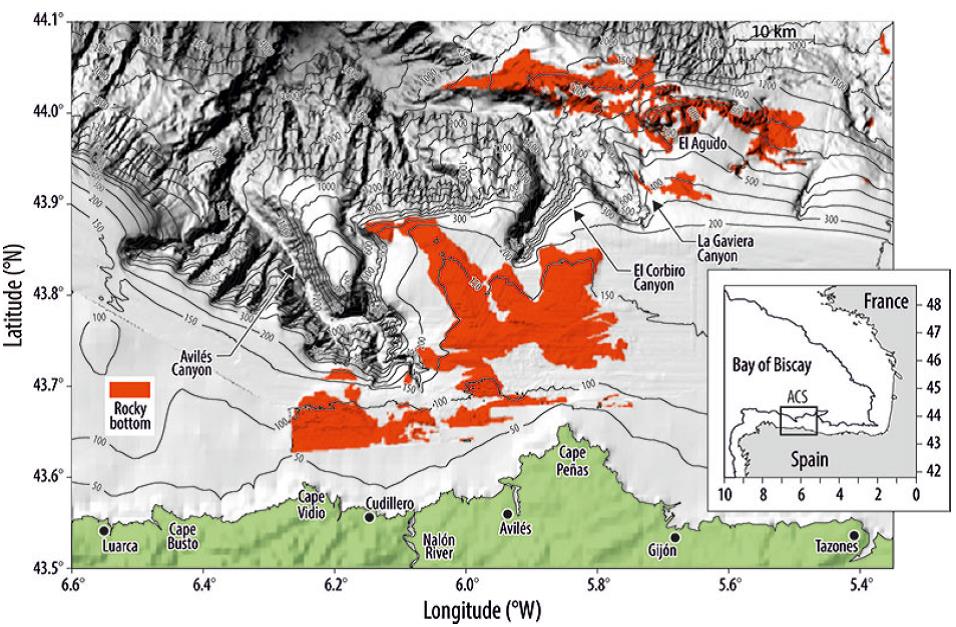
The Avilés Canyon System (Fig. 1) is one of 10 areas chosen by the Ministry of Environment in Spain to be designated an MPA and integrated within the European Natura 2000 network. In the area of influence almost all types of fishing gear are used (trawl, longline, purse seine, and gill nets). This makes this area an excellent example of how a structurally and geographically complex zone (Gómez-Ballesteros et al. 2014) is exploited by mixed fisheries.
In the European Union, information on the spatial distribution of fishing activity can be obtained from 2 main sources: logbooks and vessel monitoring systems (VMS). The coupling of VMS and logbook data offers the possibility of performing a precise spatial analysis of fishing activity and its relationship with the affected ecosystems. The present study analyzes and characterizes for the first time the spatial distribution of Spanish fishing activity by fishing tactic (defined as a combination of gear, target species, and working area) in the southern part of the Bay of Biscay. This will allow us to analyze the fishing activity depending on the target species and relate each type of activity to the characteristics of the area. In addition, we can analyze the use of the area made by each gear and fishing tactic and the relationship with the other fishing activities. This information will be one of the main tools for the development of management plans for the Avilés Canyon MPA.
Materials and methods
Study area
The study area is located in the Cantabrian Sea (southern Bay of Biscay) and consequently falls within OSPAR Region IV. This whole area is characterized by a narrow platform andby deep-sea canyons. The Avilés Canyon System (Fig. 1) is a complex region of canyons and valleys comprising 3 main canyons of different morphostructural characteristics (Gómez-Ballesteros et al. 2014). The near continental shelf is generally narrow; the width varies from 12 km (where the head of the Avilés Canyon is incised) to 40 km. Maximum depths are approximately 200 m, but occasionally reach 300 m east of the canyon. The continental shelf displays rocky outcrops of different reliefs and morphologies, and a nearly horizontal surface corresponding to sedimentary areas with unconsolidated sediment cover or heavily eroded basement surfaces. The strong currents over the shelf are responsible for the minimal sedimentary cover in the area.
Data source
The bathymetric information presented here was obtained during two surveys carried out aboard the R/V Vizconde de Eza between 2010 and 2011 using a Simrad EM-300 multi-beam echosounder (Gómez-Ballesteros et al. 2014).
The spatial distribution of the activities of the industrial fleet was analyzed using logbook and VMS information. The logbook information corresponded to the period 2002-2010 for the entire Cantabrian Sea (southern Bay of Biscay), and it was used to identify the fishing gear and fishing tactics (Marchal et al. 2006). The VMS information covered the period 2006-2010, and only the data corresponding to the study area were used. VMS data were also used to carry out the spatial analysis of the fishing tactics previously identified in the logbooks. The VMS and logbook data were provided by the Spanish Ministry of Agriculture, Food and Environment (MAGRAMA, for its initials in Spanish).
A VMS is a tracking device that sends a signal (ping) every 2 h that contains the code of the emitting ship, date, time, position (latitude and longitude), speed in knots, course, and whether the vessel is carrying out fishing operations or not. Many filters and processing techniques are used to eliminate signals not related to fishing activity (Lee et al. 2010, Hintzen et al. 2011). In this study, the following processing technique was used: the time interval and the Euclidean distance between successive signals were obtained, and each of these values was associated with the first signal of each corresponding pair; when the time interval between signals was longer than 4 h, the beginning and end of each fishing expedition was determined; the average speed of the vessel was calculated using the interval between successive signals (pings); vessels with less than 10 signals in a year were eliminated; signals recorded within a distance of 3 miles or less from the closest fishing harbor were also eliminated. Each signal coinciding with a fishing trip registered in the logbooks (according to the vessel code and the date of capture) was associated with a fishing gear and a fishing tactic. Based on the distribution of the frequencies of average speeds, a working range for each fishing gear was defined, and all signals with associated velocities out of the working range were eliminated (Hintzen et al. 2011). For the study area, 51.6% of 46,075 VMS fishing days could be matched with their logbook records for the period 2006-2010 and both fishing gear and fishing tactic could be assigned to each matched day.
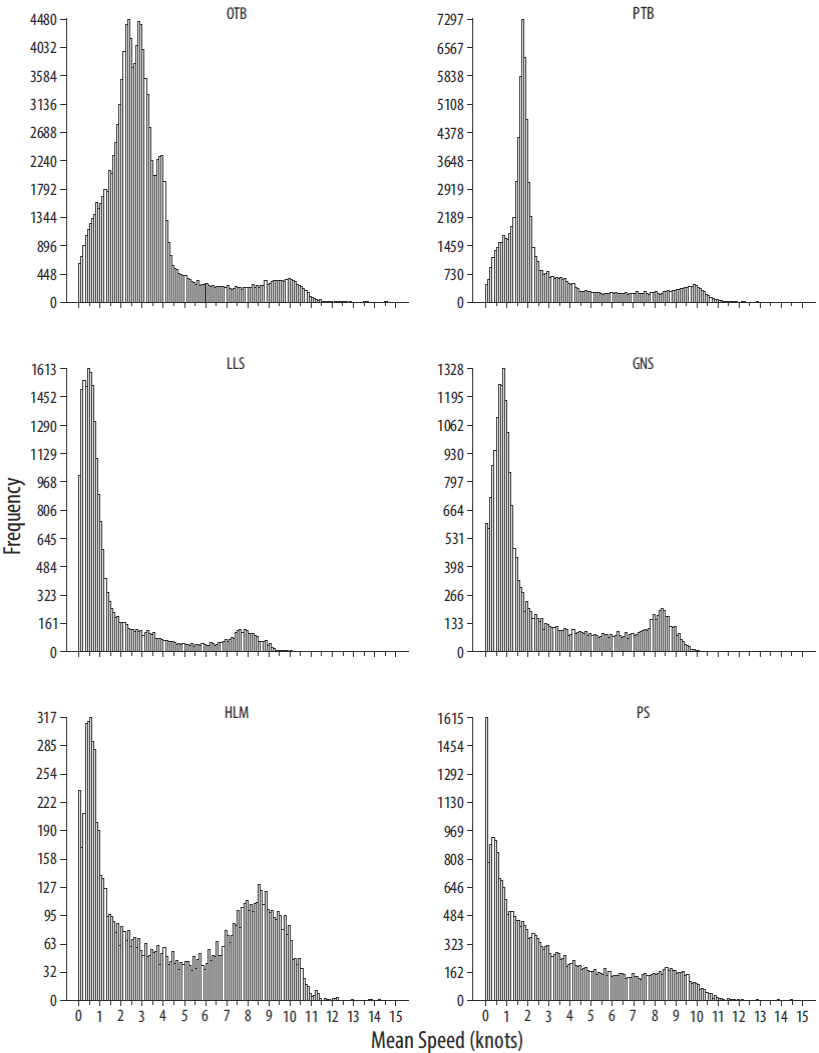
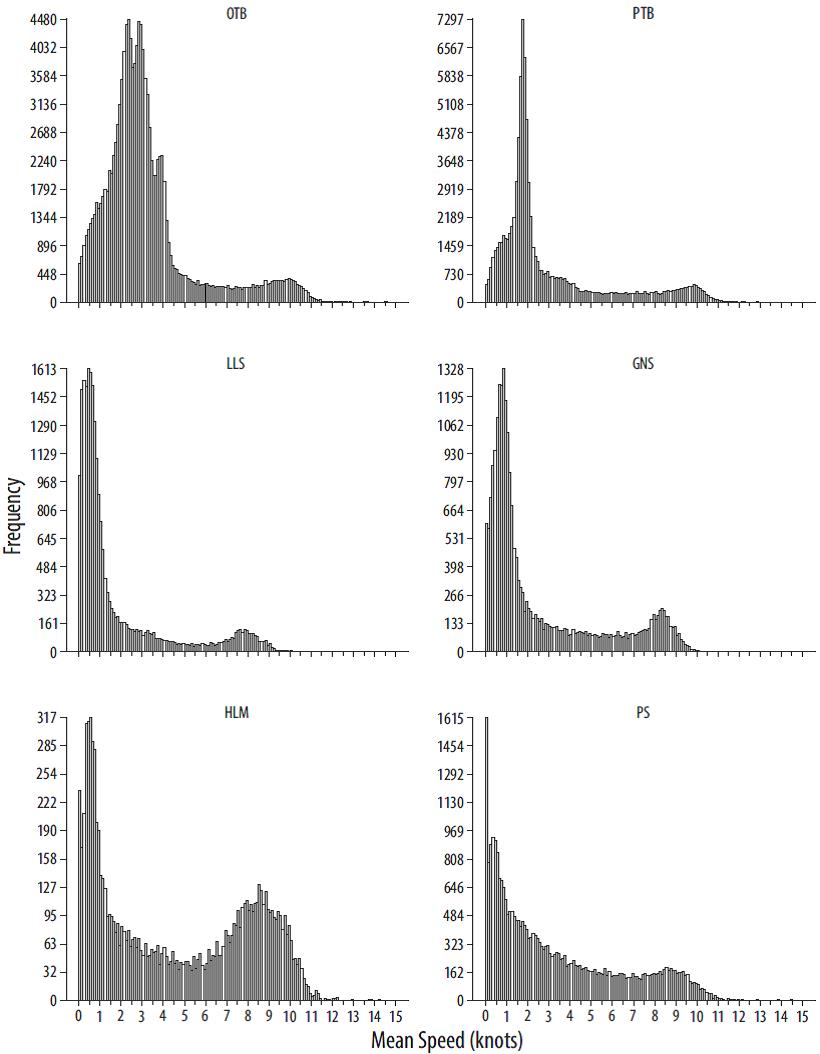
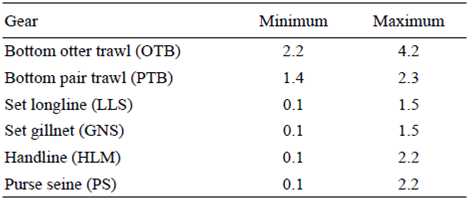
The frequency distribution of the average velocities was used to determine the average speed ranges at which we considered fishing activity to be carried out (Fig. S1). The identification of these ranges can be achieved by either locating changes in the tendency through the use of regression models (segmented regression) or using available information from the fleet and on-board observers. In the case of mobile fisheries (trawling and handline trawling), both methods are used, whereas in the case of static fisheries (purse seine, gillnet, longline, and handline fishing), it is better to use the information provided by on-board observers and the information obtained from the fleet according to the frequency distribution. The speed ranges by fishing gear can be seen in Table 1.
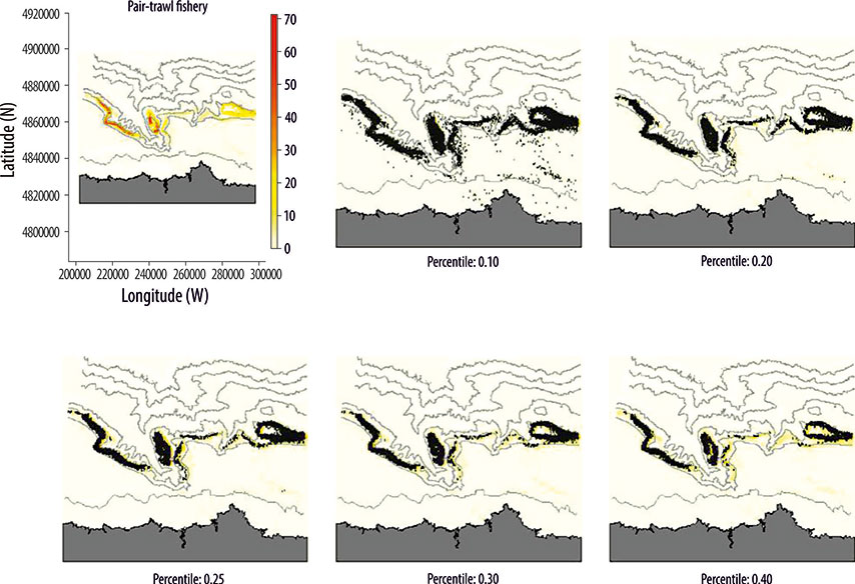
On wide continental shelves with sedimentary bottoms such as in the North Sea, the fishing areas are generally extensive. In these cases, after filtering and analyzing VMS data, the distribution of fishing efforts can clearly be observed. Therefore, areas containing points with no fishing activity are scarce (Hintzen et al. 2011). However, fishing areas located on narrow continental shelves with rocky mosaic bottoms or on continental slopes are generally narrow and short. In these cases, it is frequent to find areas where fishing activity is apparently being carried out when, in reality, there is no activity. To eliminate false fishing activity, it is necessary to apply thresholds to define when fishing activity is actually carried out.
Thresholds were applied to determine if the filtered VMS data corresponded to real fishing activity. Thus, the effort value was assigned to each corresponding point where fishing was detected (see "Estimation of relative spatial effort" section below). Subsequently, it was necessary to set a threshold for the effort value below which fishing activity was considered to be negligible or non-existent, for which there are numerous techniques (Jiménez-Valverde and Lobo 2007). The techniques that provided the best outcomes were based on applying quartile thresholds. Points at which the presence of fishing was detected were eliminated according to the distribution of the effort frequencies (Fig. 2). The use of other statistics based on generating pseudo-absences to distinguish points with real presence was not fruitful because efforts were located in specific places. Thus, when generating pseudo-absences and eliminating those that corresponded to real activity locations, pseudo-absences always occurred over zones where there was no activity; consequently, the threshold values were so low that we could not distinguish between real and false presences. Thresholds can be applied to fishing tactics or to fishing gear. If the relative importance of thresholds is small, it is better to apply them to fishing tactics; otherwise, it is more effective to apply them to fishing gear. In our case, comparing the distribution of effort with the distribution of pings (Fig. 2), when a 0.2 threshold was applied all those points that were outside the fishing area were eliminated without affecting the estimation of the effort of the main fishing areas. After inspecting the spatial distribution of the effort of all fishing gears the threshold was applied to all.
Identification of fishing tactics
The terminology used in the present study was defined in ICES (2003) and used by Marchal et al. (2006): fleet, a group of vessels with similar characteristics, and fishing tactic, trips made targeting the same species/stock or a combination of these using similar gear in the same period of the year and in the same area. The identification of fishing techniques was performed by gear. To standardize the landings by trip for each of the gears, the species composition of each trip was expressed as a percentage of the total amount caught (Jiménez et al. 2004, Campos et al. 2007). Those species representing less than 1% of the total landings were incorporated into the matrix in a group called "other". Given the doubtful classification of deep-sea sharks conducted on board, this taxonomic group was separated into 2 categories: deep-sea sharks and other sharks, which included all remaining sharks.
The non-hierarchical cluster technique CLARA (Clustering Large Applications, Kaufman and Rousseeuw 1986) was used to identify and classify fishing tactic by fishing gear. The silhouette width (Rousseeuw 1987) was used to select the number of clusters, and to validate the consistency of the clustering we followed the criteria of Struyf et al. (1996), in which 4 levels are defined for the global silhouette coefficient and partial silhouette coefficient: 0.71-1.00, consistent pattern; 0.51-0.70, reasonable pattern; 0.26-0.50, weak pattern; <0.26, no pattern. A detailed explanation of the use of this technique in fisheries can be found in Castro et al. (2010).
The analyses were performed using R (R Development Core Team 2005). The correspondence and principal component analyses were performed using the "ade4" library (Dray and Dufour 2007), and the cluster analyses were performed with the "cluster" (Maechler et al. 2005) and "stats" (R Development Core Team 2005) libraries.
Estimation of relative spatial effort
The spatial effort was estimated using a grid spacing of 250 m. Thus, a 250-m search radius was chosen in each node such that adding up the time assigned to each ping emitted by the VMS corresponded to the presence detected within each radius. By taking a radius whose length was the same as the grid spacing, we achieved better geographic precision of effort, overestimating those locations where presence was more frequent.
Estimation of overlap between demersal fisheries
The overlap between demersal fishing gears was analyzed: bottom otter trawl (OTB), bottom pair trawl (PTB), set gillnet (GNS), and set longline (LLS). When analyzing the overlap between fishing activities, it is necessary to take into account that the VMS indicates the position of the boat, not the position of fishing gear. In order to avoid false positives or false negatives, values greater than 20% with respect to the maximum value of effort were taken into account and the resolution of layers was lowered to 1,000 m. To analyze the overlap, each pixel with activity of the layers analyzed was given the value 1, and the layers with the fishing techniques analyzed were added (PTB vs OTB, GNS vs LLS, and set gear vs mobile gear). The result was a final raster layer with the following values: NA, absence of activity; 1, activity of one of the 2 fishing techniques analyzed; and 2, overlap of the activity.
Results
Fishing tactics in the study area
All of the fishing gears were present in the study area: OTB, PTB, GNS, LLS, purse seine (PS), and handline (HLM). Longline targeting Dicentrarchus labrax (sea bass) and purse seine targeting Engraulis encrasicolus (anchovy) were not considered in the present study because they were poorly represented in the study area (3 and 6 fishing trips, respectively). The global silhouette coefficient by fishing gears showed values equal to or greater than 0.5; hence, all of the classifications could be considered robust (Table 2). A total of 17 fishing tactics were identified. For all fishing tactics the target species appear in 100% of the trips (frequency of occurrence, FO), except for mixed otter trawl (OTB MIX), purse seine targeting Trachurus spp. (PS_HOM), and handline targeting tuna (HLMTUN).
Table 2 Catch profile expressed as percent of total weight and frequency of occurrence (FO) by gear (GCS, global silhouette coefficient) and fishing tactic (PCS, partial silhouette coefficient). Only the species that comprised more than 1% of the catch are shown.


Three otter trawl fishing tactics were identified. The first was a mixed fishing tactic (OTB_MIX) targeting several demersal species, none of them accounting for more than 17% of the landings and almost 45% of the landings corresponding to 3 species (Lophius spp., monkfish; Lepidorhombus spp., megrims; and Merluccius merluccius, hake); the main species in FO were Lophius spp. The second tactic targeted Trachurus trachurus (horse mackerel) (OTB_HOM), which accounted for 80% of the landings, with some demersal species as bycatch. The third tactic (OTB_MAC) targeted Scomber spp. (mackerel), with Trachurus spp. as bycatch (FO = 43). Regarding pair trawling, only 2 fishing tactics were identified, the first targeting Micromesistius poutassou (blue whiting) (PTB_WHB), with Merluccius merluccius (hake) as the main non-targeted species (FO = 80), and the second targeting Scomber spp. (PTB_MAC) and blue whiting as main bycatch (FO = 43).
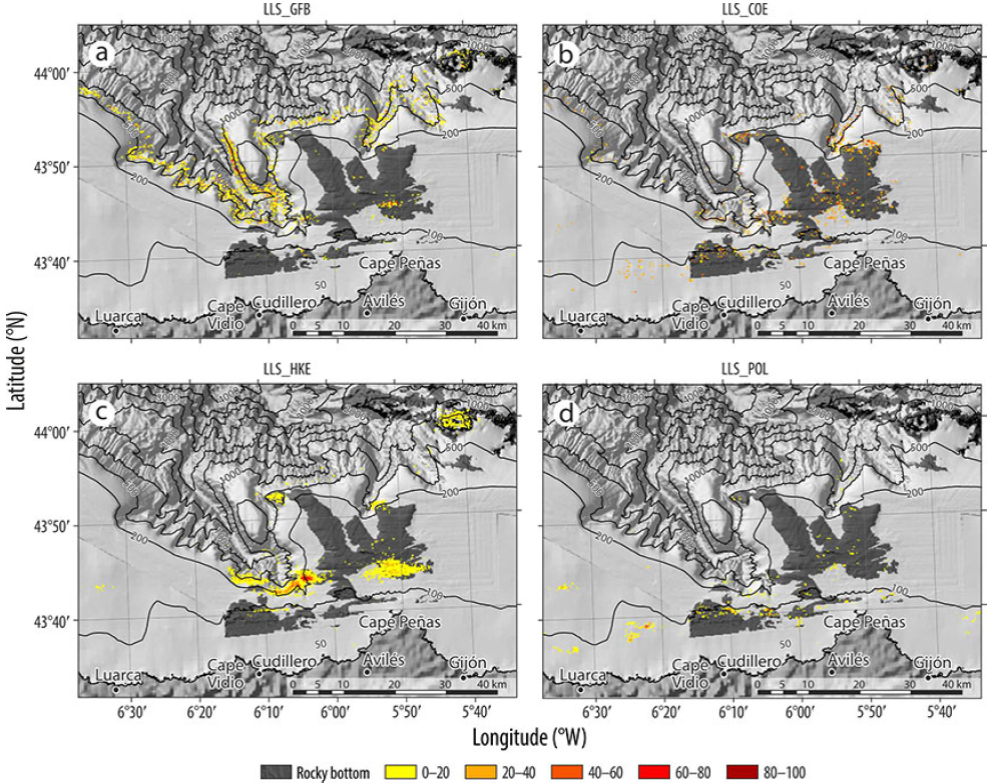
Four longline fishing tactics were identified. One tactic targeted Conger conger (conger) (LLS_COE) and another targeted Phycis blennoides (greater forkbeard) (LLS_GFB), the former capturing P. blennoides as bycatch and the latter capturing C. conger as bycatch. A third tactic targeted hake (LLSHKE), without any significant bycatch, and a fourth targeted Pollachius spp. (LLS_POL) with sparids as bycatch, which were unloaded during 58% of fishing trips (FO), thus accounting for only 7.81% of the landings by weight. In the case of all fishing tactics, bycatches were of little importance compared with the target species both in quantity and frequency.
Three gillnet fishing tactics were identified. The first tactic targeted hake (GNS_HKE) and the second targeted Lophius spp. (monkfish) (GNS MNZ), without any characteristic bycatch species. The third targeted species from the "other" group (GNS_MIX), with hake and monkfish as bycatch species.
In the area of influence of the Avilés Canyon System, purse seines and handlines are used to catch pelagic species. In the case of the purse seine net, 3 different fishing tactics were observed: the first targeted horse mackerel (PS_HOM), with Boops boops (FO = 17) and Sardina pilchardus (FO = 29) as main bycatch species; the second targeted mackerel (PS_MAC); and the third targeted Sardina pilchardus (sardine) (PS_PIL), with horse mackerel (FO = 19) and mackerel (FO = 18) as bycatch. Finally, 2 handline fishing tactics were identified, one targeting mackerel (HLM_MAC) and another targeting tuna with live bait (HLM_TUN).
Spatial distribution of fisheries by gear
Bottom otter trawling was carried out on sedimentary bottoms outside the 100-m isobath, the legal limit (Fig. 3a). In the western part of the study area, the fishing effort was located close, but below, 200 m depth, although fishing activity between 100 and 200 m and deeper than 500 m was observed. In the eastern part, the effort distribution was similar, but higher activity could be observed near 100 m. Bottom pair trawling was carried out in 3 areas: on the flanks of the Avilés Canyon and in the southern part of the rocky outcrop called El Agudo between depths of 200 and 500 m (Fig. 3b).

Figure 3 Spatial distribution by gear: (a) bottom otter trawl (OTB), (b) bottom pair trawl (PTB), (c) set gillnet (GNS), (d) set longline (LLS), (e) purse seine (PS), and (f) handline (HLM). Color scale indicates relative effort.
The set gillnet fishery (Fig. 3c) was conducted throughout the study area except in the eastern part above 200 m. Two areas concentrate most of the effort: the eastern rocky area between 500 and 1,000 m and the region from west to southeast, around 100 m. It is necessary to take into account that we do not have environmental information for the latter zone (Fig. 1) and thus do not know if rocky areas are present there.
In the case of set longline fishing, the 3 main areas subjected to fishing efforts were located over rocky bottoms: the headwater region of the Avilés Canyon, El Agudo rocky outcrop, and the area in front of Cape Peñas (Fig. 3d). Additionally, fishing activity was carried out along the flanks of the 3 canyons, between 500 and 1,000 m.
Most of the purse seine fishing activity was located in the western area of Cape Peñas below 100 m depth (Fig. 3e). Regarding handlines, the main activity was located at the head of the canyon, although the fishing effort was scattered over the entire area (Fig. 3f).
Overlapping of demersal fishing activity
Overlapping between the 2 types of trawls occurred in the northwestern zone and slightly in the northeastern part of Avilés Canyon (Fig. 4a). The overlap between gillnets and longlines was limited to the head of the canyon and the El Agudo outcrop (Fig. 4b). When comparing the spatial distribution between the mobile and set types of gears, the overlap was very low and only occurred in the northeastern part of Avilés Canyon (Fig. 5).
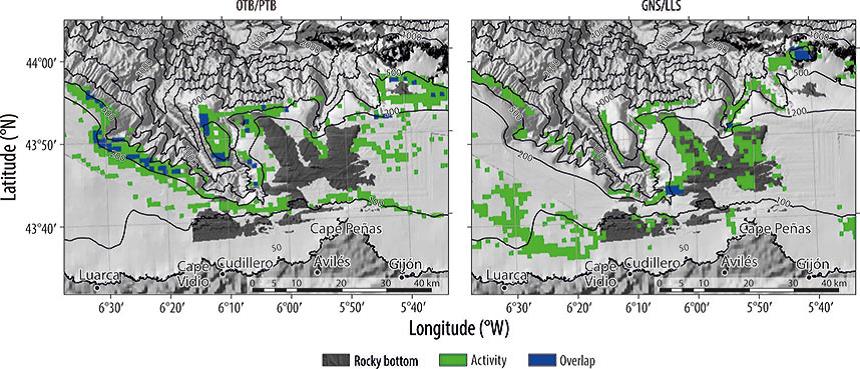
Figure 4 Spatial distribution of the overlapping between demersal fisheries: (a) bottom otter trawl (OTB) and bottom pair trawl (PTB), and (b) set gillnet (GNS) and set longline (LLS).

Spatial distribution of fisheries by fishing tactic
The spatial distribution of each fishing tactic can be seen in Figures S2-S5. Regarding otter trawling, the main difference was that the tactic targeting horse mackerel (OTB_HOM) was used mostly in the western area and along 100 m in the eastern zone. This fishing tactic and the tactic targeting mackerel (OTB_MAC) were carried out below 200 m depth (Fig. S2a-b). The mixed fishing tactic (OTB_MIX) was observed in the whole area where this fishing gear was used (Fig. S2c). The OTBMAC tactic was carried out during the first 5 months of the year.
In the case of bottom pair trawling, we found 2 very different distribution patterns of effort for each fishing tactic. Thus, whereas the tactic targeting blue whiting (PTB_WHB) was spread across the entire area where pair trawling was carried out (Fig. S2d), the tactic targeting mackerel was centered on the western part of the continental margin of Avilés Canyon from 200 to 500 m depth (Fig. S2e). As observed for OTB_MAC, PTB_MAC was carried out during the first 5 months of the year.
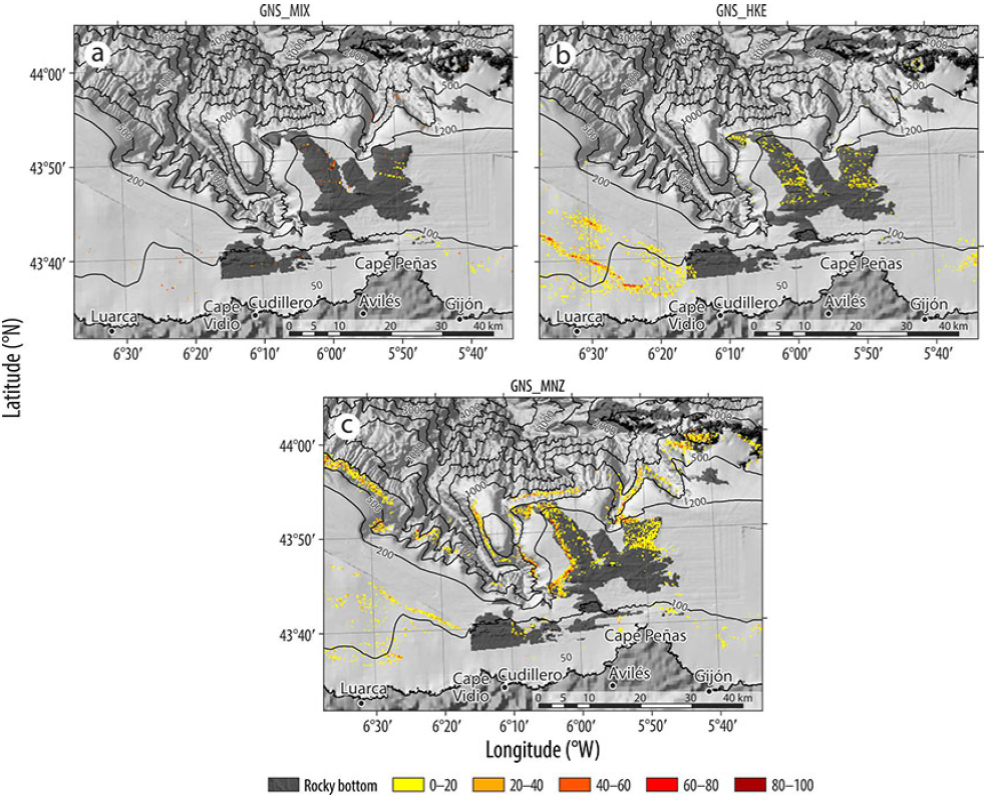
Each of the 3 gillnet fishing tactics presented a different spatial distribution (Fig. S3). In the case of the mixed fishery (GNS_MIX), there did not appear to be any defined pattern, and this fishery operated throughout the entire area where gillnets were used. Gillnetting for hake (GNSHKE) was carried out in the western area of the continental shelf, between 100 and 200 m depth, and in the rocky area located in front of Cape Peñas. We did not have any information on the type of bottom in the western part of the platform and the eastern end at 100 m depth. In the case of the tactic targeting monkfish (GNS_MNZ), this activity was carried out at depths between 500 and 1,000 m and within the limits between the soft and rocky substrata surrounding the rocky area located in front of Cape Peñas.
The longline fishing tactic targeting forkbeard (LLS_GFB) was carried out primarily in the deep-sea areas located on the flanks of the three canyons, between 500 and 1,000 m depth (Fig. S4a). The tactic targeting conger (LLS_COE) was used at a shallower depth along the rocky area in front of Cape Peñas and at the 100 m depth contour line (Fig. S4b). The fishing effort of the tactic targeting hake (LLS_HKE) was concentrated in the headwaters of Avilés Canyon, in El Agudo, and in the outcrops located in front of Cape Peñas (Fig. S4c). The LLSPOL tactic was mainly used along the 100-m isobath (Fig. S4d).
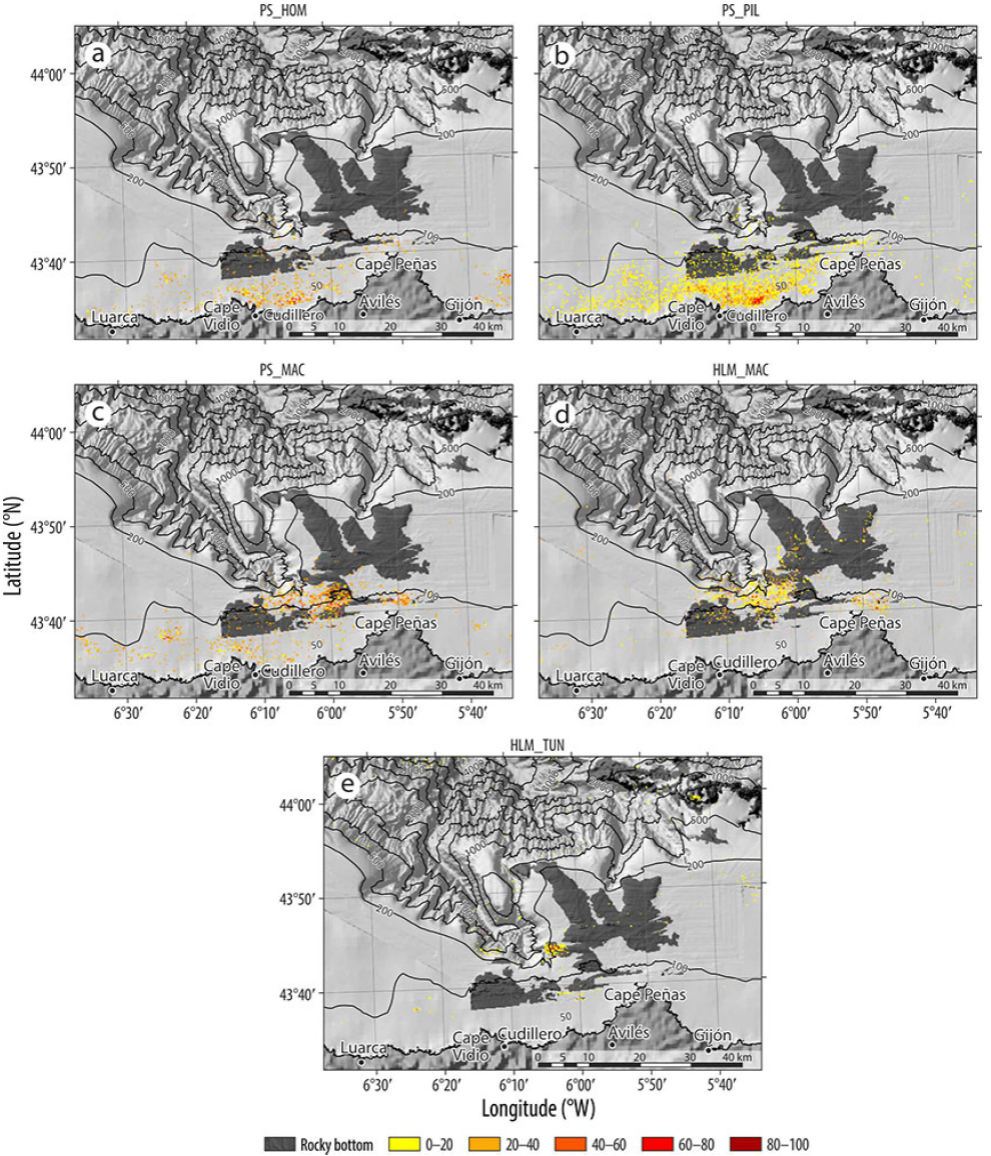
The spatial distributions of the purse seine fishing techniques targeting horse mackerel and sardine were very similar because the fishing activity was carried out close to the shore and to the west of Cape Peñas (Fig. S5a-b). In the case of the fishery targeting mackerel, the fishing effort was concentrated in the middle of the continental shelf and close to the headwaters of the canyon (Fig. S5c). As for seasonality, all of the fishing tactics targeting mackerel were carried out during the first 4 months of the year.
In the case of handline fishing for mackerel, the effort distribution was very similar to purse seine targeting the same species (Fig. S5d). The tactic targeting tuna was carried out in the rocky area located in the waters of Avilés Canyon and in El Agudo (Fig. S5e).
Discussion
On narrow continental shelves subjected to strong fishing pressure, as in the case of the study area, fishing tactics are used in different areas to share the space available and avoid friction caused by the spatial overlapping of fishing activities. In this context, and considering the strong spatial segregations observed in this study, the filters used to eliminate signals not corresponding to fishing activity were effective. The validity of these filters was checked by analyzing the spatial distribution of bottom trawling because this fishing gear can be used only on sedimentary bottoms and is subject to specific legal regulations. Once filtering techniques were applied, trawling was not observed at depths above 100 m (closed zone to bottom trawling in Spanish territorial waters in the North Atlantic) or in harbor entrances. The fleet using bottom trawling cannot operate in rocky areas and, as we observed, bottom trawling fishing tactics were not used on rocky bottoms.
In the case of fishing gears already described in previous studies, the same structure was obtained for the fishing tactics (Castro et al. 2010, Punzón et al. 2011). Among those identified, mixed gillnet (GNSMIX) should not be considered a fishing tactic even though it presents a high partial silhouette coefficient value (Table 2). This high value can be attributed to the inclusion of a large number of under-represented species in the "other" group. In addition, it was necessary to take into account that the main bycatches were hake and monkfish and that the spatial distribution of GNS_MIX appeared to be the result of the GNS_HKE and GNS MNZ distributions, so it was probable that catches from the latter tactics were being included in the first.
Using statistical rectangles to define if a fishery should be considered a deep-water fishery, like LLS COE, may be problematic in narrow continental shelves (Punzón et al. 2011). As we have observed, the activity of this fishery takes place along the entire continental shelf, including the area close to the 500-m contour line, and for that reason it should be considered a deep-sea fishery. Therefore, the VMS is a powerful tool to characterize the fisheries in narrow continental shelves, especially for fisheries operating in areas of special interest where spatial management measures are to be implemented.
In the reviews conducted by Piñeiro et al. (2001) and Punzón et al. (2011), the authors identified 2 deep-water fisheries in the Northeast Atlantic region: GNSMNZ and OTBMIX. In the case of GNSMNZ, the fishing effort was located below 500 m depth, while in the case of OTBMIX, the fishing effort deeper than 500 m was carried out only in the western region and was not very intense. Although some fishing activity of PTBWHB and LLSHKE was observed close to the 500-m contour line, we could not determine whether these activities should be considered deep-water fisheries or not because it was not clear whether they were carried out below 500 m depth.
The spatial distribution of fisheries by type of fishing gear showed that they barely interacted in the study area, at least not in zones with the highest fishing effort. This small overlap implies that almost all the study area is subject to fishing effort; however, there is little competition between the fishing techniques for common resources. The almost non-existent overlap among the various types of activity will further serve to allocate fishing techniques with pings that were not used in the past due to the lack of logbook information (Russo et al. 2011).
Of the 2 trawling techniques used in the area, otter trawling was carried out in larger areas. This distinction was due to the fact that bottom otter trawls are smaller longitudinally and narrower at the mouth, so this fishing gear can be handled more easily. In other words, because of its better handling qualities and minor surface contact, this fishing gear can be used in narrower and rougher fishing grounds. Bottom otter trawls can also be used in the same fishing grounds where pair trawling is being carried out. However, in these areas, otter trawling activity was low. The main reason was that pair trawling targeted blue whiting, a species inhabiting the break shelf (Castro et al. 2010), but it ceased to be the target species at the beginning of the 21st century (Punzón et al. 2010). Since these fisheries did not compete for the same resource, they operated in different locations. Both trawling techniques were limited to specific areas, and they were carried out at a constant depth following the bathymetry to avoid affecting artisanal fisheries. The region located on the east side of the study area had a wider continental shelf and a smoother sea bottom. In this area, trawling patterns were changeable compared with the shelf break and rocky zones. This was possible because of the small number of artisanal fisheries operating in the western region of the continental platform, leaving this area to be used exclusively for trawling. However, the number of fisheries increased considerably in the shelf breaks, so the trawling patterns became more regular.
The main spatial overlap between fishing tactics was observed between gillnets targeting monkfish and longlines targeting hake in the rocky outcrop called El Agudo. The bulk of the fishing effort exerted in this area was related to gillnet fishing, whereas the activity related to longline fishing was of less importance. To determine the extent of the interaction between the different fishing gears in the area, we need further information about the characteristics of the local fishing fleet.
It is worth mentioning that the different fishing tactics were located in distinct areas depending on the sea bottom characteristics and, in the particular case of sandy bottoms, on the substrate type. Thus, the spatial distribution of the different tactics and fishing gears used was strongly influenced by this variable in the study area, affecting the way the fishing activity was interpreted. For instance, GNS_HKE was present in the rocky area where information about the sea bottom was available, whereas in the western part of the continental shelf, where we did not have information about the bottom type, its spatial distribution appeared to be related to a specific type of sea bottom. Thus, it was difficult to define the spatial interactions between fishing gears when this information was not available.
Hake, mackerel, and horse mackerel were targeted by more than one fishing tactic in the study area. In the case of hake, the spatial overlap between the two tactics (LLS_HKE and GNS_HKE) was not important. Therefore, hake was caught by longline gear in the head of Avilés Canyon, whereas gillnetting was used in the rocky area in front of Cape Peñas and in the western area between 100 and 200 m depth. Spatial overlap was only found at El Agudo, although the longline efforts were very low in this zone.
From the end of winter to early spring, the main fishing effort in the southern part of the Bay of Biscay is directed at mackerel during its reproductive migration (Uriarte and Lucio 2001, Villamor et al. 2011). Most of the fishing gears employed in the area are used to catch mackerel (Punzón et al. 2004). This pattern could have led to a decrease in the fishing efforts of other fishing tactics, but it was only observed for bottom trawling targeting mackerel from February to March. The fishing activity of all the tactics directed at mackerel was located on the continental shelf surrounding Cape Peñas. Fisheries targeting small and medium pelagic fish generally operated in offshore waters. Only purse seine fishing was carried out close to the coast, but the bulk of the fishing effort was located beyond 100 m. This pattern might be explained by the fact that the targeted species has to round Cape Peñas during its migration from east to west, resulting in higher abundances of this species on the mid and outer continental shelf.
The use of VMS information together with information from logbooks allowed us to study not only the spatio-temporal pattern of fishing activity but also fundamental aspects of fisheries management and the ecosystems affected by this activity. In this context, we can gain knowledge of the ecosystem structures with respect to commercial species, including information about non-accessible areas for research surveys carried out in the study area based on trawling hotspots (Sánchez and Serrano 2003), which were spatially limited to sedimentary bottoms and temporarily limited during autumn. Moreover, this research allowed us to study the behavior of commercial species because the VMS signals associated with a specific catch can be interpreted as the presence of the species. The use of this information in combination with environmental data obtained from other sources could lead to a better understanding of the environmental conditions in which these catches are carried out.
Finally, by knowing the distribution patterns of fishing activity and the biological and environmental variables determining these distributions, we could predict their responses to different management measures. Thus, we could simulate the effect of different fishing effort distributions in the area before establishing MPAs if fishing activity were modified or if mutually exclusive activities were carried out. This knowledge will allow us to estimate the social and economic impacts on fishing activity as well as on the mortality of the targeted species.