


 texto en
  Inglés (pdf)
 Artículo en XML
 Referencias del artículo
 Enviar artículo por email
 Citado por SciELO
  Similares en
SciELO
Similares en
SciELO 
 Permalink
Introduction
The interaction between aquaculture activities and water quality is a long-known issue. While the volume and quality of the harvest, and even the viability, of a fish farm depend on the quality of the water in which it is placed, fish rearing activities are also a potential source of water quality deterioration, contributing a number of different types of substances to the aquatic environment. These might include plastic and metallic structures, uneaten feed, metabolic products, chemicals, microorganisms, parasites, or feral organisms (Soto et al. 2001, Hindar et al. 2006, León 2006, Mente et al. 2006).
Several studies have identified the introduction into the aquatic environment of residues containing organic matter and nutrients (mainly nitrogen and phosphorus), resulting from the uneaten feed and the fecal pellets and liquid excretions of the fish, as the most evident cause of environmental impact by cage farms (see references in Maldonado et al. 2005, Ruiz et al. 2010).
With the perspective of a continuously growing industry (FAO 2014), it is fundamental to advance in the knowledge of how such an activity may affect a given waterbody, so that the economic and social benefits linked to aquaculture development can be attained in a sustainable manner, without risking the degradation of local natural water resources.
The assessment of the environmental impact of fish farms is complex due to the large number of variables (climatic, hydrographic, biological, technological, and social) that intervene, and numerical simulations are often called for. For this, many numerical models have been recently developed, mostly focused on the benthic impact in areas close to the farms. Gowen and Bradbury (1987) developed a simple model to estimate the area affected by uneaten feed and fecal pellets in a waterbody with barotropic circulation; this model was improved and upgraded by Gowen et al. (1989, 1994), allowing a realistic bathymetry and a 3D current field to be considered. Ervik et al. (1997) presented the MOM (Modeling-Ongrowing fish farms-Monitoring) system that can be used to adjust the local impact of marine fish farms to the waterbody's carrying capacity. Panchang et al. (1997) used hydrodynamic and transport models to simulate the dispersion of particulate wastes in coastal Maine (USA). DEPOMOD (Cromey et al. 2002a) predicts the deposition pattern of solid aquaculture wastes on the bed and allows estimating the resulting changes induced in the benthic biological communities. Doglioli et al. (2004) coupled a hydro-dynamic model (POM) to the LAMP3D Lagrangian code to simulate the 3D transport of dissolved nutrients, fecal pellets and uneaten feed in the Ligurian Sea (Italy), and Skogen et al. (2009) used the NORWECOM system to reproduce the effects of salmon culture in a Norwegian fjord. Finally, Symonds (2011) and Moreno et al. (2011) combined hydro-dynamic codes and Lagrangian transport modules to simulate fish farm waste dispersion in tidally-dominated areas during short periods of time (15 days). A description of these and other models developed in this field can be found in Chaperón (2015).
Many of these models have been implemented under very simplified conditions (e.g., simple bathymetry and/or hydrodynamics, constant waste generation, etc.), yielding a simple and unrealistic description of the real system. As an example, only Skogen et al. (2009) used a fully 3D current field to simulate the transport of the fish farm wastes, whereas the rest used a 2DH or quasi-3D hydrodynamic scheme, or simply used constant or uniform currents derived from pointwise measurements.
In this study we try to go a step further by using a fully 3D hydrodynamic model and a Lagrangian transport code to simulate the time-varying impact of the solid wastes generated by a gilthead seabream fish farm in the western Mediterranean, considering the changes in fish feeding behavior (and, thus, in waste production) throughout the complete cultivation cycle that, in this region, lasts about 17 months. The study focuses only on physical transport processes, and does not consider other processes such as fractionation and remineralization of organic matter (e.g., Cromey et al. 2002b), or the use of organic matter by various organisms to generate live biomass (e.g., Karakassis et al. 2000).
Materials and methods
Study area
This study focuses on a 113 x 280 km2 subregion of the Valencia Gulf on the Spanish Mediterranean coast (Fig. 1), between 37.8°N-40.4°N and 0.6°W-0.7°E. The maximum depth within this domain is about 1,400 m. The analysis of data from a current meter belonging to the deep-water observational network of Puertos del Estado (Spanish National Harbor Administration), located inside the study area (39.46°N, 0.26°W), allows identifying the hydrodynamic and meteorological characteristics of the region. The dominant SSW currents, with maximum speeds of 30-35 cm s-1, are driven by the mesoscale circulation (Castellón et al. 1990), although water flow in the opposite direction is also important. Salinity is relatively stable around 38, whereas water temperature fluctuates between a minimum of 13 °C in February and 28 °C in July.

Figure 1 Map of the study area, including the position of the fish farm considered and the location of the Puertos del Estado deep-water buoy. The dashed lines show the 3 computational domains used for the simulations.
Within this area, the loading of particulate wastes from a fish farm on the Valencia Gulf sea bottom has been studied. The farm (farm S in Fig. 1; 39.0284°N, 0.1272°W) is located in waters about 40 m deep and 6.4 km from the coast. It is composed of 42 circular fish pens, 10 m deep and 16 m in diameter, distributed over 0.5 km2. The reared species is gilt-head seabream (Sparus aurata), and it is assumed that the harvest yields 5001 of fish per year. These features are those of a previously existing seabream farm that is currently out of operation.
Numerical models
Two models were used for the simulations. The first one, used for the hydrodynamic modeling, is the AGRIF version (Blayo and Debreu 1999) of the ROMS code (Shchepetkin and McWilliams 2005), a free-surface finite-differences model that solves the primitive equations using a Boussinesq simplification and a hydrostatic assumption. To assess the validity of the numerical model, the currents provided by ROMSAGRIF for the December 2004 to November 2005 period were qualitatively compared to the data measured by the Puertos del Estado buoy. Unfortunately, a quantitative comparison between observed and modeled time series was not possible since only statistical information (current roses and frequency histograms) was available for these measurements.
The dispersion of the fish farm particulate wastes (fecal pellets and excess feed) was simulated using LIMMIX (Mestres 2002), a Lagrangian code that disperses particles according to different transport mechanisms by solving a discretized version of the 3D Fokker-Planck equation. The code has been applied with success to several scenarios (Mestres et al. 2003, 2010).
Characterization of the fish farm residues
The daily volume of fish farm particulate residues during the 17-month cultivation period was estimated using the experimental feeding coefficients (i.e., weight of food per 100 kg of biomass) obtained by Mingarro (2004) for the intensive farming of gilthead seabream in Mediterranean waters (Fig. 2). These coefficients have been corrected by assuming that approximately 5% of the food supplied to the fish is not consumed. This percentage is considered a typical value for wasted feed (Vassallo et al. 2006), although the actual losses may vary from a smaller fraction for highly technified Atlantic salmon farms to up to 20% for smaller and less mechanized facilities.
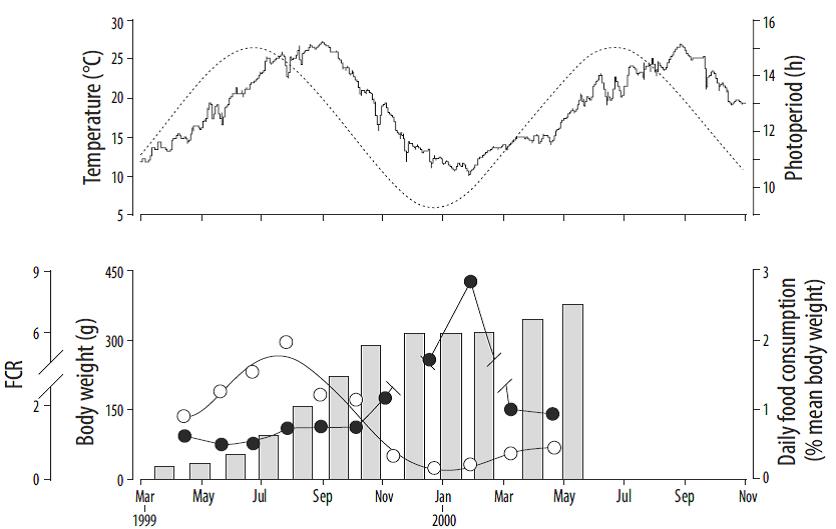
Figure 2 (Top panel) Seasonal variations of photoperiod (dashed line) and temperature (full line). (Bottom panel) Body weight (bars), food consumption (○), and feed conversion rate (FCR, ●) for the fish farmed during the complete experimental period (adapted from Mingarro 2004).
The mass and composition of the organic wastes is calculated from the total mass of feed supplied (M) and the weight gain of the product (ΔB), in terms of percentages. Based on several authors (Wallin and Hakanson 1991, Findlay and Watling 1994, Lupatsch and Kissil 1998, Doglioli et al. 2004), the content of N, P, and organic C in the feed can be taken, respectively, as 6.5%, 1.3%, and 45% of the total typical feed mass. According to Meske and Manthey (1983) and Doglioli et al. (2004), the amount of N and P that remains within the fish is, respectively, approximately 3% and 0.4% of the fish body weight. With these values, and recalling that 5% of the feed goes uneaten, the mass of N and P introduced into the aquatic environment in the form of excess food and excreted products can be estimated. Furthermore, 78% of the N and 27% of the P of the excretions are in the form of diluted matter, whereas the rest is in the form of particulate matter (Lupatsch and Kissil 1998). By introducing subscripts to identify the mass of a particular nutrient that is consumed (c), uneaten (u), trapped in the biomass (B), or excreted (exc) in diluted (d) or particulate (p) matter, the previous relations can be expressed as equations:
where
On the other hand, and assuming that 28% of the weight of fecal pellets is made of carbon (Findlay and Watling 1994) and that the daily production of such residues can be taken as 1.9 g per kilogram of biomass (Dudley et al. 2000), the daily C input into the environment can be estimated as
This quantification is based on the composition and digestibility of typical feed, but the exact percentages and assimilation rates are feed-dependent and might lead to slightly different metabolized and excreted fractions.
Another factor to be considered is the settling velocity for both fecal pellets and uneaten feed. Uneaten feed settles about 3 times faster than fecal pellets (Gowen et al. 1989), with settling velocities between 6 and 14 cm s-1 for food pellets (Panchang et al. 1997, Doglioli et al. 2004, Vassallo et al. 2006, Piedecausa et al. 2009), and ranging from 0.05 to 7.5 cm s-1 for particulate feces (Panchang et al. 1997,
Doglioli et al. 2004, Piedecausa et al. 2009). Based on these studies, the settling velocities considered herein were 10 cm s-1 for excess feed and 2 cm s-1 for fecal pellets throughout the entire simulation. Actual settling velocities, however, are expected to change in time since the increase in fish size will lead to changes in their diet (i.e., different feed pellets) and also to larger fecal particles.
Configuring the simulations
Three nested computational domains were defined (Fig. 1) that allow downscaling from a 1,730-m horizontal resolution (1/50°, compatible with the climatological forcing data sets) to a resolution of about 187 m, permitting a detailed description of the study site. In the vertical direction, all domains were discretized into 20 σ-layers. A Laplacian scheme was chosen for the horizontal mixing, whereas the vertical mixing was described using an LMD K-profile parameterization approach. Flather and Orlanski open boundary conditions were used for 2DH and 3D variables, respectively. For these simulations, the bathymetry was obtained from the ETOPO2v2 database (National Geophysical Data Center 2006), water temperature and salinity from the WOA05 dataset (Antonov et al. 2006, Locarnini et al. 2006), and tidal and climatological surface forcings were obtained from the TPX06 (Egbert and Erofeeva 2002) and ICOADS (Woodruff et al. 2011) datasets, respectively. The simulated period was extended for 17 months (March 2004 to July 2005), and provided daily averaged 3D currents and temperature and salinity distributions.
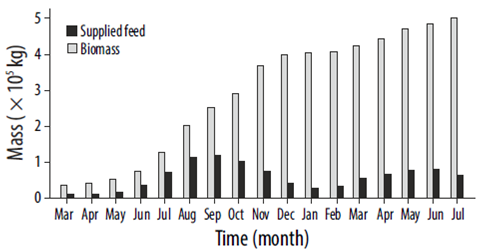
To model the waste dispersion, independent simulations were done for uneaten feed and for fecal pellets. Particles were released at each fish pen every 60 s for the former and every 300 s for the latter. The number of particles released at each step depended on a predefined feeding pattern that assumed that feed was provided twice a day during the warm months (May to October) and once a day during the cold months (Mingarro 2004). It was also assumed that the production of fecal pellets started immediately after the feeding time, with the same duration (1 h). The amount of feed supplied was constant for each month, with values defined by considering Figure 2 and the expected final production, 500 t (Fig. 3). Full details of the modeling setup can be found in Chaperón (2015).
Results
Figure 4 compares the measured and modeled currents at the Puertos del Estado buoy between December 2004 and November 2005. Although there is a fair overall agreement in terms of flow magnitude and predominant directions, the modeled results tend to overestimate the current speed and the frequency of WSW flows. However, the main flow directions (i.e, SSW-S and N-NE) are well reproduced. The discrepancies can be attributed to several factors, such as the coarse vertical resolution of the grid, and the fact that the model is initialized and forced with climatological values rather than with measured data. Considering this, the hydro-dynamic model results are deemed acceptable for the purposes of this study.
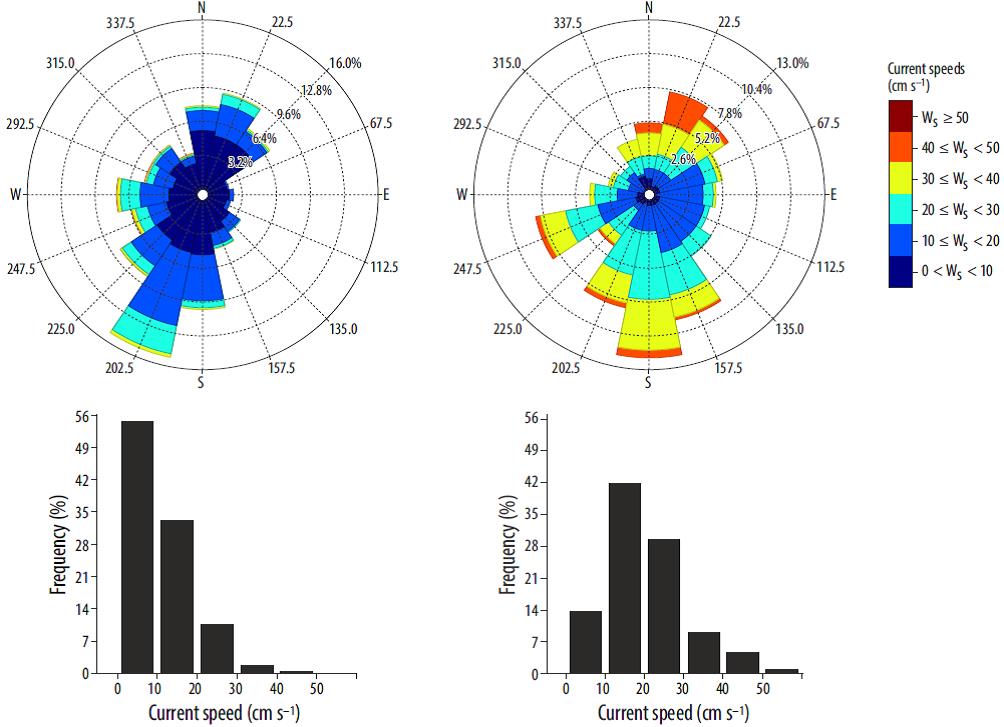
Figure 4 Current roses (top) and current histograms (bottom) at the Puertos del Estado buoy position for the December 2004 to November 2005 period. Data measured by the buoy (left) and modeled by ROMS_AGRIF (right). Ws denotes the velocity of the current.
Figure 5, based on Figure 3, shows the time distribution of C and nutrients entering the waterbody due to fecal pellets and uneaten feed during the simulated period. The mass contribution of the uneaten feed is always smaller than the mass input from fecal particles. This is particularly true for C during the second half of the rearing cycle, in which the fraction of fecal C can be up to 91% of the total (with an overall mean of 74.5%). Both nutrients show a very similar behavior, with a fecal input between 37.5% and 78.5% of the total N (with a 71.89% mean), and between 50% and 100% for P (with a 85.7% mean).

Figure 5 Organic matter (C) and nutrients (N and P) released monthly from the fish farm during the 17-month rearing cycle.
As particulate residues settle, the extent of the seabed affected increases with time. The growth of this area is plotted in Figure 6 (top) for both fecal pellets and uneaten feed. In Figure 6 (bottom) the shape and extension of the area affected by the particulate wastes is shown for different simulation times. By the end of the simulation (day 510), the results show that the accumulation of uneaten feed below and around the seabream farm almost covered a rectangular area of about 0.6 km2. On the other hand, settled fecal pellets extend over a larger seabed region, covering an area of about 1.7 km2 (over 2.5 times that of uneaten feed) by day 510.
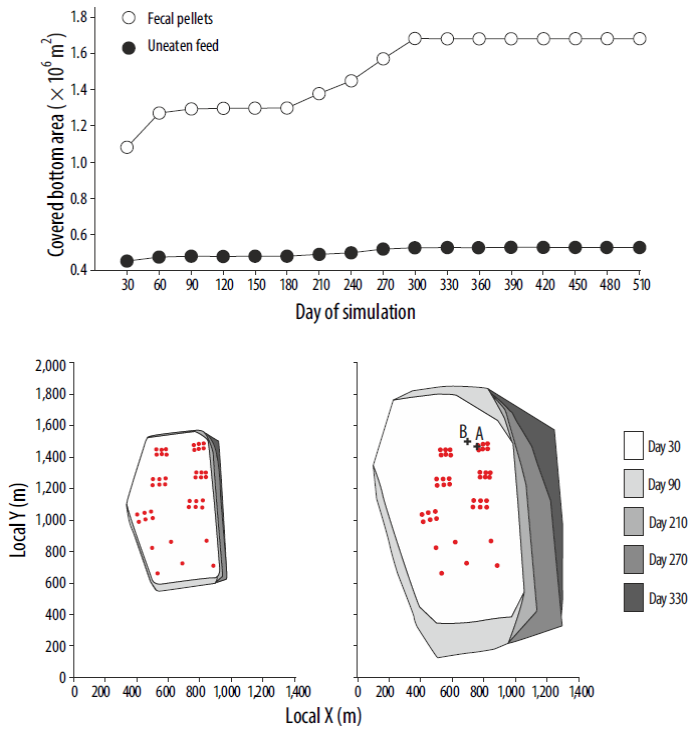
Figure 6 (Top) Area of the seabed affected by the particulate wastes settling from the fish farm during the complete simulation period. (Bottom) Shape and extension of the area affected by the uneaten feed (left) and fecal pellets (right) at different simulation times. The red dots show the position of the fish cages. Labels A and B in the bottom right-hand plot denote the positions at which concentration values were extracted for Figure 7 (bottom).
Although it seems that the total area affected by settled fecal pellets has become stationary after 3 months (day 90), there is a gradual increase (up to 30% for fecal pellets) after day 180 (Fig. 6, top). This increase could be related to the onset of typical fall/winter oceanographic conditions around day 210, which leads to a change in direction of the predominant currents. This resulted in an eastward shift of the deposition area for both fecal pellets and uneaten feed (Fig. 6, bottom). Focusing on each individual fish cage, the particle settling distribution is mainly oriented in a NNW-S direction, coinciding with the dominant flow directions (Fig. 4). Furthermore, the uneaten feed appears to settle within a distance of 100 m from the fish cage position, whereas the fecal pellets might travel up to 500 m from the cage before settling on the seabed.
Figures 7 and 8 show the total benthic concentration of C and P in the farm region, assuming a conservative behavior in which changes in concentration are due only to physical transport processes. For both nutrients and during the first months, high concentration values are spatially restricted to areas below or very close to the clusters of fish pens (between 100 and 500 m), due to the weaker summer flow conditions that allow particle settling at relatively short distances from the source. As the current field becomes more energetic at the end of the summer, the areas of maximum concentration shift away from the fish cages, increasing the extent of the seabed affected by waste deposition. The fact that most of the nutrients and, particularly, organic matter reaching the seabed comes from the fecal pellets, which are more dispersive than uneaten feed, contributes to enhance the changes in spatial particle distribution. At the end of the 17-month period, the maximum C concentrations are locally around 1.2 kg m-2, whereas the larger part of the particle-covered bottom surface presents concentrations smaller than 0.4 kg m-2. Accumulation of N shows a spatial distribution similar to that of C, although its values are an order of magnitude smaller, ranging between maxima of about 0.14 kg m-2 and a "background" value of approximately 0.01 kg m-2. Finally, the concentration of P varies from 0.10 kg m-2 near the pens to minimum values below 0.01 kg m-2 in the periphery of the affected surface.

Figure 7 (Top and center) Spatial distribution of C on the seabed at 4 different times during the simulation period (clockwise from top left: days 30, 150, 300, and 510). Note that the colorbar scale is different for each figure. (Bottom) Concentration (full line) and mean daily flux (dashed line) of C at 2 positions depicted in the bottom right-hand panel of Figure 6.
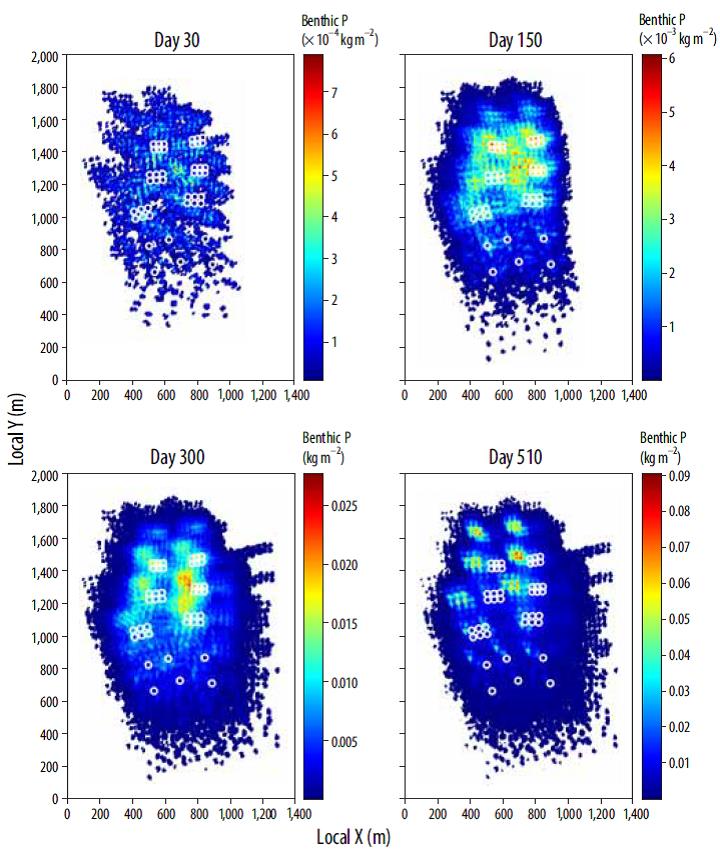
Figure 8 Spatial distribution of P on the seabed at 4 different times during the simulation period (clockwise from top left: days 30, 150, 300, and 510). Note that the color bar scale is different for each figure.
The time variability of the mean daily C deposition flux at 2 positions (A and B in Fig. 6) is shown in Figure 7 (bottom). At A, close to the cages, the bottom settling flux is typically less than 0.2 kg m-2 per day during the whole simulation. For the last 2 months, however, it is significantly higher, reaching a peak of 0.7 kg m-2 per day during month 16 (day 480). On the other hand, carbon deposition rates at B are much smaller during the first 10 months, but increase drastically between months 11 and 17, peaking at around 1.5 kg m-2 per day on month 14.
These different settling fluxes reflect in the concentration values. The concentration of benthic C at position A increases steadily for the first 8 months, remains almost stationary between months 8 and 15, and then increases again in the last 60 days of the simulation. At position B (60 m farther from the cages than A), the concentration is significantly smaller during the first 10 months (less than 20% of that at A between months 5 and 10), but increases drastically during the second half of the simulation period (months 10 to 17). At the end of the rearing cycle, the amount of C accumulated at B is about twice that at A, although it triples during months 14 and 15.
Discussion
The results show that the benthic surface affected by the deposition of uneaten feed and fecal particles can be more than 3 times as large as the area occupied by the fish farm, although the concentration of C and nutrients (N and P) in this region is generally small. The highest concentrations are found relatively close to the individual fish pens, within a 100-m radius, but this distance depends strongly on the physical characteristics of the waste particles and on the variability of the prevailing water currents. The abundance of C at the seabed in this area modifies the redox potential (turning it more negative, Morata et al. 2015) and increases the metabolism of the sediment, enhancing also oxygen consumption. This can lead to an alteration of the distribution, type, and physiological activity of the benthic communities. Morata et al. (2015), for instance, found a notable decrease in specific richness and a 9-fold increase in abundance under a NW Mediterranean seabream farm, similar to the one considered here, as compared to a control station.
The model output also shows that fecal pellets cover a larger area than uneaten feed, which settles closer to the sources due mainly to its higher estimated fall velocity but also to other factors such as the local water depth and bottom slope, or the absence of a significant tidally-induced circulation. By combining the time evolution of the different types of particle with their chemical composition it is seen that, after the first months of the rearing cycle, the increase in the concentration of nutrients and, particularly, of organic matter is due essentially to the fecal pellets, with uneaten feed representing a relatively small contribution. Although a conservative behavior of the nutrients has been assumed, it is not expected for the overall conclusion to change significantly if a non-conservative approach is taken. This suggests that the benthic impact due to uneaten feed is relatively small compared to that of excreted particles and, thus, from an environmental standpoint, the efforts invested in increasing the digestibility of food pellets might be more worthwhile than improving the feeding systems to minimize feed losses.
These results highlight some limitations of the aquacul-ture pollution control protocols currently in use. These are based on the analyses of sediment samples taken at predefined control points and at specific times. However, if no a priori information is available on where the waste might accumulate, the selection of easily accessible but representative sampling points might be a difficult task. Often, sampling will be replaced by estimations done using simplified models (e.g., based on one-day current data, constant waste production, uniform bathymetry) that only provide a simple description of the real problem. Nevertheless, and as opposed to this approach, Figures 6 and 7 (bottom) illustrate the importance of using realistic long-term hydrodynamic variability when estimating the environmental effects of fish farms, since they can differ considerably from the impact derived from a set of fixed control points at particular times.
The approach developed herein shows some novelties in relation to previous modeling studies. The length of the simulation period, encompassing an entire 17-month rearing cycle, and the inclusion of a variable fish feeding pattern that takes into account both daily and seasonal variations, have not been found before in our review of the scientific literature. On the other hand, some limitations of the presented methodology are also evident. The use of global climatologi-cal data to force the hydrodynamic model allows this procedure to be applied at any location, but introduces a source of error that can be significant. In the Valencia Gulf, the currents are strongly governed by the local topography, so the model and the observations are statistically similar, but this might not be the case in complex domains. Limitations of the dispersion code (e.g., constant settling velocities for the pellets, the absence of resuspension, conservative behavior of nutrients ignoring the fractionation and remineralization of organic matter and the effects of various types of organisms), together with the validation of the model, are issues that will be addressed in the near future.
In spite of this, the methodology presented has proven to be a potentially useful tool to assist in the planning and management of processes related to monitoring and control of water and sediment quality associated with aquaculture activities, optimizing field campaigns and reducing economic costs.

