


 texto em
  Inglês (pdf)
 Artigo em XML
 Referências do artigo
 Enviar este artigo por email
 Citado por SciELO
  Similares em
SciELO
Similares em
SciELO 
 Permalink
Introduction
The San Benito Archipelago (SBA) is the only site in Mexico where four pinniped species coexist: the northern elephant seal, Mirounga angustirostris; the California sea lion, Zalophus californianus; the Guadalupe fur seal, Arctocephalus philippii townsendi; and the harbor seal, Phoca vitulina. The first two species are the most abundant (Angell 2014) and occupy these islands for important life-history events, such as breeding or molting (Aurioles-Gamboa and Zavala 1994, Le Boeuf and Laws 1994, Garcia-Aguilar 2004a). This archipelago, situated on the west coast of Baja California, lies within these species' distribution range along the west coast of North America. Data from different locations are essential for understanding their geographic extent in regard to their presence in Mexico, where the southernmost colonies are located, and at higher latitudes (e.g., California, USA), where they are found in greatest abundance (Lowry et al. 2014).
The California sea lion (CSL), Zalophus californianus, is a member of the Otariidae family and sentinel of several ecosystem conditions (Szteren and Aurioles-Gamboa 2013). It inhabits the eastern North Pacific, particularly the islands off the coast of California and Baja California, reaching a total population of around 350,000 individuals: 238,000 off California (Carretta et al. 2007), 75,000-87,000 on the west coast of Baja California (Lowry and Maravilla-Chávez 2005), and ca 25,000 in the Gulf of California (Szteren et al. 2006). The CSL breeding season takes place from June through August; it begins earlier and lasts longer in the Gulf of California than on the coast of California (Garcia-Aguilar and Aurioles-Gamboa 2003a). Most adult males complete a post-breeding season migration north from the major rookeries in southern California and Baja California, wintering from central California to Washington State (USA). A smaller number of animals migrate as far north as British Columbia and southeast Alaska, reaching the northern Gulf of Alaska, the Alaska Peninsula, and the eastern Aleutian Islands. Other animals appear to remain in the Gulf of California year-round and do not undertake long migrations (Peterson and Bartholomew 1967, Le Boeuf et al. 1983, Elorriaga-Verplancken et al. 2013).
The northern elephant seal (NES), Mirounga angustirostris, a member of the Phocidae family, is found only in the Northern Hemisphere, particularly in the eastern and central North Pacific. Breeding sites are mostly on offshore islands and at few mainland locations from central Baja California (Mexico) to Oregon (USA). Twelve breeding colonies are well known and located on the islands of southern California and Baja California (Le Boeuf and Laws 1994, Garcia-Aguilar 2004b). NESs complete two migrations to their rookeries during the year, one in late winter (December-March) to breed and a second migration to molt. The latter migration occurs during the warm season (spring/ summer), but the duration varies by sex and age. Once the breeding season ends, females move to foraging areas for about 70 days before returning to land for one month to molt; after the molt they return to foraging areas for another eight months before going back to their breeding colonies to give birth. Adult males spend about four months at sea following the breeding season, returning to shore to molt during summer; after molting for a month, they go back to sea for four months before returning to their breeding colonies to mate (Stewart and DeLong 1994, Berta et al. 2006). The NES population was on the edge of extinction at the end of the 1800s; only a few dozen individuals survived commercial harvesting (Stewart et al. 1994). During the 1900s, the species began to recover and recolonize sites they had inhabited prior to being hunted. This was accompanied by rapid population growth, reaching a current population size of 210,000-239,000 individuals (Lowry et al. 2014).
This study provides the first continuous register of Z. californianus and M. angustirostris in Mexico during contiguous years (breeding seasons of 2012, 2013, and 2014), and also a semi-continuous register throughout a single year (five censuses during 2014). This study contributes information that improves our understanding of these species' occupation of the SBA, a priority area for conservation in Mexico. The goal of this work was to assess this southern portion of the CSL and NES populations by assessing total abundance and abundance by sex and age classes over a three-year period, as well as these species' trends, based on historical censuses.
Materials and methods
The SBA (28.30°N, 115.56°W) is situated 30 km northwest of Cedros Island and 75 km west of the Baja California Peninsula, Mexico (Fig. 1). This archipelago covers a total area of 6.4 km2 (Boswall 1978, Junak and Philbrick 1999) and is composed of three volcanic islands: San Benito East (SBE), San Benito Middle (SBM), and San Benito West (SBW).

From 2012 to 2015, the colonies were monitored in summer and winter, during both species' breeding seasons (summer for CSL and winter for NES), and in 2014, five censuses were conducted during the course of the year. A total of 17 censuses (8 for CSL and 9 for NES) were carried out on the following dates: 31 July-12 August 2012; 6-14 February and 2-11 July 2013; 4-13 February, 30 April-5 May, 30 June-6 July, 11-14 September, and 5-9 December 2014; and 17-24 February 2015 (only for NES).
Censuses were conducted in two ways using techniques commonly employed in pinniped surveys (Le Boeuf et al. 1983, Aurioles-Gamboa and Zavala 1994, Aurioles-Gamboa et al. 2010, Angell 2014). A walking survey was performed once per trip on SBM and SBW (3.5 and 10.4 km, respectively), approaching colonies with caution in order to avoid startling the animals and causing them to move towards the sea. SBE was censused once per field trip (7.5 km) from a boat at an average distance of 30 m to avoid provoking stampedes. The same methodology was used during all censuses to ensure consistency. These two different census techniques (i.e., by foot and boat) were complementary; each maximized the census efficiency for the specific location in question, by recording the highest number of animals possible at each location (Aurioles-Gamboa et al. 2010).
Individuals of the two species were classified into five categories based on age and sex: pups, juveniles, subadult males, adult males, and adult females. All animals not fully identified were grouped as miscellaneous (Aurioles-Gamboa et al. 1983, 2010; Le Boeuf and Laws 1994; Angell 2014). We did not separate among subcategories of CSL and NES subadult males.
Correction factors
Pinniped censuses have been found to underestimate the actual population size; however, correction factors published by other researchers can be applied to the data to mitigate this underestimation. For the breeding season (July-August), we applied the correction factor proposed by Le Boeuf et al. (1983) on the census data of CSL pups (+50%) that were counted from the boat (SBE) in order to compensate for walking effort and hidden pups. Following Bonnell and Ford (1987), a different correction factor was applied to the census data of all CSL adult females (+23% in July and +54% in August), on the assumption that a portion of the female population was feeding at sea.
Additional correction factors to obtain the colony sizes were applied for the most recent breeding seasons: July 2014 for CSLs and February 2015 for NESs. The number of counted CSL pups was multiplied by the inverse of the proportion of pups in the colony (McCann 1985, Boveng 1988); a known proportion (0.209) of CSL pups for the west coast of Baja California was used for this approach (Lowry and Maravilla-Chávez 2005). A minimum CSL colony size was also estimated, in a conservative manner, as twice the number of pups (corrected by the Le Boeuf et al. [1983] criteria) plus the rest of individuals of other categories (adult males, sub-adult males, juveniles, and miscellaneous). In the case of NES, adult females are not on land at the same time during the breeding season (Reiter et al. 1981, Rothery and McCann 1987, Condit et al. 2007). In this regard, we used the model developed by Rothery and McCann (1987), also used by García-Aguilar (2004b), to describe the temporal distribution of NES females at SBA. This model provides a correction factor, which represents the expected proportion of females on land on a given date, relative to the total number of females that were present at SBA during the whole breeding season (Galimberti and Sanvito 2001). Based on this model for NES, the expected proportion of adult females on 17-24 February 2015, relative to the total number of adult females that arrived at SBA during that entire breeding season, was 13.68%. Since García-Aguilar (2004b) estimated that 76% of all adult females from SBA give birth, the total number of pups was calculated from that proportion. The minimum size of the colony was calculated, in a conservative manner, as the sum of pup production plus the total number of adult females (both based on the García-Aguilar [2004b] criteria) plus the rest of the categories (adult and subadult males).
Analyses of trends for both species
Historical countings of CSL (Lowry and Maravilla-Chávez 2005, García-Aguilar et al. 2013) and NES (Álvarez-Coronado 2003, García-Aguilar 2004a) pups were used to determine the trends for each species colony. The intrinsic rate of increase (r) was calculated by linear regression, where y (dependent variable) is the loge of the number of pups (historical and herein reported data) in the breeding seasons and x (independent variable) is time (years); r is the slope and the finite rate is calculated by λ = er (Caughley and Birch 1971, Caughley 1977).
Relative abundance during 2014
The relative abundance (RA) was calculated for the most abundant categories of each species during the 2014 samplings: RA = Cx,i /ni , where Cx,i is the number of animals in category x counted in census i and ni is the total number of animals (all categories included) counted in the census.
A x 2 test was performed to identify significant differences in CSL and NES abundance during different breeding seasons and throughout 2014.
Results
California sea lions at San Benito Archipelago
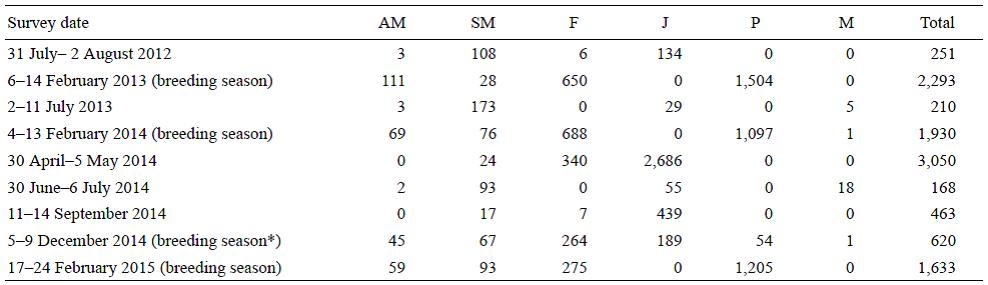
The highest abundance of CSLs was recorded in July 2012 (7,501 individuals), July 2013 (8,859 individuals), and July 2014 (7,136 individuals). Based on the criteria of Le Boeuf et al. (1983) and Bonnell and Ford (1987), the CSL abundance for each July was 9,420, 10,164, and 8,022 individuals, respectively. These values differed significantly from year to year (x 2 = 257, d.f. = 2, P < 0.05).
During 2014, the CSL census was performed every two to three months: in early February, May, July, September, and December. The greatest number of CSLs was registered in July, followed by September, December, February, and May (Tables 1, 2). Significant differences in CSL abundance were found between different months in 2014 (x 2 = 5,345, d.f. = 4, P < 0.05).
Table 1: Abundance of California sea lions (Zalophus californianus) per age and sex classes at San Benito Archipelago during 2012-2014: AM, adult males; SM, subadult males; F, adult females; J, juveniles; P, pups; M, miscellaneous.

Table 2: Correction factor (Le Boeuf et al. 1983, Bonnell and Ford 1987) for California sea lion (Zalophus californianus) adult females and pups during the breeding seasons (2012-2014).

Uncorrected/*corrected data
The additional correction factor (McCann 1985, Boveng 1988, Lowry and Maravilla-Chávez 2005), applied only for the 2014 breeding season, gave as a result an abundance of 13,885 pups and a minimum colony size of 7,633 CSLs.
Relative abundance by sex and age classes of California sea lions during 2014
In February 2014, 49% of the CSLs were pups and 39% were adult females. In May 2014, pups and females predominated (52% and 38%, respectively). The pattern continued in July, with the total population consisting mainly of pups (40%) and adult females (40%). In September and December 2014, pups made up the greatest proportion (62% and 64%, respectively) of the colony, followed by females (25% and 27%, respectively). None of the other classes (adult males, subadult males, and juveniles) ever accounted for more than 8% of the colony.
Northern elephant seals at San Benito Archipelago
The highest NES abundances were found during the 2013 (n = 2,293), 2014 (n = 1,930), and 2015 (n = 1,633) breeding seasons. Significant differences in abundance were found between different years (x 2 = 129.7, d.f. = 2, P < 0.05).
In contrast to CSLs, NESs were poorly represented during the summer in both 2012 (n = 251) and 2013 (n = 210) (Table 3). During 2014, the highest abundance (n = 3,050) was recorded in May, with a sharp decrease in July (n = 168), increasing again in September (n = 481) and December (n = 620) (Table 3). Significant differences in NES abundance were found between different months during 2014 (x 2 = 4,689.8, d.f. = 4, P < 0.05).
Table 3: Abundance of northern elephant seals (Mirounga angustirostris) per age and sex classes at San Benito Archipelago during 2012-2015: AM, adult males; SM, subadult males; F, adult females; J, juveniles; P, pups; M, miscellaneous.
* Beginning of the breeding season
Based on the criteria of Rothery and McCann (1987) and García-Aguilar (2004b), a total of 2,010 adult females and 1,528 pups were estimated during the 2015 breeding season (17-24 February). The minimum colony size was 3,690 individuals.
Relative abundance by sex and age classes of northern elephant seals during 2014
In winter (February 2014), the majority of the NES colony was composed of pups (57%), followed by adult females (35%). Adult and subadult males were also present in February (7%). Juveniles were the most abundant in May 2014 (88%). The population was at its lowest number during July, composed only of males and juveniles. In September 2014, the majority of the colony was composed of juveniles (95%). In December, females made up almost half of the population (43%), followed by juveniles (30%), adult and subadult males (18%), and newborn pups (9%).
Discussion
California sea lion
We recorded an abundance of 7,136-8,859 CSLs during their breeding season, suggesting that around 10% of the Baja California west coast population inhabits SBA. Prior studies in the area reported similar breeding season abundances of 7,790 in 2000 (Hernández-Camacho and Aurioles-Gamboa 2000) and 5,489 in 2007 (Pablo 2009). Of the different years examined here, 2013 and 2014 are the most comparable because we were able to collect data during similar dates for each year, within the breeding season. Relative to 2013, we observed a decline in CSL abundance in July 2014, particularly in terms of pups and adult females. It is difficult to determine the cause of this decline, but we hypothesize that the large-scale (2,000 km wide and 100 m deep) warming (1-4 °C above normal) event that ocurred in the Pacific Ocean in fall 2013 and again in spring 2014 caused a decrease in primary productivity and the subsequent prey availability (Kintisch 2015). Other researchers have reported females spending more time at sea and higher pup mortality during other warming events (Aurioles-Gamboa and Le Boeuf 1991). This Pacific warming has influenced prey availability (e.g., offshore sardine spawning) and it has been linked to record CSL mortality rates at southern California rookeries in 2013 and 2014 (NOAA Fisheries 2014).
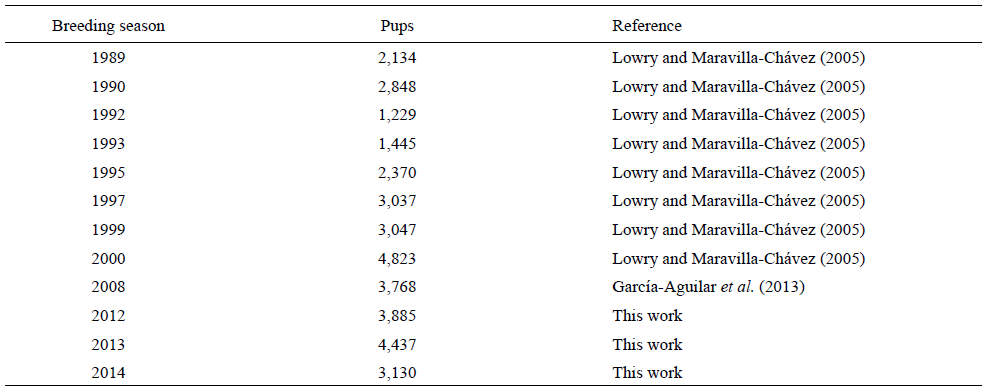
Based on historical countings of CSL pups (Lowry and Maravilla-Chávez 2005, García-Aguilar et al. 2013) and our data (Table 4), the SBA rookery showed an annual increase of 4.3% between 1989 and 1999 (r = 0.0421, R2 = 0.18, P = 0.35); however, a negative trend (-1.93%) (r = -0.0191, R 2 = 0.44, P = 0.23) was found during recent years (2000-2014). Since these variations were not significant, this rookery was catalogued as "stable". Since its status could eventually change, it is important to keep tracking this scenario over the next years.
Table 4: Historical counts of California sea lion (Zalophus californianus) pups at the San Benito Archipelago.
Intra-annual variation
The abundance of the CSL colony fluctuated throughout 2014; variations were mainly regulated by the number of newborn pups and the influx of adult females. The highest number of CSLs was recorded during the breeding season (summer), when most animals are on land. During this period, adult females give birth between late May and mid-July. The onset of pupping also explains the prior low abundance of females at the rookery in May, when a large number of females are still at sea, gathering resources ahead of the pupping season. In summer, newborn pups stay on land or near the shore for the first few months of life, and adult males are found in their reproductive territories or patrolling nearby (Peterson and Bartholomew 1967, Le Boeuf et al. 1983). Adult males were absent or scarce all year round except in July, when the ratio of adult female to male was 12.7:1 (2012), 6.5:1 (2013), and 7:1 (2014). These ratios are typical of polygynous mating systems and are similar to those reported in California (7-10:1) (Peterson and Bartholomew 1967) and the Gulf of California (6:1 and 11:1) (García-Aguilar and Aurioles-Gamboa 2003a).
Adult males begin their migration once the breeding season is over (Odell 1975), which explains their absence outside the summer season, while adult females displayed a high site fidelity during the same period of time. Subadult males represented a small percentage of the population year round, their abundance increasing from February to July, when the highest number was recorded. This pattern is the opposite in the southern Gulf of California, where young males are scarce in summer and more abundant from September to January, when they reach their peak abundance (Aurioles-Gamboa et al. 1983). This difference between the southern Gulf and SBA may support the hypothesis that some subadult males from sites off the west coast of Baja California enter the Gulf and spend the subsequent months in that area (Aurioles-Gamboa et al. 1983).
The number of pups was consistently larger than the number of adult females. This is due to their foraging strategy, which makes it impossible to count all females on land. The CSL presents a long lactation of 12+ months in which females alternate their maternal care with foraging trips at sea (Antonelis et al. 1990).
The pups do not have a thick layer of fat to serve as an energy reserve and therefore need to ingest large amounts of milk. As the pups grow, their energy reserves increase as does their ability to fast (García-Aguilar and Aurioles-Gamboa 2003b), offering females the possibility of making longer foraging trips and reducing the time they spend on land. As the season progresses, pups wander more until finally venturing out to sea (Peterson and Bartholomew 1967), resulting in high pup mortality around the sixth month of age (Aurioles-Gamboa and Sinsel 1988). These factors together may explain the decline in the abundance of both adult females and pups outside the breeding season, with the lowest counts being recorded in May.
Northern elephant seal
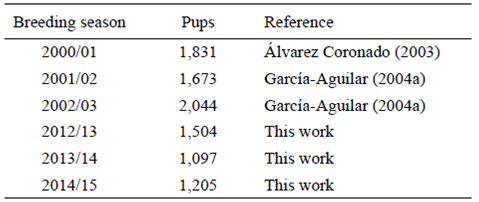
The winter abundance of NESs was similar to or greater than that reported in previous studies. Hernández-Camacho and Aurioles-Gamboa (2000) reported 1,900-2,170 individuals, while Pablo (2009) counted approximately 2,400. Our summer count is similar to that reported by Maravilla-Chávez and Lowry (1996), who counted 331 individuals in early August. Although speculative, the 2014 warming may be linked to the decline in newborns in 2014 and 2015 relative to 2013. However, based on previous studies (Álvarez-Coronado 2003, García-Aguilar 2004a) and our data (Table 5), the NES colony at SBA has shown a significant annual trend of -3.2% (r = -0.0318, R2 = 0.76, P < 0.02) over the last 15 years, placing this colony under a "declining" status. Since this trend has prevailed for more than a decade it may not be accurate to relate it to recent oceanographic anomalies.
Table 5: Previous counts of northern elephant seal (Mirounga angustirostris) pups at the San Benito Archipelago.
The NES breeding season begins in December and ends in February (Scheffer 1958, Le Boeuf and Mate 1978, Le Boeuf et al. 2011). In December we did not register a large number of animals on land; the main classes observed were pregnant females and juveniles, followed by the first new-borns (n = 54), as well as some adult and subadult males. In February we counted more individuals, particularly adult females and newborn pups (n = 1,004-1,504), as well as adult males patrolling their harems, which is typical of their polygynous mating system (Le Boeuf and Laws 1994). The number of adult females in 2015 was relatively low, perhaps because the field trip was conducted closer to the end of the NES breeding season when several females had already initiated their post-breeding migration following the 25-28 day lactation period (Le Boeuf and Laws 1994). Pups are weaned abruptly and their mothers return to sea to forage before returning to land to molt during late spring (Le Boeuf and Laws 1994, Le Boeuf et al. 2000). Weaned pups remain on land for ~2.5 months before venturing out to sea (Le Boeuf et al. 1994, Thorson and LeBoeuf 1994). The large difference between the number of adult females and pups during the breeding season is due to the fact that we recorded these data when the pups were still on the island but some mothers had already started their migration.
The operational sex ratio (F:M) varied during different breeding seasons: 5.8:1 in 2013, 9.9:1 in 2014, and 4.7:1 in 2015. An earlier study carried out at SBA and Cedros Island in 1999 and 2000 reported a ratio of 4:1 and 4.6:1, respectively (Hernández-Camacho and Aurioles-Gamboa 2000). An uncertain number of adult females had already began their migration at this time of the breeding season, which was close to the end, leading to a subestimation of these ratios.
Intra-annual variation
The moment when most NES were counted was not during the breeding season but in May when the vast majority of the individuals on land were juveniles born the previous winter (2014) or a few years earlier; the remainder were adult females returning from their post-breeding migration. As reported by Le Boeuf and Laws (1994), adult females and some juveniles congregate on the islands to molt in late spring, whereas adult and subadult males and juveniles undertake their molting in summer after returning from their post-breeding migration (adult males), which lasts about four months (Stewart and DeLong 1994, Le Boeuf et al. 2000). Thus, in July adult and subadult males and juveniles represented the majority of individuals on the archipelago. After molting, adult females and then adult males undertake their second migration, which lasts eight months and four months, respectively (Le Boeuf et al. 2000). Juveniles from Año Nuevo Island, California, make two foraging trips per year, each one lasting around five months (Le Boeuf and Laws 1994, Le Boeuf et al. 1994). This behavior would explain the peak abundances of juveniles at SBA twice a year, in the spring (May) and fall (September), the same seasons during which abundance peaks have been observed on Año Nuevo Island (Le Boeuf et al. 1994).
This study is important not only for enhancing our current knowledge of these protected pinniped species, but also for connecting these data and interpretations to future (and past) surveys at this and other sites in Baja California. By broadening the geographic extent of the data on these species, our study provides solid evidence regarding temporal variations and an analysis on how these colonies in the southern limits of their distribution resemble their homologues at higher latitudes, where their highest overall abundances are observed and where most studies have been conducted. More censuses are necessary in order to determine long-term abundance changes of these or similar species in Mexico, which frequently inhabit protected areas that must be constantly monitored in order to ensure their proper conservation.

