


Serviços Personalizados
Journal
Artigo
 texto em
  Inglês (pdf)
 Artigo em XML
 Referências do artigo
 Enviar este artigo por email
Indicadores
-
 Citado por SciELO
 -
 Acessos
Links relacionados
-
 Similares em
SciELO
Similares em
SciELO
Compartilhar

 Permalink
Ciencias marinas
versão impressa ISSN 0185-3880
Cienc. mar vol.41 no.3 Ensenada Set. 2015
https://doi.org/10.7773/cm.v41i3.2466
Articles
The Peruvian sardine, Sardinops sagax : Historical analysis of the fishery (1978-2005)
1Instituto del Mar del Perú (IMARPE), Esquina Gamarra y Gral. Valle, s/n, PO Box 22, Chucuito, Callao, Perú
The historical development of Peru's sardine (Sardinops sagax) fishery between 1978 and 2005 is described from fishery indicators (landings and effort) and environmental indicators (Pacific Decadal Oscillation [PDO] index, Southern Oscillation Index, and Sea Surface Temperature Anomaly) in order to observe the spatial and temporal variations of the fishery. During this period, the fishery indicators showed that excessive fishing pressure caused the drastic decline in abundance, as demonstrated by the low catch levels in recent years. Regarding the environmental indicators, a positive relationship with sardine landing anomalies was observed; however, the PDO index had a significant positive correlation (rPearson = 0.50; P = 0.0005; n = 45) in comparison with the other indices. The results of this study show that the effects of overfishing and adverse environmental conditions strongly impacted the Peruvian sardine population, with the consequent collapse of the fishery.
Key words: Peruvian sardine; fishery; environmental variability; availability; Peru
Se describe el desarrollo histórico de la pesquería de la sardina Sardinops sagax en el Perú entre los años 1978 y 2005 a partir de indicadores pesqueros (desembarques y esfuerzo) e indicadores ambientales (Índice de Oscilación Decadal del Pacífico [IODP], Índice de Oscilación del Sur y Anomalías de la Temperatura Superficial del Mar) con la finalidad de observar variaciones espaciotemporales de la pesquería. Durante este periodo, los indicadores pesqueros demostraron que la excesiva presión de pesca sobre este recurso propició la drástica disminución de la abundancia, lo cual se reflejó en los bajos niveles de captura en los últimos años. Respecto a los indicadores ambientales, se observó una relación positiva con las anomalías de desembarque de sardina; el IODP presentó la mejor correlación positiva (rPearson = 0.50; P = 0.0005; n = 45) en comparación con los otros índices. Los resultados de este estudio muestran que el efecto de la intensa actividad extractiva y las condiciones ambientales adversas impactaron fuertemente en la población de sardina, con el consiguiente colapso de su pesquería.
Palabras clave: sardina peruana; pesquería; variabilidad ambiental; disponibilidad; Perú
Introduction
Populations of small pelagic fish such as sardines and anchovies are found in highly productive ecosystems, especially upwelling regions, around the world. These species account for nearly one-third of the global fish catches, mainly in the Humboldt, Benguela, California, and Canary current systems (FAO 2007).
The northern Humboldt Current System off Peru is highly dynamic. Besides its high biological productivity, it exhibits high climate and oceanographic variability associated with seasonal, interannual (El Niño/La Niña), decadal, and long-term changes (Csirke and Gumy 1996, Bakun and Broad 2003, Chávez et al. 2003).
The Peruvian sardine, Sardinops sagax (Jenyns 1842), inhabits this environment. This species used to be one of the main sources of raw material for Peru's canning industry and of great socio-economic importance for the country, particularly during the 1980s. It also plays an important ecological role in the transfer of energy from lower to higher trophic levels and as prey for a number of higher-level predators like large fish, birds, and marine mammals (Cury et al. 2000). Over the last three decades, however, the sardine population in Peruvian waters has experienced notable changes in distribution and abundance levels as a result of overfishing and environmental factors, and has declined to very low levels as evidenced by the fall in sardine landings (Patterson et al. 1992, Csirke and Gumy 1996, Cárdenas et al. 1997).
The objective of the present study is to analyze the historical development of the sardine fishery from 1978 to 2005 based on fishery indicators (fishing effort and landings), spatial and temporal distribution, and environmental indicators, factors that interact in complex and unexpected ways and affect the population. This information will allow a better assessment of the sardine fishery and thus help to develop appropriate management measures that will ensure its recovery.
Materials and methods
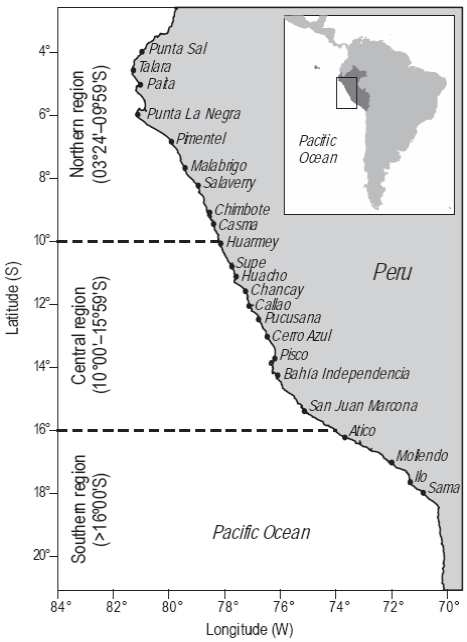
The study area included the coastal zone off Peru, from the northern border (Puerto Pizarro, 03°30'S, 80°24'W) to the southern border (La Concordia, 18°20.8'S, 70°22.6'W), and 200 nautical miles (nm) offshore. Three regions were considered for the analysis: northern, central, and southern (Fig. 1).
The fishing effort and landing data (fishery indicators) were obtained from the project "Seguimiento de la pesquería de anchoveta y otros recursos pelágicos" (Monitoring of the anchovy fishery and other pelagic resources) carried out by the Instituto del Mar del Perú (IMARPE) from 1978 to 2005. Daily landing records per vessel were collected and examined based on subsamples of species composition. Fishing effort was determined considering the number and type of purse seine vessels and storage capacity (m3).
The charts of the distribution and concentration of sardine catches were georeferenced using a geographic information system (ArcGIS v9.3). The years of the historical landing series were grouped by decades considering the mean cumulative catches per maritime area of 10 nm, parallel to the coastline every half-degree of latitude (isoparalittoral areas).
Data (1961-2005) on the following environmental indicators were used: the Pacific Decadal Oscillation (PDO) index, the Southern Oscillation Index (SOI), and Sea Surface Temperature Anomalies (SSTA) (1961-2005) from a fixed coastal station (Chimbote). The monthly sardine landing anomalies (SardAnom, dimensionless) were calculated as follows:
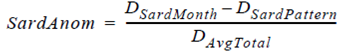 1
1
where DSardMonth is the the original monthly sardine landing datum (tons), DSardPattern is the sardine landing pattern (tons) from 1961 to 2005, and DAvgTotal is the monthly average total sardine landing (tons). The physical and biological (sardine landing anomalies) time series were then linearly related based on a polynomial regression (better fit obtained with order 6), as follows:
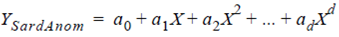 2
2
where YSardAnom is the sardine landing anomaly (dimension-less), X are the years (1961-2005), and a0 ... ad are the coefficients of the equation.
Results
Fishing effort
Types of fishing vessels and gear
The Peruvian vessels targeting sardine, known locally as bolicheras, mainly use purse seine nets. Three types of fleet operated during the study period (Table 1):
Table 1: Type of fleet and characteristics of the vessels dedicated to sardine (Sardinops sagax) fishing.

Industrial fleet, consisting of vessels equipped with refrigeration systems that used nets with a mesh size of 38 mm (sardine net). The hold capacity (HC) of these vessels represented 27% of the total operative HC. The sardine catches were destined for direct human consumption (DHC), mainly for canning.
Industrial fleet, consisting of vessels not equipped with refrigeration systems that used nets with mesh sizes of 13 mm (anchovy net) and 38 mm. This was the largest fleet, the HC representing more than 70% of the operative HC. The catches were destined for indirect human consumption (IHC), mainly for the production of fishmeal and fish oil.
Artisanal fleet, consisting of vessels with a HC of <30 m3, operating within 5 nm from the shore. Between 1983 and 1995 this fleet landed 26,000 t of sardine per year, used for DHC (canning) and as bait.
By the end of the 1990s, commercial fishing vessels, with a HC of 50 to 800 m3, were using modern fish-finding instruments, and catching both anchovy (Engraulis ringens) and sardine for the production of fishmeal and fish oil.
Number of vessels and hold capacity
Fishing effort, translated into number of vessels and HC during the study period, varied significantly per type of industrial fleet (DHC, IHC) (Fig. 2). When commercial fishing began (1978-1979), an average of 241 vessels targeted fish for DHC, mainly for canning but also for the production of fishmeal and fish oil. In turn, the fleet targeting fish for IHC operated with 494 vessels, on average, with a mean HC equivalent to 139,160 m3.
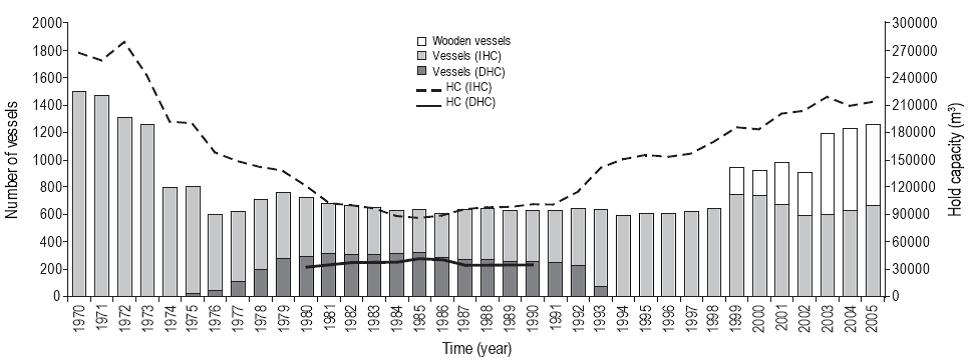
Figure 2: Number of purse seine vessels (steel and wooden) and hold capacity (HC) of the Peruvian industrial fleet targeting anchovy and sardine for indirect human consumption (IHC) and direct human consumption (DHC) during the period from 1970 to 2008.
During the 1980s, period when the sardine fishery saw greatest expansion, the average number of vessels fishing for DHC was 292, with an average HC of 36,473 m3. The fleet fishing for IHC consisted of 356 vessels, with an average HC of 96,376 m3.
From 1990 to 1993, the number of vessels fishing for DHC decreased to an average of 199. Conversely, the number of vessels fishing for IHC increased to an average of 435, with a HC of 113,044 m3. There is no information on fishing effort for the fleet targeting fish for DHC after 1994 because it has not been possible to establish differences between both fleets (DHC and IHC), since both the anchovy net and the sardine net were used indistinctly to capture both species.
Between 1994 and 1998, the industrial fleet fishing for IHC consisted of an average of 614 vessels, with a HC of 155,487 m3. These beach seiners indistinctly captured both anchovy and sardine; however, the greatest effort directed towards sardine was recorded in 1998, when the fleet consisted of 642 vessels.
During the period 1999-2005, when the sardine catches declined abruptly, the effort was almost exclusively directed towards anchovy.
Historical landings
The historical series of sardine landings (1970-2005) showed that catch levels were low in the early 1970s. When the anchovy fishery collapsed in 1972, sardine landings increased, reaching 132,000 and 72,0001 in 1973 and 1974, respectively. The industrial sardine fishery initiated in 1978; annual landings were ~1.5 million tons until 1982, decreasing in 1983 (El Niño year) to ~1 million tons.
The highest volumes of sardine landings were recorded during the 1980s (except during the 1982-1983 El Niño event), reaching a maximum of 3.5 million tons in 1988. After 1990, the catches decreased to average annual levels of ~1 million tons during the period 1992-1998. The levels subsequently decreased to 1321.
The highest sardine landings of all the time series analyzed were recorded in the northern and central regions of the Peruvian littoral, mainly in northern ports such as Chimbote (09°04'S, 78°36'W) and Paita (05°04'S, 81°06'W), from where between 40% and 75% of the landings originated, except during the 1982-1983 El Niño event. In the southern region, the landings were not very significant (Fig. 3).
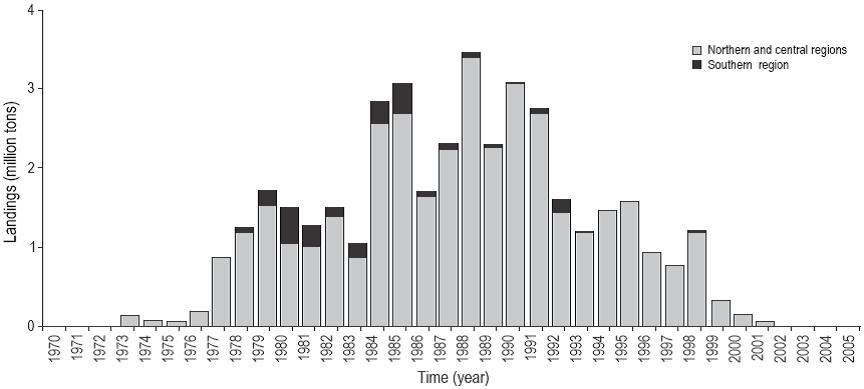
Figure 3: Time series of annual landings (million tons) of the sardine Sardinops sagax (Jenyns 1842) by regions off the Peruvian coast (1970-2006).
During the 1980s and 1990s, the sardine landings showed seasonality, the highest landings occurring during the austral summer and spring (Fig. 4).

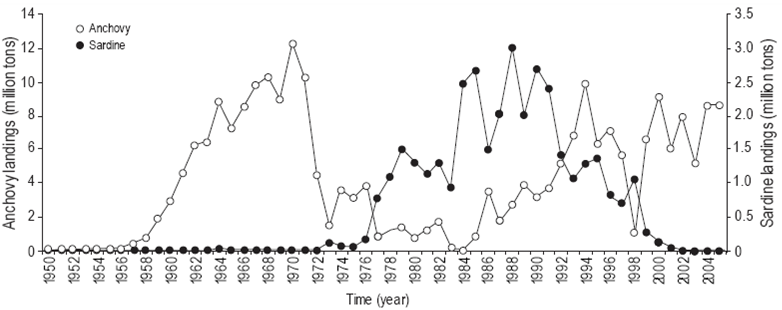
Alternation of sardine and anchovy landings
Changes in the dominance of sardine and anchovy indicate an alternation between the sardine and anchovy landings (Fig. 5). During the 1950s and 1960s the pelagic fishery was sustained by anchovy catches. The sardine landings were at that time limited to a few tens of thousands of tons but increased substantially after commercial sardine fishing began in 1978. During the 1980s, sardines dominated, the cumulative landings reaching 21 million tons, compared to 16 million tons for anchovy. After 1990, the anchovy landings began to increase and the sardine landings slowly decreased to 360 t in 2003, after which they were almost nil.
Spatial and temporal distribution of sardine catches
The distribution of sardine catches showed significant spatial and temporal variations off the coast of Peru (Fig. 6).

Figure 6: Spatiotemporal distribution of sardine (Sardinops sagax) by fishing areas during the 1980s, 1990s, and 2000-2005.
During the 1980s, S. sagax showed a wide latitudinal distribution, from Paita in the north to Ilo in the south, and some main centers of concentration: off Chimbote and Paita in the northern region, off Callao (12°00'S, 77°04'W) in the central region, and off Ilo (17°38'S; 71°20'W) in the southern region. These fishing areas were the most important during the period under study, yielding catches of >700,0001, especially between 10 and 70 nm and up to 100 nm offshore. During this period, the concentrations of sardine were higher in areas close to shore.
In the early 1990s, the main areas of concentration were similar to those of the previous decade, but the catches were smaller. By the late 1990s, the fishing areas were more scattered, extending to 200 nm offshore. This wide distribution continued from 2000 to 2005, with yields of ~5000 t.
Comparison of Peruvian, Ecuadorian, and Chilean sardine landings
The comparative analysis of the landings of the northern-central Peru and southern Ecuador stock showed that Peru contributed more than 90% of the annual landings during the period from 1982 to 1996 (Fig. 7a). The largest landing recorded in Peru was 3.5 million tons in 1988 and the largest landing recorded in Ecuador was 1.2 million tons in 1985. The landings decreased significantly in subsecuent years, but Peru's contribution was always higher, except from 2000 to 2005.
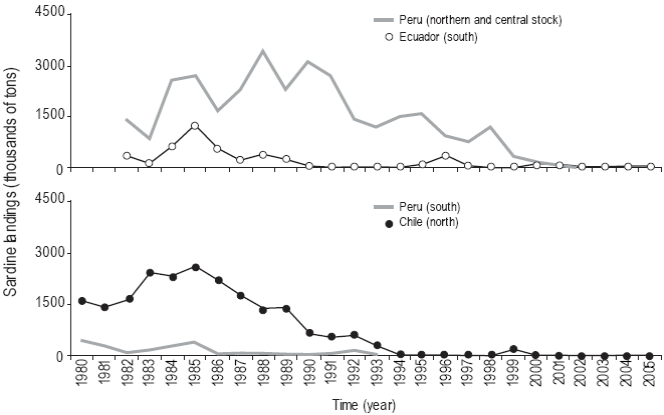
Figure 7: Sardine (Sardinops sagax) landings (1980-2005): (a) northern-central Peru and southern Ecuador stock, and (b) southern Peru and northern Chile stock.
Conversely, in the case of the southern Peru and northern Chile stock, during the period from 1980 to 2005 Peru contributed only 10% of the total landings and Chile the rest (Fig. 7b). Total landings (southern Peru and northern Chile) and landings per country decreased after 1985 and notably so after 1994, except in 1992, when there was a slight increase. The largest landing in southern Peru (~458,000 t) was recorded in 1980, and in Chile (2.6 million tons), in 1985.
Variability of sardine abundance in relation to environmental factors
There was a significant correlation between the sardine landing anomalies and the environmental indicators (PDO index, SOI, and SSTA). The landing anomalies showed a positive correlation with the PDO index. The very low landings from 1961 to 1975 were associated with negative values; between 1979 and 1990, when the landings increased, the PDO index values were positive; and after 1999, the trend reverted to that observed in the earlier years. This indicates long-term fluctuations of sardine landings, that is, periods of high and low yields (Fig. 8a).
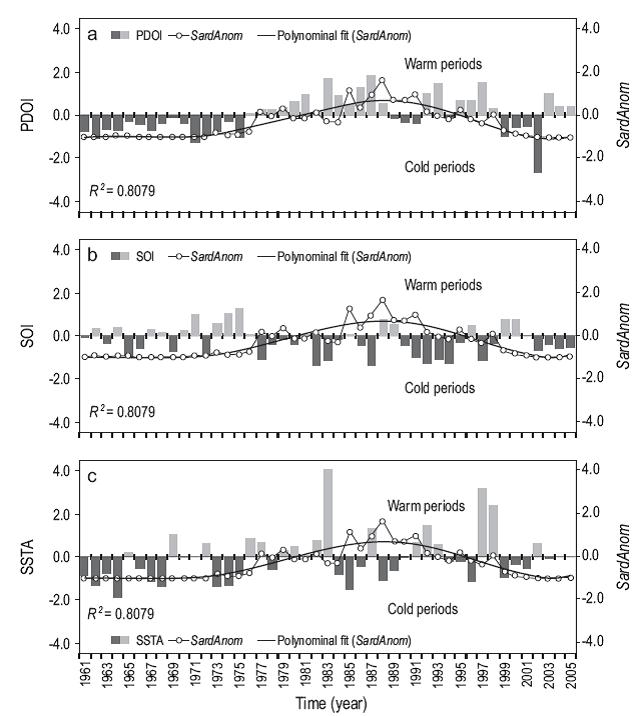
Figure 8: Relationship of sardine (Sardinops sagax) landing anomalies (SardAnom): (a) Pacific Decadal Oscillation Index (PDOI), (b) Southern Oscillation Index (SOI), and (c) Sea Surface Temperature Anomaly (SSTA, data from the Chimbote station). The polynomial fit for SardAnom is also shown. Time series: 1961-2005.
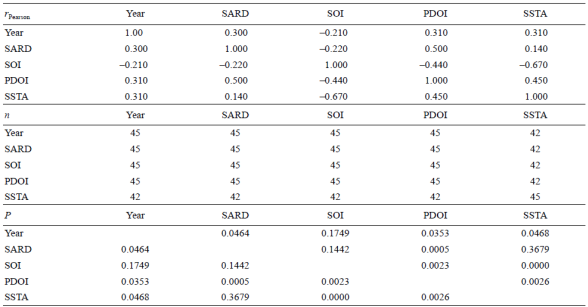
The SOI also confirmed this long-term fluctuation of sardine landings during the cold and warm periods of the historical series from 1961 to 2005 associated with positive and negative values of this index (Fig. 8b). Likewise, the landings increased and decreased when the SSTA values were positive or negative, respectively (Fig. 8c). Analysis of the Pearson correlation coefficient values showed that the PDO index had a significant positive correlation with the sardine landing anomalies (rPearson = 0.50; P = 0.0005; n = 45) compared with the other indices (SOI and SSTA) (Table 2).
Discussion
Our results indicate that overcapacity of the industrial fleet targeting anchovy in the early 1970s (~1500 vessels with a HC of 260,000 m3) led to the collapse of the fishery and the onset of the commercial sardine fishery in the late 1970s. During the 1980s when the sardine catch levels were highest, the fleet HC had decreased to 89,946 m3, but proved to be sufficient for the development of the fishery.
During the 1990s, however, the number of vessels increased to 642, and between 1994 and 1998 the HC of the sardine fleet was 155,000 m3. Even though the number of vessels comprising the fleet was lower than during the 1970s, the fishing power was greater due to improved fish-finding technology, renewal of fishing gear, net modifications, and increased HC of the individual vessels. These improvements allowed greater mobility to areas of concentration and increased efficiency in view of the changes in sardine distribution, concentration, and behavior. Csirke and Gumy (1996) reported the existence of a fundamental problem related to the overcapacity of the fishing fleet and fish plants in Peru in the early 1990s.
During the 1997-1998 El Niño event, there was a notable decrease in anchovy and greater availability of sardine, mainly juveniles (0, 1, 2, and 3 years of age). The sardine population, which was already showing signs of deterioration, was subjected to high fishing pressure, especially in 1998, and thus negatively affected (Cárdenas 2009).
A spatial and temporal alternation between sardine and anchovy stocks has occurred over the past three decades. During the 1980s, the main fishing grounds were occupied by sardine and the higher catch levels reflected the increase in biomass; this period is known as the "sardine decade". Santander (1981) attributed the dominance of sardine to more extensive spawning grounds, an increase in the number of eggs, and an expansion of the distribution area. The opposite occurred during the 1990s, when anchovy dominated, and during the period 2000-2005, sardine disappeared from the traditional fishing grounds.
Sardine/anchovy alternations have been reported for other upwelling areas, for example, between Sardinops caeruleus and Engraulis mordax off California and between Sardinops melanostictus and Engraulis japonicus off Japan (Lluch-Belda et al. 1989, Klyashtorin 1998, Bakun and Cury 1999, Bakun and Broad 2003), possibly related to large-scale climate changes (Kawasaki 1983, Kawasaki and Omori 1988, Lluch-Belda et al. 1992). Van der Lingen et al. (2006), based on morphological evidence in the feeding apparatus of anchovy and sardine, hypothesized that alternations between these species are likely motivated by the competition for and adaptation to specific food sources. This trophodynamic hypothesis relates changes in physical and oceanological regimes and the plankton community with changes in anchovy and sardine dominance under bottom-up processes.
Ayón et al. (2008) related time series of anchovy and sardine landings to zooplankton biovolumes. The zooplankton biovolumes and anchovy landings are globally in phase, whereas the zooplankton biovolumes and sardine landings are out of phase, especially when the nocturnal biovolumes are considered. This provides clear evidence of the bottom-up control of zooplankton on the anchovy population but not on the sardine population and requires further investigation.
The spatial and temporal distribution of S. sagax showed greater alterations during ENSO events (El Niño and La Niña). During El Niño 1982-1983, one of the most intense events on record, this species migrated southwards from its traditional fishing grounds off northern Peru (Tsukayama and Santander 1983, Vela and Rubio 1985, Cañón 1985).
Three ENSO events occurred during the 1990s: La Niña 1995-1996, La Niña 1999, and El Niño 1997-1998, the latter of great intensity. During the two La Niñas, when upwelling intensified, the latitudinal and longitudinal distribution of S. sagax increased (<200 nm offshore). During El Niño 1997-1998, the marine environment experienced important changes due to the advance or input of Equatorial Surface Water and Subtropical Surface Water, which conditioned the distribution of the sardine fishing grounds, but not as strongly as during El Niño 1982-1983.
The changes observed in the distribution of S. sagax reveal considerable interannual variations in migration, mainly during intense El Niño events, when its distribution deepened and it migrated southwards in search of better survival conditions (food). These alterations, however, have not been observed in other ecosystems. Under normal conditions, the California sardine (S. caeruleus) migrates northwards from its spawning grounds in the south to feed (Bailey et al. 1982, Schwartzlose et al. 1999). Agostini (2005) reported that the pelagic habitat is dynamic and its limits present spatial and temporal changes related to physical oceanographic variables. Nonetheless, the mechanisms causing these changes are not clear and the migratory behavior of sardines is not yet fully understood.
For the past 50 years, a significant correlation was observed between the environmental indicators (PDO index, SOI, and SSTA) and the sardine landing anomalies, which showed long-term fluctuations with periods of high and low yields, thus corroborating the decadal changes. Decadal-scale changes in distribution and concentration, influenced by environmental variations, are not only associated with seawa-ter temperature, but also with other factors such as dissolved oxygen levels in the water column, food availability, and prey size (Bertrand et al. 2011).
Variations in fish catches can be seen as indicators of resource abundance and availability (Melo-Barrera et al. 2010). In Peruvian waters, the high fishing pressure exerted on S. sagax by the industrial purse-seine fleet (translated into number of vessels and HC) strongly affected the abundance of this species that began declining in the mid-1990s. Sardine landings decreased from an average of 2.5 million tons during the period 1987-1992 to 304 t between 2002 and 2005, clear evidence of the collapse of the fishery, which was also affected by the extraordinary 1997-1998 El Niño event.
Acknowledgments
The authors thank the staff of the IMARPE coastal labor-tories for providing the sardine plant and landing data used in this study.
REFERENCES
Agostini VN. 2005. Climate, ecology and productivity of Pacific sardine (Sardinops sagax) and hake (Merluccius productus)PhD thesis, University of Washington, 160 pp. [ Links ]
Ayón P, Swartzman G, Bertrand A, Gutiérrez M, Bertrand S. 2008. Zooplankton and forage fish species off Peru: Large-scale bottom-upforcing and local-scale depletion. Prog. Oceanogr. 79: 208-214. [ Links ]
Bailey KM, Stevens PR. 1982. The life history and fishery of Pacific whiting, MerlucciusproductusCalCOFI Rep. 23: 81-98. [ Links ]
Bakun A, Cury P. 1999. The school traps: A mechanism promoting large-amplitude out-of-phase population oscillations of small pelagic fish species. Ecol. Lett. 2(6): 349-351. [ Links ]
Bakun A , Broad K. 2003. Environmental "loopholes" and fish populations' dynamics comparative pattern recognition with focus on El Niño effects in the Pacific. Fish. Oceanogr. 12: 458-473. [ Links ]
Bertrand A , Chaigneau A, Peraltilla S, Ledesma J, Graco M, Monetti F, Chávez F. 2011. Oxygen: A fundamental property regulating pelagic ecosystem structure in the coastal southeastern tropical Pacific. PLoS ONE 6(12): 1-8. [ Links ]
Cañón JR. 1985. La variabilidad ambiental en la zona norte de Chile y su influencia en la pesquería pelágica durante El Niño 1982-1983. Invest. Pesq. (Chile) 32: 119-28. [ Links ]
Cárdenas G. 2009. Análisis de series de tiempo de los indicadores biológicos, pesqueros y poblacionales de la sardina, Sardinops sagax (Jenyns 1842), en función de la variabilidad ambiental y la pesca. PhD thesis, Universidad Nacional Mayor de San Marcos, Lima, Perú, 131 pp. [ Links ]
Cárdenas G , Chipollini A, Cedeño I, González N. 1997. Evaluación conjunta del stock de sardina (Sardinops sagax) de la región norte-centro de Perú y sur de Ecuador, 1982-1996. I Taller de Evaluación de Pequeños Pelágicos, IMARPE-VECEP (Programa de Pesca UE), Lima, Perú, 13-31 October 1997, pp. 1-26. [ Links ]
Chávez FP, Ryan J, Lluch-Cota S, Ñiquen M. 2003. From anchovies to sardines and back: Multidecadal change in the Pacific Ocean. Science 299: 217-221. [ Links ]
Csirke J, Gumy A. 1996. Análisis bioeconómico de la pesquería pelágica peruana dedicada a la producción de harina y aceite de pescado. Bol. Inst. Mar Perú (Callao) 15(2): 25-68. [ Links ]
Cury P , Bakun A , Crawford RJM, Jarre A, Quiñones RA, Shannon LJ, Verheye HM. 2000. Small pelagics in upwelling systems: Patterns of interaction and structural changes in "wasp-waist" ecosystems. ICES J. Mar. Sci. 57: 603-618. [ Links ]
[FAO] Food and Agriculture Organization. 2007. El Estado Mundial de la Pesca y la Agricultura. SOFIA. FAO, Rome, 176 pp. [ Links ]
Kawasaki T. 1983. Why do some pelagic fishes have wide fluctuations in their numbers? Biological basis of fluctuation from the viewpoint of evolutionary ecology. In: Sharp GD, Csirke J (eds.), Reports of the Expert Consultation to Examine Changes in Abundance and Species Composition of Neritic Fish Resources. FAO Fish. Rep. 291: 1065-1080. [ Links ]
Kawasaki T , Omori M. 1988. Fluctuaciones en las tres poblaciones más importantes de sardina del Pacífico y la tendencia global de la temperatura. In: Wyatt T, Larrañeta MG (eds.), Simposio sobre Cambios de Largo Término en Poblaciones de Peces Marinos, Vigo, Spain, pp. 37-53. [ Links ]
Klyashtorin LB. 1998. Long-term climate change and main commercial fish production in the Atlantic and Pacific. Fish. Res. 37: 115-125. [ Links ]
Lluch-Belda D, Crawford RJM , Kawasaki T , MacCall AD, Parrish R, Schwartzlose RA, Smith PE. 1989. World-wide fluctuations of sardine and anchovy stocks: The regime problem. S. Afr. J. Mar. Sci. 8: 195-205. [ Links ]
Lluch-Belda D , Schwartzlose RA , Serra R, Parrish R , Kawasaki TH, Hedgecock D, Crawford JM. 1992. Sardine and anchovy regime fluctuations of abundance in four regions of the world oceans: A workshop report. Fish. Oceanogr. 1: 339-347. [ Links ]
Melo-Barrera F, Félix-Uraga R, Quiñones-Velázquez C. 2010. Análisis de la pesquería de Sardinops sagax en la costa occidental de Baja California Sur, México, durante 2006-2008. Cienc. Pesq. 18(2): 33-46. [ Links ]
Patterson KR, Zuzunaga J, Cárdenas G. 1992. Size of the South American sardine (Sardinops sagax) population in the northern part of the Peru Upwelling Ecosystem after collapse of anchovy (Engraulis ringens) stocks. Can. J. Fish. Aquat. Sci. 49(9): 1762-1769. [ Links ]
Santander H. 1981. Patrones de distribución y fluctuaciones de desoves de anchoveta y sardina. In: Dickie LM, Valdivia JE (eds.), Investigación Cooperativa de la Anchoveta y su Ecosistema (ICANE) entre Perú y Canadá. Boletín del Instituto del Mar de Perú, Callao, volumen extraoridinario, pp. 180-192. [ Links ]
Schwartzlose RA , Alheit J, Bakun A , Baumgartner TR, Cloete R, Crawford RJM, Fletcher WJ, Green-Ruiz Y, Hagen E, Kawasaki T, Lluch-Belda D, Lluch-Cota SE, MacCall AD, Matsuura Y, Nevárez-Martínez MO, Parrish RH, Roy C, Serra R, Shust KV, Ward MN, Zuzunaga J. 1999. Worldwide large-scale fluctuations of sardine and anchovy populations. S. Afr. J. Mar. Sci. 21: 289-347. [ Links ]
Tsukayama I, Santander H. 1983. Recursos pelágicos y sus pesquerías en Perú. Rev. Com. Perm. Pacífico Sur 13: 25-63. [ Links ]
Van der Lingen CD, Hutchings L, Field JG. 2006. Comparative trophodynamics of anchovy Engraulis encrasicolus and sardine Sardinops sagax in the southern Benguela: Are species alternations between small pelagic fish trophodynamically mediated? Afr. J. Mar. Sci. 28: 465-477. [ Links ]
Vela J, Rubio J. 1985. Movimientos migratorios de la sardina determinados por marcaciones. In: Tresierra A (ed.), Actas 1er Congreso Nacional de Biología Pesquera. Colegio Regional del Norte, Trujillo, Peru, pp. 71-74. [ Links ]
Received: September 2014; Accepted: February 2015
 Este es un artículo publicado en acceso abierto bajo una licencia Creative Commons
