


 text new page (beta)
 English (pdf)
 Article in xml format
 Article references
 Send this article by e-mail
 Cited by SciELO
  Similars in
SciELO
Similars in
SciELO 
 Permalink
Introduction
A topic of great concern and interest for climatologistsand oceanographers is to determine how quickly natural and anthropogenic CO2 is being absorbed by the oceans. The ocean acts as a large CO2 sink (Takahashi et al. 2009), and abetter understanding of the actual rate of ocean uptake of CO2 is essential to reliably predict future atmospheric CO2 levels. This number, however, is difficult to define because the net air-sea CO2 flux is a small difference, of around 2 ± 1 Pg C yr-1 (1 Pg C is 1015 g C in the form of CO2), between two large fluxes, that is, uptake and release of CO2 at the sea surface (each one approximately equal to 90 Pg C yr-1) (Liu et al. 2000).
The role of coastal oceans in the global carbon budget is still under discussion, partly because sufficient data for most coastal regions are lacking. Coastal seas have high biogeochemical activity, so high fluxes of carbon between the surface water and atmosphere would be expected (Chen 2004). In general, coastal areas subject to upwelling of cold waters, rich in nutrients and dissolved inorganic carbon (DIC), are net sources of atmospheric CO2, whereas areas where upwelling is weak act as net CO2 sinks. Some coastal ecosystems (e.g., estuaries, mangrove forests, salt marshes, and coral reefs) cause the coastal oceans to be net sources of CO2 (Cai et al. 2006).
Global ocean-atmosphere CO2 fluxes have been estimated using diverse methods, including hydrologic models of the carbon system in conjunction with hydrodynamic models (Arthun et al. 2012) and in situ measurements of the carbon system variables (alkalinity, DIC, pH, and partial pressure of carbon dioxide [pCO2]) (Bates et al. 2011). Empirical relations have been developed between satellite- derived sea surface temperatures (SST) and pCO2 in water (pCO2watei, measured in situ) (Zirino et al. 1997, Boutin et al. 1999); between chlorophyll a concentrations and pCO2water (Zhu et al. 2009); or between pCO2water, chlorophyll a concentrations, and SST (Chen et al. 2011). Some authors have used a combination of these methods, such as empirical relations and the compilation of available data from oceanographic cruises (Wanninkhof et al. 2012). A little more than a decade ago, however, a new technology appeared that allows realtime, high-frequency measurements of pCO2 (generating time series) by pCO2 sensors installed on oceanographic buoys (Chávez et al. 2007). It is therefore now possible to measure in real time the pCO2 in air (pCO2air) and pCO2water, and subsequently estimate the carbon fluxes at different temporal scales.
In coastal areas, several processes are involved in the carbon cycle, including, among others, terrestrial runoff; upwelling events that transport subsurface water with high DIC content to the euphotic zone; photosynthesis; sinking of organic particles; respiration, production, and uptake of dissolved organic carbon; and CO2 fluxes between the atmosphere and ocean (Chávez et al. 2007). Though fluxes in coastal oceans are large relative to the surface area, there is a lack of consensus regarding whether these regions are a net sink or a net source of atmospheric CO2 (Cai and Dai 2004, Thomas et al. 2004). Uncertainties exist about the water-air carbon fluxes in coastal zones because they are complex and dynamic, and vary quickly over short distances and at high frequencies (Chavez et al. 2007). As mentioned above, only recently has it been possible to measure these fluxes that change rapidly, on a time scale of days, with new technologies (Friederich et al. 2002, Hales and Takahashi 2004).
In general, coastal seas have been largely ignored in global carbon budgets, although the related carbon and nutrient fluxes are disproportionately high relative to their surface area. Reports have discussed the direction, magnitude, and latitudinal variability of air-sea CO2 fluxes in marginal seas (Cai and Dai 2004, Thomas et al. 2004), but have not considered that the coastal ocean is a collection of multiple diverse ecosystems. Therefore, a climatological approach to evaluate sinks and sources of CO2 is currently not possible because of the strong temporal variation and spatial heterogeneity of coastal environments and the relatively few data available (Borges et al. 2005).
Few, sporadic measurements have been taken of the CO2 system variables in coastal waters off the Baja California Peninsula (southern part of the California Current System [CCS]). Hernandez-Ayon et al. (2010) and De la Cruz- Orozco et al . (2010) reported data generated during oceanographic campaigns and concluded that the region of the CCS off the peninsula behaved as a minor source of atmospheric CO2. High-frequency measurements of pCO2 using oceanographic buoys equipped with sensors and telemetry were performed almost continuously throughout 2009. The objective of this contribution is to describe the annual cycle of CO2 fluxes in a coastal upwelling zone of the southern CCS.
Materials and methods
Study area
The CCS is one of the most productive eastern boundary systems of the world, mainly because of the wind-induced upwelling of cold, relatively salty waters, rich in nutrients and DIC, that flow towards the euphotic zone off the coast. The hydrography off the west coast of the Baja California Peninsula (Mexico) is characterized by an equatorward surface flow, which transports relatively cold, low-salinity Subarctic Water (SAW), and by a poleward subsurface flow along the edge of the continental shelf, as well as by the occurrence of coastal upwelling events induced by northwesterly winds almost all year round (Durazo et al. 2010). Seasonally, SAW dominates in spring and summer, during the period of most intense upwelling, whereas the influence of tropical and subtropical waters is commonly felt in late summer and autumn (Lynn and Simpson 1987).
The dominant conditions of the CCS off northern Baja California are characterized by two water masses. The California Current (CC), a surface current, transports SAW, characterized by a relative salinity minimum, high dissolved oxygen levels, and a density range (ct) of 24.4 to 25.5 kg m-3 (Durazo et al. 2010). The subsurface (100-400 m depth), poleward-flowing California Countercurrent transports Equatorial Subsurface Water, characterized by relatively high salinities, high nutrient and DIC concentrations, and low dissolved oxygen levels. The relatively high salinity core normally occurs over the continental slope, off the northern and central coasts of Baja California, with an isopycnal of 26.5 kg m-3 (Durazo et al. 2010). A third current some 200 km to the south of California has been described as an extension of the CC, but it has not been well documented on a seasonal scale. It flows northwards along the continental shelf, and it has been associated with low temperatures at small spatial scales (20 to 50 km) and with coastal cyclonic eddies (Durazo and Baumgartner 2002). This study was conducted in a coastal upwelling zone located south of Punta Banda (Ensenada), off northern Baja California, known for the seasonal variability of the oceanographic and wind conditions (Chavez de Ochoa 1975).
Data acquisition
Time series were generated by an oceanographic buoy located ~3 km off the coast to the south of Punta Banda (31.6°N, 116.6°W; Fig. 1). Data were recorded every 3 h from January to December 2009. The following variables were recorded: pCO2watei, pCO2aiI, and water temperature and salinity. As a result of sensor-related problems, pCO2air data were lacking for some periods and in these cases, data from the Globalview data base were used (Takahashi et al. 2009), specifically those for the station of Scripps Institution of Oceanography (University of California, San Diego). Wind speed and direction data (u10 m s-1) from CICESE's meteorological station (Todos Santos Island, Baja California) were used. Temperature, salinity, and pCO2water were measured 1 m below the water surface, and pCO2air was measured 1 m above the sea surface. The sensor-equipped buoy is described in detail by Friederich et al. (2002). The sensor (LI-820) measures pCO2water in an air parcel in equilibrium with sur face seawater by infrared absorption spectroscopy. Before this air parcel flows towards the spectrophotometer it passes through a desiccator. The sensor is calibrated before each measurement. Measurements are taken every 30 min and are automatically averaged every 3 h, and the data are sent via satellite to the laboratory. Hence, the sample size for every daily average is n = 8.
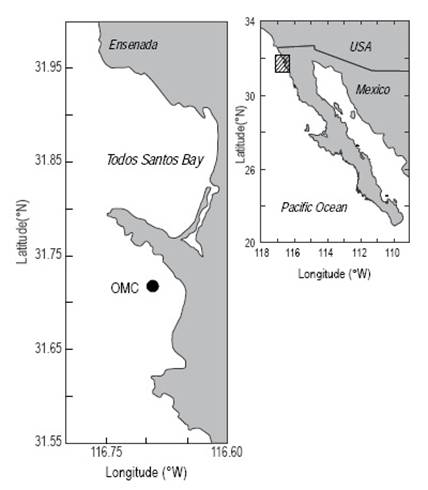
Figure 1 Study area. The oceanographic buoy was installed at the Coastal Monitoring Observatory (OMC).
The CO2 fluxes (FCO2) were calculated according to Sarmiento and Gruber (2006): FCO2 = KSΔpCO2, where FCO2 is the atmosphere-ocean flux (µmol m-2 s-1); ΔpCO2 is pCO2water - pCO2air; K is the gas transfer velocity, which depends on ui0 (Wanninkhof and McGillis 1999); and S is the solubility coefficient. The FCO2 were calculated using the 3-h data. The daily averages (µmol m-2 s-1) were then calculated and, finally, the net annual FCO2 (mol m-2 yr-1).
Results
The temperature and salinity time series (Fig. 2) showed an annual mean of 15.83 ± 0.03 °C and 33.32 ± 0.003, respectively (in these and all following cases, the number after ± is the standard error, s/n-05). Maximum temperature (21.7°C) was recorded in summer and minimum (12.0 °C) in spring. Upwelling was considered to have occurred when water temperature was <14 °C. Maximum salinity (33.65) occurred in spring and minimum (32.83) in winter. The temperature tended to increase from winter to summer and decrease in autumn. Salinity was higher in winter (33.34 ± 0.01), spring (33.51 ± 0.01), and summer (33.31 ± 0.01), and lower in autumn (33.13 ± 0.004).
Daily mean wind speed was 4.6 ± 0.03 m s-1, with a maximum of 11.5 m s-1 and minimum of 1.0 m s-1, both in autumn (Fig. 2). Wind speed tended to increase from winter to summer and decrease in autumn. Mean wind speed was 4.6 ± 0.18 m s-1 in winter, 4.7 ± 0.17 m s-1 in spring, 5.0 ± 0.21 m s-1 (highest) in summer, and 4.2 ± 0.19 m s-1 (lowest) in autumn.

Figure 2 Time series of temperature (°C), salinity, wind speed (m s-1), ΔpCO2 (µatm), and CO2 fluxes (mmol m-2 d-1) for the study site, during 2009. The arrows indicate the most intense upwelling events of the year.
The ΔpCO2 time series (Fig. 2) showed an annual mean of 0.2 ± 0.99 µatm, with an annual maximum of 286 µatm and a minimum of -107 µatm, both in spring. The mean value for spring was 21.7 ± 1.62 µatm. The mean value for summer was also positive, 4.3 ± 0.59 µatm, and the maximum value was 132 µatm. The mean value for autumn was negative, -4.8 ± 0.20 µatm; the autumn values showed less variation, ranging from a minimum of -50.0 µatm to a maximum of 17.1 µatm, the smallest range of all the year (of 67 µtm). Winter showed a similar behavior to that of spring, with a mean ΔpCO2 value of 15.0 ± 0.82 µatm; the winter positive values mainly occurred in March (maximum of 127 µtm). The maximum and minimum values for summer and winter were very similar (Fig. 2).
The CO2 fluxes showed strong variability throughout 2009 (Fig. 2). The mean winter CO2 flux was 0.6 ± 0.11 mmol C m-2 d-1. The lowest CO2 flux of the year occurred in February (-6.5 mmol C m-2 d-1). The mean spring CO2 flux was 2.8 ± 0.27 mmol C m-2 d-1, the highest of the year; spring had the highest single value of the year (27.1 mmol C m-2 d-1) and a minimum value of -4.3 mmol C m-2 d-1. The mean summer CO2 flux was 0.3± 0.11 mmol C m-2 d-1, and the minimum and maximum values were -5.2 and 11.9 mmol C m-2 d-1, respectively. The mean value for autumn was negative, -0.3 ± 0.03 mmol C m-2 d-1, indicating a flux from the atmosphere to the ocean, and the minimum and maximum values were -4.2 and 3.4 mmol C m-2 d-1, respectively. The mean annual CO2 flux was 0.9 ± 0.16 mmol C m-2 d-1. The annual balance of CO2 fluxes was 0.3 ± 0.06 mol C m-2 yr-1.
Discussion
Our time series clearly show the influence of coastal upwelling on CO2 fluxes to the atmosphere (Fig. 2). Below the euphotic zone, respiration increases DIC and nutrients such as NO3, presumably following the Redfield ratios; however, respiration is not the only process that affects DIC and NO3. The presence of excess DIC relative to NO3 has been attributed to the dissolution of calcium carbonate exoskeletons at depth (Park 1965), to denitrification processes associated with the oxygen minimum zone in the eastern Pacific (Thomas 1966), and to differences in preformed DIC (Park 1965). Denitrification and calcium carbonate dissolution processes occur along the trajectory of the water masses, from their origin at high latitudes, and not only locally off Baja California. When water rises to the euphotic zone and photosynthesis consumes nutrients such as NO3 there is an excess of CO2 that escapes to the atmosphere (Rodriguez- Ibanez et al. 2013).
Álvarez-Borrego and Álvarez-Borrego (1982) reported that upwelling events off Baja California are a sequence of intensifications and relaxations with periods of about two weeks. These authors reported the occurrence of ten intense events in 1979 at a site located 200 km south of Ensenada, the most intense in July when minimum surface temperatures were <11.0 °C. The annual CO2 flux time series (Fig. 2) showed four periods of ocean-to-atmosphere CO2 fluxes during which upwelling intensification events (SST < 14 °C) occurred. Three events occurred during the first period (March), the first from 1 to 8 March, the second from 14 to 16 March, and the third on 20 March, with fluxes of 11.7, 6.4, and ~8 mmol C m-2 d-1, respectively. Four events occurred during the second period (April to June), which was the most intense of the year, the first around 15 April, the second between 22 and 30 April, the third between 14 and 16 May, and the fourth on 2 June, with fluxes of up to 15.7, 27, 8.5, and 18 mmol C m-2 d-1, respectively. One event occurred during the third period, from 25 June to 3 July, and one event occurred during the fourth period, from 3 to 10 August, with fluxes of up to 8.4 and 11.2 mmol C m-2 d-1, respectively (Fig. 2).
Upwelling systems are characterized by high primary production rates and are thus important sites for carbon fluxes across the continental margin; that is, there will be large fluxes of particulate organic carbon from the euphotic zone to the bottom. Coastal upwelling zones show oversaturation of CO2 with respect to atmospheric equilibrium due to the input of deep, DIC-rich waters (Rodríguez-Ibáñez et al. 2013). Nutrient inputs increase primary production, which in turn reduces the pCO2 values. These two processes have opposite effects on pCO2 (Borges et al. 2005). For example, very high oversaturation of CO2 with respect to the atmosphere (up to 1200 µatm) has been reported for coastal upwelling systems off Peru and Chile, known to be one of the most productive areas worldwide (Torres et al. 2002). The range of variation is smaller (100-800 µatm) for other upwelling systems, such as off the coast of California (Friederich et al. 2002).
Based on the few available estimates of annual CO2 fluxes for marginal seas, Borges et al. (2005) reported that areas with high upwelling index values, such as the coasts of California and Oman (Arabian Sea), tend to be sources of CO2, whereas regions with low upwelling index values, such as the Galician coast (Spain) and Vancouver Island (Canada), tend to be sinks of CO2.
On a large scale, the hydrographic conditions in our study area are influenced by changes in the CCS and, therefore, by seasonal and interannual variations (El Niño/La Niña), which are typical in this region of the Pacific (Linacre et al. 2010). During our study period, surface temperature and salinity values were within the range of values for SAW, characterized by temperatures of 8-22 °C and salinities of 33-34 (Durazo and Baumgartner 2002).
In our study area, during spring and summer, the main physical process that modified the hydrographic conditions near the shore was upwelling driven by the alongshore component of strong winds (>7.5 m s-1), resulting in the presence of relatively saltier, colder (<14 °C) surface water, rich in nutrients (Lara-Lara et al. 1980) and DIC, associated with high pCO2 values. Variability during summer and autumn and during winter and spring is mainly associated with the circulation patterns off California and northern Baja California, such as the poleward surface flow and intense mesoscale activity (Durazo et al. 2010).
Durazo et al. (2010) mention that in the region off northern Baja California, upwelling occurs throughout the year but with greater intensity in spring and summer. Our findings clearly show significant differences between the water-air CO2 fluxes estimated for spring/summer and autumn/winter. Lynn and Simpson (1987) observed that the CC intensifies in spring and summer due to norwesterly winds, which generate intense upwelling events. In early autumn, wind speeds decline and coastal upwelling weakens. In late autumn and early winter, the surface coastal countercurrent appears and inhibits upwelling (Hickey 1979).
The data obtained in the present study suggest that the variability of the CO2 fluxes at the buoy location can be divided into two periods. During spring and summer (March-August), when upwelling events predominated, the system acted as a source of CO2 to the atmosphere. Conversely, during autumn and winter (September-December), when the upwelling events weakened, the system acted as a sink of atmospheric CO2. These results differ from those obtained by Hernandez-Ayon et al. (2010) for the entire CCS off Baja California, including the oceanic zone. These authors reported, on average, CO2 fluxes from the atmosphere to the ocean in winter and spring, and fluxes from the ocean to the atmosphere in summer and autumn. An explanation for these differences could be that their averages included measurements for oceanic waters and were not only affected by local physical processes occuring near the shore, such as upwelling. Strictly speaking, the comparison of our results with those of Hernandez-Ayon et al . (2010) is not appropriate because the spatial and temporal scales are entirely different.
According to Pennington et al. (2010), two scenarios can be distinguished in coastal areas of the northwestern Pacific where upwelling events occur. In the first scenario, the water DIC concentration is high associated with relatively low surface temperatures (<13.0 °C), salinity close to 34, and high pCO2 values (>500 µatm). These conditions coincide with those found in this study, since the highest pCO2 values and CO2 fluxes were recorded in spring when the temperature was lowest (<14 °C) and salinity was close to 34. These conditions occur because, in our study area, the core of the CC, which transports low salinity (<34) SAW towards the equator, is located close to shore in spring (Linacre 2010). Durazo et al. (2010) reported that SAW was the only water mass recorded off Ensenada in 2009. The influence of SAW is maximum in spring, during the upwelling season when northwesterly winds predominate in the region (Perez-Brunius et al. 2007). In the second scenario, the coastal area can be neutral or act as a weak sink. In our study area, the system acted as a sink between September and January.
Chavez et al. (2007) observed that, on an annual basis, the Pacific coasts and areas close to 30°N latitude tend to act as a source of CO2 to the atmosphere, whereas areas above 40°N tend to be sinks. For waters off the Baja California Peninsula, De la Cruz-Orozco et al. (2010) reported a net annual flux of 0.41 mol C m-2 yr-1 and Hernandez-Ayon et al. (2010) reported, based on historical pCO2 data, a net annual flux of 0.97 mol C m-2 yr-1. Borges et al. (2005) compiled flux data for upwelling regions around the world and reported an average annual flux of 0.11 mol C m-2 yr-1. The results obtained in the present study are within the range of previously published CO2 flux values. Our findings show the large temporal variability of CO2 fluxes in a coastal area characterized by upwelling events.
To fully understand the role that the carbon cycle plays in climate change, other carbon compounds that act as greenhouse gases, such as methane (CH4) and chlorofluorocarbons, have to be studied. Large fluxes of CH4 from the sea to the atmosphere have recently been reported. For example, oversaturation of CH4 (up to >2000%) in Ballenas Channel waters (Gulf of California) suggests that the channel is a significant source of atmospheric CH4, with fluxes as high as 3.4 µmol CH4 m-2 d-1 (Macias-Zamora et al. 2013).

