


 nova página do texto(beta)
 Inglês (pdf)
 Artigo em XML
 Referências do artigo
 Enviar este artigo por email
 Citado por SciELO
  Similares em
SciELO
Similares em
SciELO 
 Permalink
Introduction
Redfish are widely distributed across the whole North Atlantic. In the central North Atlantic (ICES Divisions V, VI, XII, and XIV; Fig. 1) there are three species of redfish: Sebastes norvegicus (formerly known as Sebastes marinus, see Kendall 2000), Sebastes mentella, and Sebastes viviparus. The first two are subject to important fisheries in the area, while S. viviparus is of minor commercial value in Icelandic waters. Sebastes mentella and S. norvegicus were fished, historically, on the shelves and banks of the Faroe Islands, Iceland, and East Greenland (Bjornsson and Sigurdsson 2003). The start of a new pelagic S. mentella fishery in the Irminger Sea in 1982 resulted in the organization of a large-scale directed international fishery in the area (Sigurdsson et al. 2006).
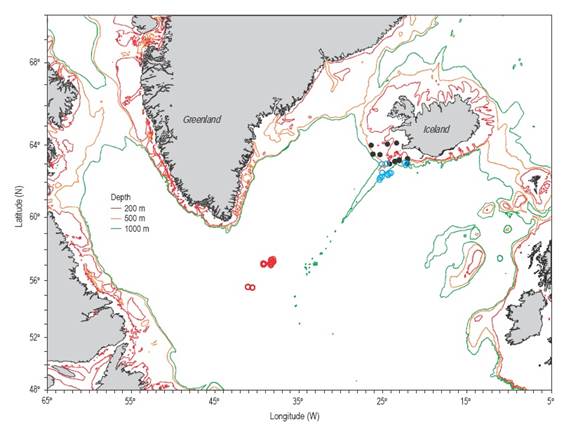
Figure 1 Sampling area of Sebastes norvegicus (filled circles) and Sebastes mentella (Iceland, blue circles; Irminger Sea, red circles) for fecundity analysis. Depth contours are 200 m (red), 500 m (orange), and 1000 m (green).
The golden redfish, S. norvegicus, in ICES Subareas V and XIV is considered as one management unit. However, considerable difficulties were encountered when defining the stock structure of S. mentella (Saborido-Rey et al.2004). The "Workshop on Redfish Stock Structure" (ICES 2009) reviewed the stock structure of S. mentella and concluded that there are three biological stocks of this species in the Irminger Sea and adjacent waters: a "Deep Pelagic" stock, a "Shallow Pelagic" stock, and an "Icelandic Slope" stock.
All Sebastes species are viviparous (i.e., the eggs are fertilized internally), and spawning is characterized by the parturition or extrusion of 40,000 to 400,000 pelagic larvae annually (Magnùsson and Magnùsson 1995). In redfish, viviparity is lecitotrophic (i.e., embryos are nourished by yolk; Wourms 1981). Thus, although embryos develop within the ovary their development is at the expense of previously accumulated yolk. Oocyte development in S. mentella and S. norvegicus is group-synchronous with a long vitellogenic period that extends from early summer to mid-winter when ovulation and fertilization occur (Saborido-Rey 1994). Embryogenesis lasts for one month (Sorokin 1961) and parturition occurs between March and April depending on the considered area (Sorokin 1961; Magnùsson 1980, 1983; Saborido-Rey 1994). Oocyte recruitment in redfish is determinate (Murua and Saborido-Rey 2003), meaning that at the time of ovulation the full stock of vitellogenic oocytes is recruited (i.e., the number of oocytes that potentially will be ovulated during the breeding season [potential fecundity] is determined prior to ovulation). However, not all the potential fecundity develops into eggs (realized fecundity) and follicular atresia may account for a substantial part of the fecundity in a process referred to as down-regulation (Óskarsson et al. 2000), often seen as a process to match the energy availability of the fish (Kurita et al.2003).
Studies of fecundity in North Atlantic Sebastes have been quite limited, with some work carried out a long time ago on S. norvegicus (Corlett 1964, Raitt and Hall 1967) and on S. mentella (St. Pierre and de Lafontaine 1995, Drevetnyak and Gusev 1996). In the Irminger Sea, fecundity of S. mentella has been studied only by Jones (1969). Studies on fecundity are essential to understanding stock reproductive potential (Tomkiewicz et al.2003, Saborido-Rey and Trippel 2013). Improving knowledge of fecundity dynamics and the causes of its variation is essential when estimating egg production, the main link between spawning stock and recruitment. While the biomass of S. norvegicus is at high levels (ICES 2014), the biomass of S. mentella has decreased in the last decade to its lowest historical level and there have been no signals of recruitment (ICES 2014). Fecundity dynamics is therefore a key factor to understand stock dynamics and to provide biological information for improving stock assessment.
In this paper, fecundity is analyzed in S. mentella and S. norvegicus in the Irminger Sea and Icelandic waters with special emphasis on their relation to several maternal features and fecundity down-regulation. Comparisons of relative fecundity between species and between stocks are made.
Materials and methods
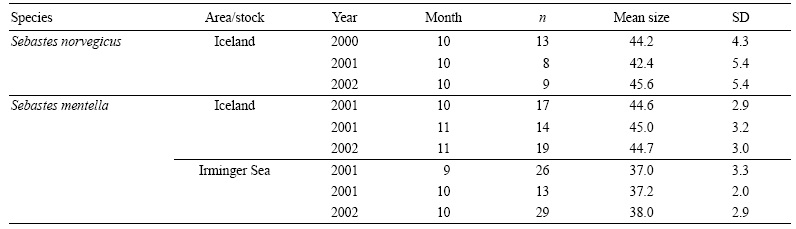
A total of 148 ovaries from mature female S. mentella and S. norvegicus were collected during commercial fishing surveys conducted in the Irminger Sea and off Iceland (Fig. 1, Table 1) using pelagic and bottom trawls (Sigurdsson et al. 2006). For each fish, total length, round weight, and gutted weight were recorded at sea.
Table 1 Number of analyzed gonads, mean body size, and standard deviation (SD) by species, stock, year, and month.
Histology and ovarian development staging
The ovaries were preserved in a 3.6% solution of phosphate buffered formaldehyde and stored for at least six months before measurements. Ovary sections of 0.5 cm from the central portion of the gonad were embedded in paraffin based on conventional histological processing and 3-μm sections were cut and stained with hematoxylin and eosin. Histology was used to determine the ovarian developmental phase based on the vitellogenic stages observed. To achieve this, vitellogenesis was divided into nine stages, between vitl (early vitellogenesis) and vit9 (late vitellogenesis).
All samples were histologically screened in order to assess the presence of massive atresia, a mechanism by which the ovary undergoes a mass reabsorption of yolked oocytes and individuals fail to spawn during a reproductive season (i.e., skipped spawning; Rideout and Tomkiewicz 2011). Failure to recognize mass oocyte atresia would affect the estimation of fecundity. Some authors have considered the presence of massive atresia when more than 50% of vitellogenic oocytes are affected (Kurita et al. 2003). However, a more conservative approach was taken and an ovary was considered to be undergoing massive atresia when more than 20% of the developed oocytes were atretic. For this purpose the normal vitellogenic oocytes and atretic follicles were counted in the whole section. Individuals showing massive atresia were not considered for fecundity estimation.
Fecundity analysis
Fecundity was determined using the gravimetric method (Bagenal and Braum 1978) in the same individuals on which histology was performed. All individuals were in the developing phase, showing vitellogenic oocytes but no signs of ovulation (presence of postovulatory follicles and/or larvae). The ovary weight after fixation was recorded at the laboratory with a precision of 0.01 g and subsamples of about 250 mg were taken from a central ovary section. Oocytes were separated from connective tissues using a washing process (modified from Lowerre-Barbieri and Barbieri 1993) and separated by size through sieving. The cortical alveoli follicle diameter, measured in histological sections, defined the minimum mesh size of the sieves. Before they were counted, oocytes were placed in a glycerine/water solution (1:3) in order to keep their form and to prevent them from splitting (Fitzhugh et al. 1993, McBride and Thurman 2003).
Oocyte counts and size measurements were obtained at the same time using a computer-aided image analysis system. Measurements were performed using the software QWin (Leica Imaging Systems) on a computer connected to a video camera (Leica DFC490, 8 megapixels) mounted on an automated macroscope (Leica Z6 APOA). The system provides automatic calibrated images at any magnification. Camera and light settings were established at the beginning of the analysis and kept constant throughout the whole analysis. Due to the amount of oocytes measured per sample (ca. 450 oocytes), and to allow a quick and precise image analysis, each sample was divided into 4-8 subsamples, each of them analyzed separately. The subsample is placed on a watch glass under the macroscope objective. The shape of the watch glass groups all oocytes together in a single layer. The image analysis described below identifies each oocyte even if they are touching each other. Oocytes were counted and measured using a semiautomatic software routine developed by one of the authors (FS-R) for this study. The routine lets the user upload or acquire a digital image (Fig. 2a) that is then automatically transformed by applying successive morphological operators (erosion and dilation), until converting the image data into a binary image that accurately represents the oocytes that have to be measured and counted (Fig. 2b). The oocytes in the binary image are then separated using segmentation algorithms (Fig. 2c). During the automatic process the user can manually intervene in the key steps and modify the algorithm parameters. Then, the routine undergoes several measurements of each binary object, i.e., oocyte (Fig. 2d). Oocytes with a diameter (longest or shortest) out of the range defined by the mean ± 2.5 x standard deviation were consid ered outliers and completely excluded from the analyses. Oocytes with a roundness value higher than 1.15 were considered as departing from the sphericity and excluded from the diameter estimation, but included for the fecundity estimation. The final oocyte diameter was defined as the ratio between the longest and shortest diameter.
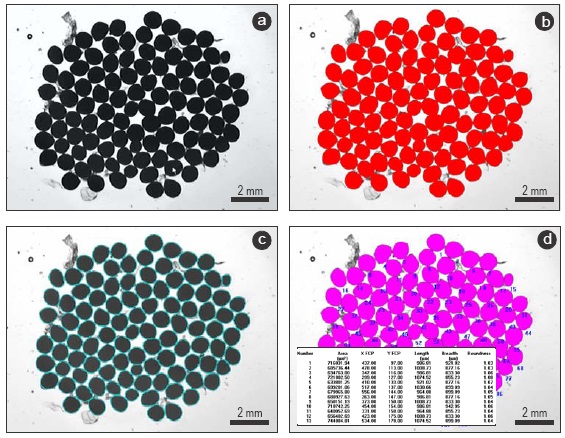
Figure 2 Images showing the different steps of the semiautomatic routine for counting and measuring oocytes. (a) Original digital image of oocytes before analysis. (b) The same image with a binary overlay (red layer) showing selection of the area to be measured and counted. (c) Binary image after applying segmentation algorithms and showing individual oocytes (outlined in blue). (d) Performance of automatic measurements of binary objects (i.e., oocytes; pink layer).
Potential fecundity for each individual was estimated as the ratio of the ovary weight after fixation and the subsample weight multiplied by the total number of oocytes in the subsample.
Relative fecundity of each female was estimated as the ratio between potential fecundity and female gutted weight. Relationships between fecundity and length, gutted weight, gonadosomatic index (GSI), and condition factor (K) were studied in order to explore which of them explained better the fecundity variability. K was estimated as the ratio between gutted weight and the cube of the respective length. For most fish, fecundity increases geometrically with length and weight, and is best described by a power function. However, we have explored the data with a linear fit and a power fit using a generalized linear model (GLM) and the Akaike Information Criterion (AIC) to select the best model. A Gaussian GLM with log link was finally used to investigate maternal effects, for each female attribute separately and with all predictors in the same model. To estimate fecundity down- regulation, analyses were conducted for each month separately. Differences in mean oocyte diameter between months were compared using ANOVA and the Tukey HSD post-hoc test. GLMs with each of the female features as covariates were used to compare fecundity relationships by species, stock, and month. For this purpose the linear regressions of fecundity and length were made using log-transformation of variables. R (R Development Core Team 2011) was used for all calculations.
Results
Five out of 148 ovaries showed massive atresia (i.e., with more than 20% of developing oocytes being atretic). All of them belonged to S. mentella collected in November 2002 in mid-vitellogenesis (stage 5, mean diameter of normal oocytes was 833 μm). The mean diameter of normal vitellogenic oocytes did not differ between these females and the others from the same month (F = 1.63, P = 0.22); however, relative fecundity was significantly lower in those females (F = 25.49, P < 0.001). Since these samples would probably affect the subsequent fecundity analyses, they were not further considered in this study.
Non-vitellogenic oocytes appear as very small and fully transparent oocytes in the connective tissue, and they were not counted or measured by the software routine. Of the rest of the oocytes, only 159 oocytes out of 84,124 (0.19%) were considered outliers, most of them being very small. These outliers were considered non-developing oocytes (i.e., vitel- logenic oocytes that interrupted their development at an early stage) and so they were not considered for the fecundity estimation. On the other hand, up to 12.3% of the oocytes showed a roundness factor higher than 1.15 and were excluded from the diameter estimation.
Oocyte development
All S. norvegicus females were found in a similar developmental stage, most of them at vit3. They were captured (sampled) in October but in three different years (Table 1). On the contrary, S. mentella females were at different developmental stages. They were captured from September to November in two different years. However, differences in developmental stage were not related to sampling time, except for S. mentella in the Irminger Sea (Fig. 3a) that showed a significant increase in oocyte diameter between September and October (ANOVA, F = 62.12, P < 0.001). The mean oocyte diameter (individuals at different developmental stage pooled) was significantly different between species (ANOVA, F = 292.98, P < 0.001) and between stocks (ANOVA, F = 171.91, P < 0.001). Histological developmental stage and oocyte diameter were highly correlated (Spearman R = 0.80, P < 0.001, all species and stocks pooled), with low dispersion around the mean for each stage (Fig. 3b; i.e., oocyte diameter is a proper index of oocyte development). However, the mean oocyte diameter was significantly different between Irminger Sea and Icelandic S. mentella at all stages except stage 5 (all months pooled, ANOVA, P < 0.05; Fig. 3c).

Figure 3 Mean oocyte diameter in the Irminger Sea and Icelandic waters (a) by month, (b) by oocyte developmental stage (all species and stocks combined), and (c) for Sebastes mentella stocks. Whiskers represent standard deviation.
Oocyte diameter was not related to female body length or gutted weight in S. norvegicus and in the Irminger Sea S. mentella (GLM, P > 0.5 in all cases), but was positively and significantly related in Icelandic S. mentella (GLM, P <0.001), although explaining little variance (less than 30%). The condition factor was not related to oocyte diameter in any case. However, there was a significant difference in female length between the S. mentella stocks (ANOVA, F = 54.48, P < 0.001).
Fecundity regulation in S. mentella
Potential fecundity in S. mentella (Fig. 4a) increased significantly with female length in each month (GLM, P <0.001 for all months) but decreased significantly at all sizes from September to November (GLM, P < 0.001 for all comparisons). Relative fecundity (Fig. 4b) decreased significantly from September to November, from 98 oocytes g-1 female in September to 64 and 52 oocytes g-1 female in October and November, respectively (ANOVA, F = 31.14, P < 0.001). This trend clearly shows a down-regulation of the fecundity. Mean relative fecundity (Fig. 4c) declined in relation to oocyte diameter when using a power function (GLM on log-transformed variables, r2 = 0.67, P < 0.001).

Figure 4 Fecundity analysis of Sebastes mentella in the Irminger Sea and Icelandic waters. (a) Fecundity-female length relationships by month; for October, the relationships for the Irminger Sea (red line) and Iceland (blue line) stocks are shown. For graph clarity only the mean fecundity by size class is shown. (b) Relative fecundity (mean and standard error). (c) Mean relative fecundity (mean and standard error) by oocyte diameter class. (d) Proportion of oocytes down-regulated by female length between September and November.
Fecundity decreased by 34-36% between September and October virtually at the same rate at all size classes (30-50 cm, Fig. 4d). However, from October to November, fecundity down-regulation rates were clearly influenced by female length, ranging from 19% in larger females to 36% in the smallest (Fig. 4d). Thus, from September to November fecundity decreased by 51% on average, ranging from 46% to 59%.
Due to the effect of down-regulation, potential fecundity was hardly comparable between the S. mentella stocks because the September samples were taken from the Irminger Sea and the November samples from the Icelandic slope. The October samples were taken from both stocks (Table 1), but there was virtually no overlap in female body size between stocks. Yet, the fecundity-length relationships within each stock did not differ from the common fecundity-length relationship (Fig. 4a, GLM, P = 0.086). However, when considering the same oocyte developmental stage (700-1000 μm diameter range, stages 7 and 8), potential fecundity differed significantly between stocks (GLM, P < 0.0001). It is not possible to elucidate whether fecundity between stocks really differs or whether it is oocyte diameter that is different due to the down-regulation feature.
Maternal effects on fecundity
October was the month with the largest number of samples available for both species (Table 1), so it was chosen to analyze potential fecundity variation in relation to maternal features. Given the significant difference in oocyte diameter between species, a comparative analysis between species was not made.
Potential fecundity in S. norvegicus ranged from 34,500 to 212,000 oocytes for females measuring between 33 and 52 cm (450 to 1800 g). The estimated mean potential fecundity was 123,300 oocytes. Relative fecundity ranged from 72 to 180 oocytes g-1 of gutted weight (average of 116 oocytes g-1). Potential fecundity fitted better to a power than to a linear function for all predictors used (based on AIC from GLM comparison, Fig. 5). All maternal features had a significant influence on fecundity except K (Table 2). However, the variance explained by GSI was too low (20%) and only acceptable for length and weight (above 70%). The allometric coefficient of the fecundity-length relationship differed significantly from 3 (Table 2), yet the complete model showed that only female length had a significant influence on fecundity. Relative fecundity did not fit significantly to any maternal feature, neither using linear nor power functions (GLM, P > 0.05 in all cases).
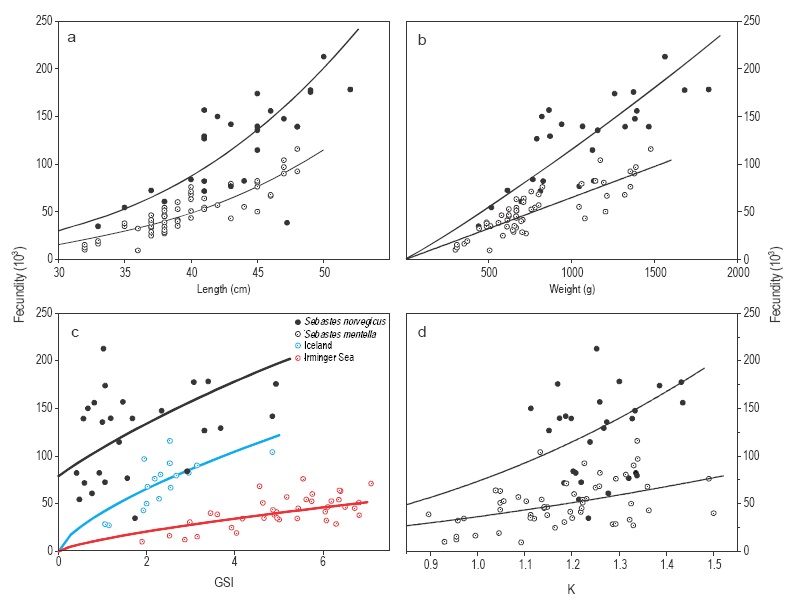
Figure 5 Fecundity of Sebastes norvegicus (filled circles) and Sebastes mentella (empty circles) in the Irminger Sea and Icelandic waters related to (a) total length, (b) gutted weight, (c) gonadosomatic index (GSI), and (d) condition factor. Samples of S. mentella in (c) are shown by location: Irminger Sea (red circles) and Icelandic waters (blue circles).
Table 2 Maternal effect on fecundity: results of the generalized linear model of maternal variables on fecundity estimated in October, for each predictor separately and for the complete model (fecundity ~ length + weight + gonadosomatic index [GSI] + condition factor [K]).

Potential fecundity in S. mentella ranged from 9,000 to 115,500 oocytes for females measuring between 32 and 48 cm (300 to 1500 g). The estimated mean potential fecundity was 50,013 oocytes. Relative fecundity ranged from 18 to 94 oocytes g-1 of gutted weight (average of 64 oocytes g-1). Relative fecundity did not fit significantly to any maternal feature, neither using linear nor power functions (GLM, P > 0.05 in all cases). However, potential fecundity significantly increased with all maternal features (Table 2, Fig. 5) except for GSI. As with S. norvegicus, length and weight were the best predictors of fecundity, with a coefficient of determination above 0.7, while the predictive power of GSI and K was too low. The exponent of the fecundity-length power function differed significantly from 3 (Table 2). In the case of GSI, however, the relationship with fecundity differed between stocks (Irminger Sea and Icelandic waters, GLM, P < 0.001) and, therefore, a separate analysis was made for both. This analysis revealed that fecundity was significantly related to GSI in both stocks (Table 2), especially the Iceland stock, with a coefficient of determination of 0.7. The complete model indicates that both length and GSI have a significant influence on fecundity; the deviance explained by this model increased to 86% with respect to the the simple fecundity-length model (Table 2).
Discussion
Follicular atresia is a rapid degenerative process by which oocytes at different stages are lost from the ovary (Hunter and Macewicz 1985, Guraya 1986). In determinate fecundity species, atresia is rarely generalized and, when present, it occurs sparsely over the reproductive season, while fishes with indeterminate fecundity show a generalized prevalence of atresia and resorption of mature oocytes at the end of the spawning season (Murua and Saborido-Rey 2003). The presence of atresia has been related to several factors (Guraya 1986), like light, temperature, or stress, but normally to decreased nutritional condition (Bagenal 1969, Wootton 1973, Kjesbu et al. 1991, Kraus 2002) and removal of damaged or abnormally developing oocytes (Bromley et al. 2000). However, generalized or massive atresia is not well documented, although it has been reported in several species (see the review by Rideout and Tomkiewicz 2011). In redfish, mass atresia is a common feature at previtellogenic stage and rarer during vitellogenesis (FS-R, unpublished data). Its presence during vitellogenesis means that fish will not spawn, since there is not sufficient time to develop another clutch of oocytes.
Potential and relative fecundity were higher earlier in the season and with lower mean oocyte diameter (i.e., in earlier developmental stage). This indicates that there is an important reduction of potential fecundity as the reproductive season develops, and atretic losses must therefore be carefully quantified. Several studies have shown that not all the recruited oocytes (potential fecundity) develop into eggs (realized fecundity), and follicular atresia may account for a substantial part of the fecundity in a process referred to as down-regulation (Murua et al.2003, Armstrong and Witthames 2012). Several species have been shown to recruit more follicles than are taken to full development, especially in capital spawners (such as redfish), where fecundity is then down-regulated by atresia in relation to available energy reserves (Kurita et al.2003, Armstrong and Witthames 2012). The mechanism behind down-regulation seems to be related to the fact that it is energetically inexpensive to recruit a large quantity of small, early-stage vitellogenic follicles, but energetically expensive to grow them through the final stages of vitellogenesis (Kjesbu et al.1991).
Our results show that the highest rate of down-regulation occurs at early development (small oocyte diameters), which differs from that observed in other species where down-regu- lation appears to occur mainly in the later stages of vitello- genesis (Armstrong and Witthames 2012 and references therein). However, female size seems to play an important role in down-regulation in redfish, but only during the late stages of development; that is, rates of down-regulation are similarly high at all sizes during early vitellogenesis, when on average fecundity is reduced by 35%, but decline considerably in larger females later in the season. Although down- regulation has been mostly associated with condition, the influence of size on atresia has been reported also for herring (Kennedy et al. 2011). Condition does not seem to have influenced oocyte diameter or relative fecundity; however, it positively increased with female size, so likely both, size and condition, were associated with the highest rate of down- regulation at smaller sizes.
Knowledge of the down-regulation process is essential to select the proper sampling time and the oocyte developmental stage at which fecundity should be estimated (Kjesbu 2009). We have found that vitellogenesis occurs at different rates between species and stocks (i.e., in October the oocyte diameter was different between S. norvegicus and S. mentella , and also between the Icelandic and Irminger Sea stocks). Sampling for potential fecundity should be conducted as close as possible to the time of spawning (i.e., fertilization in redfish), to obtain unbiased estimations of potential fecundity. In redfish, oocyte diameter should be used as indicative of the proper moment to estimate fecundity. However, more studies are needed to assess how oocyte diameter in late vitellogenesis differs among redfish species and stocks. Alternatively, our approach allows the quantification of down-regulation using a regression of relative fecundity vs follicle diameter, which provides standardized fecundity values for those follicle diameters close to the value at which oocytes will progress to fertilization, in red- fish, or to spawning, in other species (Thorsen et al. 2006).
Histology of the Irminger Sea October samples showed that oocytes were already in advanced vitellogenesis, with an oocyte diameter above 1.1 mm on average. This value is coincident with that reported by Jones (1970) for the same quarter. Moreover, this size is close to the average size of pre fertilized oocytes in Icelandic S. mentella (Jones 1970) and S. norvegicus collected when they were at a very late stage of oocyte maturation (migratory nucleus, or even fertilized eggs), showing an average diameter of 1.25 mm (FS-R, unpublished data). Studies of Pacific rockfish species have reported similar oocyte sizes at the very end of the developmental stage (Bowers 1992, Koya et al. 1995). It can therefore be hypothesized that in late October most, if not all, of the yolk has already been accumulated. Hence, the potential fecundity estimated in this study can be representative of realized fecundity, because from that stage on, few atretic losses are expected (Witthames et al. 2009).
Potential fecundity of S. mentella in the Irminger Sea ranged from 10,000 to 80,000 oocytes per female in the surveys conducted late in the year, when fecundity values are closer to those of realized fecundity. These values are generally in accordance with those previously obtained in the Irminger Sea (Jones 1969), but the fecundity-length relationship was quite different (Fig. 6a). While fecundity at larger sizes was similar, it differs greatly at smaller ones. This difference is probably due to the way fecundity was estimated at earlier developing stages by Jones (1969), as shown by the high dispersion in the scatterplot (Fig. 5 in Jones 1969). In fact, the values are similar to those obtained in this study in September. In the cited scatterplot, low fecundity values at larger sizes can be observed as outliers (likely due to the occurrence of atresia), modifying the curve shape and the parameter estimation. Fecundity of S. mentella has also been reported in the Barents Sea (Drevetnyak and Gusev 1996) and the Gulf of St. Lawrence (St. Pierre and de Lafontaine 1995). Though sampling was conducted during the same month (January) in these two studies, fecundity values were considerably different, especially at larger sizes, but they were quite similar to our October and November values, respectively (Fig. 6a). The effect of down-regulation is likely the cause of these differences. Thus, the low fecundity found in the Gulf of St. Lawrence may be explained by the potential fecundity decrease as the reproductive cycle progresses, because those fecundity values were almost identical to our November values. Unfortunately, no information on oocyte diameter is given in these two studies in order to compare the developmental stage. In relation to other North Atlantic Sebastes species, fecundity has been estimated only in S. norvegicus from Iceland and the Faroe Islands in late winter (Raitt and Hall 1967). Fecundity values of that study were very similar to those obtained for S. mentella from the Barents Sea and also to our October values, but were far below the S. norvegicus values in this study (Fig. 6b). Again, this can be likely due to the occurrence of down-regulation, as in our study average oocyte diameter for S. norvegicus was still low; that is, vitellogenesis was in an earlier stage com pared with the samples collected by Raitt and Hall (1967) in late winter, which were probably in advanced vitellogenesis. The examples discussed above show that comparing fecundity values estimated at different developmental stages is not reliable.
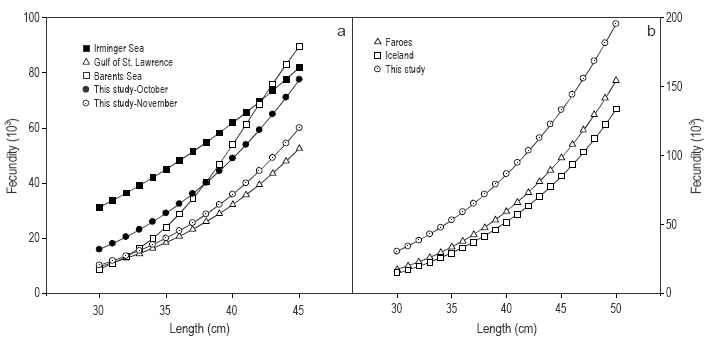
Figure 6 Comparison of fecundity-length relationships of (a) Sebastes mentella from the Irminger Sea (Jones 1969), Gulf of St. Lawrence (St. Pierre and de Lafontaine 1995), Barents Sea (Drevetnyak and Gusev 1996), and this study; and (b) S. norvegicus from the Faroe Islands and Iceland (Raitt and Hall 1967) and this study. Note the different scale between both graphs.
Pacific Sebastes species show a huge variation both in fecundity and in reproductive strategies, as can be seen in different studies (Gunderson et al. 1980, Boehlert et al. 1982, Love and Johnson 1998) and especially in the review of fecundity in several rockfish species carried out by Haldorson and Love (1991). Comparing individuals of the same size, nearly all the Pacific species showed higher fecundity values than those obtained in this study. The cause can be related to the temperature of the waters, as most of the studied Pacific species inhabited temperate northeastern Pacific waters south of 55° latitude. Only Sebastes alutus, the species living in colder and northern waters, showed fecundity values close to those of S . mentella . The relative fecundity of 23 Sebastes species off California (MacGregor 1970) was two to eight times higher than in S. mentella in this study. However, oocyte diameter in those Pacific rockfish (an aver age of 0.6-0.8 mm) is considerably lower than in S. mentella.
The exponent of the power relationship between fecundity and length of S. mentella was greater than 3, which is in accordance with previous values estimated for S. mentella in other areas (St. Pierre and de Lafontaine 1995) and for other Sebastes species from the Pacific and Atlantic oceans (Corlett 1964, Raitt and Hall 1967, Gunderson 1977, Haldorson and Love 1991). It implies that total egg production increases notably with the proportion of larger fish in the spawning stock, rather than with the spawning stock biomass itself (i.e., there is an increasing reproductive potential with female size in redfish). The assumption that spawning stock biomass is proportional to the reproductive potential of the stock has long been recognized as invalid (Saborido-Rey and Trippel 2013). The influence of maternal attributes on reproductive features has been studied in different species through different factors, such as the influence of condition (feeding) on fecundity (Kjesbu et al. 1991, Bromley et al. 2000, Kraus et al. 2000) or the influence of age/size and condition on eggs and larval characteristics (Hislop 1988, Buckley et al. 1991, Marteinsdottir and Steinarsson 1998, Trippel 1998, Vallin and Nissling 2000, Saborido-Rey et al. 2003). In other species, female size and condition are positively correlated with egg diameter (Kjesbu et al. 1991, Marteinsdottir and Steinarsson 1998, Vallin and Nissling 2000, Marteinsdottir and Begg 2002). However, in this study, oocyte diameter was generally not influenced by any of the analyzed maternal features.
Summarizing, in redfish, weight and length have a significant influence on fecundity, but not on oocyte diameter. This may be a logical strategy in viviparous species, since the production of larger eggs does not confer any particular advantage to the larvae that develop within the ovary, but to invest energy surplus in producing more eggs is clearly an advantage. This may explain why fecundity was not influenced by condition at earlier stages of development, but was at later stages when oocytes significantly increased in size and fecundity was corrected by atretic losses. Varying energy storage in body weight may have reduced differentially the fecundity and hence the observed stronger correlation of condition, weight, and length. Given the importance of down-regulation in redfish, more research is necessary to ascertain the atresia mechanisms in redfish and the relation to female attributes and the impact on population fecundity.

