


 nueva página del texto (beta)
 Inglés (pdf)
 Artículo en XML
 Referencias del artículo
 Enviar artículo por email
 Citado por SciELO
  Similares en
SciELO
Similares en
SciELO 
 Permalink
Introduction
The ecological role of seagrasses in estuaries and coastal systems has been well established. In the Mediterranean Sea, for example, Posidoniaoceanica and Cymodoceanodosa are the main submerged aquatic vegetation components of sandy and rocky coastal areas (Cancemiet al. 2002, Olesen et al .2002. Similarly, Zostera marina is the most abundant submerged aquatic plant in the coastal lagoons of Baja California, Mexico, accounting for the bulk of the plant biomass in these systems (Cabello-Pasini et al.2002, 2003). These seagrass meadows serve as habitat and forage for a vast number of marine organisms (Quiroz-Vazquez et al. 2005, Schrandt et al.2015). Productivity and biomass of these seagrasses vary seasonally as a result of changes in environmental conditions, such as nitrogen concentration in the water. Nitrogen and carbon concentrations in the tissue of marine macrophytes also fluctuate as a result of nitrogen availability, irradiance, and temperature (Corzo and Niell 1991, Cabello-Pasini et al. 2004). In seaweeds, tissue absorptance generally covaries with chlorophyll and nitrogen content, and consequently varies seasonally as a result of irradianceor nitrogen concentration in the medium (Ochoa- Izaguirre and Soto-Jiménez 2013). The effect of seawater nitrate concentration on the internal carbon and nitrogen levels as well as bio-optical properties in seagrass shoots, however, are less understood.
Generally, the evaluation of plant photosynthetic rates has been conducted using oxygen evolution or carbon incorporation methods. Fluorometric methods, however, have become common procedures for the study of photosynthesis in marine angiosperms in the last two decades (Ralph and Burchett 1998, Beer and Bjork 2000, Figueroa et al.2002, Beer and Axelsson 2004). Pulse amplitude modulated (PAM) fluorometry of in vivo chlorophyll fluorescence associated with photosystem II (PSII) evaluates primary reactions and quenching mechanisms under natural or artificial light conditions (Genty et al.1989). Electron transport rate (ETR) has been shown to be positively correlated to oxygen evolution and CO2 fixation, especially in C4 plants, as long as environmental stresses do not impose restrictions on photosynthetic CO2 metabolism (Genty et al. 1989, Edwards and Baker 1993). In some seaweeds and seagrasses, however, oxygen evolution and ETR have been shown to be ambiguous, especially at high irradiances (Beer and Axelsson 2004).
Photosynthetic characteristics of seagrasses are dependent on irradiance, temperature, tissue type, and light history of the sample. While the effects of temperature and irradianceon the photosynthetic characteristics of seagrasses have been well established (Beer and Axelsson 2004), less is known regarding the effect of nutrient concentration on ETR in these aquatic macrophytes. Similar to marine macroalgae, it has been observed that optimum quantum yield covaries with Si and P concentrations in phytoplankton (Kolber et al.1990, Babinet al.1996, Young and Beardall 2003). Furthermore, the relationship between ETR and gross photosynthesis (GPS) in the Chlorophyta Ulva rigida and in the Rhodophyta Porphyraleucosticta has been shown to be dependent on the nitrogen content in the medium (Figueroa et al. 2003, Cabello-Pasini and Figueroa 2005). While seagrass populations are often exposed to large fluctuations in nitrogen concentration (i.e., upwelling events, Zaitsevet al.2014), the effect of nitrogen concentration on the ETR-GPS relationship is unknown. Consequently, the objective of this study was to evaluate the effect of nitrate concentration on GPS and ETR of the seagrass C. nodosa under laboratory conditions. Since nitrogen metabolism relies on carbon precursors, adenosine triphosphate (ATP), and reductants formed during photosynthesis, the examination of the relationship between different elemental (nitrogen and carbon contents), bio-optical (absorptance), and physiological (photosynthesis and respiration rates) parameters will give new insights into the interactions between nitrogen and carbon metabolism in C. nodosa in particular and seagrasses in general.
Materials and methods
Plant material
In March 2005, the seagrass Cymodocea nodosa (Ucria) Ascherson was collected from the intertidal zone of Fuengirola, Spain (36°32' N, 4°37' E), and transported in ice coolers to the laboratory. Shoots of approximately 10 cm in length (approximately 2 g total fresh weight [FW]) were incubated from two to three weeks in six acrylic containers (2 L, 15 samples per container) with seawater containing 10 µ.M PO4 3- and 0, 2, 5, 25, 50, and 100 µM NO3. Seawater for medium preparation contained less than 1 µM NO3 and NH4+. Nutrients were added and seawater was changed every day. Samples were supplied with an irradiance of 100 µmol photon m-2 s-1 using daylight fluorescent lamps (Osram FL 18W) and were kept on a 14:8 h (light:dark) photoperiod. Shoots were anchored to the bottom of the containers by tying their rhizomes to a weighted plastic mesh. The culture medium was maintained at 15 °C and kept in constant movement by bubbling air into each container.
Chlorophyll and CHN determination
Chlorophylls a and b were extracted in N,N-dimethyl- formamide (DMF) according to Inskeep and Bloom (1985). Tissue samples (2.5 cm2, n = 6) were incubated in 3 mL of DMF for 24 h at 4 °C in darkness. Absorbance was determined using a spectrophotometer and chlorophyll concentration was estimated using the equations proposed by Porra et al. (1989).
After the incubation period, samples were dried at 60 °C until constant weight was obtained. Total intracellular carbon and nitrogen contents (g/g) were determined (n = 6) using a PerkinElmer elemental analyzer (model 2400 CHN).
Oxygen evolution and chlorophyll fluorescence
Photosynthetic rates in C. nodosa shoots were determined using polarographically-measured rates of steady-state O2 evolution (Rank Brothers, UK). Tissue (n = 6) of approximately 0.2 g FW wasincubated in seawater (2.2 mM dissolved inorganic carbon) at 15 °C in 5-mL jacketed chambers connected to a water-circulating bath after a 0.5 h preincubation in darkness. Halogen lamps (Quartzline, 150 W) were used as a light source, and photosynthetic photon flux was varied from 0 to 600 µmol photon m-2 s-1 using neutral-density filters (Lee Filters, UK). Maximum oxygenic photosynthesis (Pmax), the initial slope of the photosynthesis vs irradiance curve (αoxy), the threshold for irradiance-saturated photosynthesis (Ek), and respiration were determined by adjusting the data to the exponential equation (Sigma Plot, Jandel Scientific) described by Webb et al. (1974). GPS was calculated by adding net photosynthesis and respiration measured after each irradiance period.
In vivo chlorophyll fluorescence of PSII was determined (n = 6) with a portable pulse amplitude modulated fluorometer (Diving PAM, Walz, Germany). Basal fluorescence (Fo) was determined after maintaining the tissue in darkness for 1-2 h. A saturating actinic light pulse (9000 µmol photon m-2 s-1, 800 ms) was applied to obtain maximum fluorescence (Fm) in the dark-acclimated samples. Variable fluorescence (Fv) was determined as the difference between Fm and Fo, and optimum quantum yield was calculated as the ratio of Fv to Fm (Schreiber et al. 1994). The effective quantum yield of PSII (Фpsii) was determined in light-acclimated tissue according to Schreiber and Neubauer (1990):

Where F'm is the maximal fluorescence of light-acclimated tissue induced by a saturating actinic light pulse (9000 µmol photon m-2 s-1, 800 ms), and Ft is the intrinsic steady-state fluorescence in light-acclimated tissue. The optic fiber of the PAM fluorometer was kept at a 45° angle from the tissue.
ETR was determined according to the following formula:

where AQλ is the absorbed photons calculated as the product of the integration of the spectral absorptance (Aλ) between 400-700 nm and spectral irradiance of the light source (E), FII is the fraction of AQ directed to PSII including its light- harvesting complexes, and ФPSII is the effective quantum yield or quantum yield of PSII charge separation. Values of FII for different pigment groups can be estimated by determining the fraction of chlorophyll a associated with PSII and its corresponding light-harvesting complexes (Grzymskiet al. 1997). For example, FII values are approximately 0.5 for Chlorophyta and vascular plants (Grzymskiet al . 1997, Figueroa et al. 2003).
Tissue absorptance (Aλ, n ≥ 6) was determined at 1-nm intervals between 400 and 700 nm using an integrating sphere (LIC0R-1802) connected to a spectroradiometer (LICOR-1800 UW) according to thefollowing formula (Schreiber and Neubauer 1990):

Where Tλ is transmittance and Rx is reflectance of the tissue.
Simultaneous measurements of oxygen evolution and ФPSII were conducted by introducing the PAM's optic fiber into the oxygen chamber. The optic fiber was placed at a 45° angle with respect to the shoot tissue. Values for ФPSII were determined after achieving steady oxygen evolution (approximately 5 min) at each experimental irradiance. Irradiance was increased using neutral density filters after a 10 min period of darkness.
Data analysis
Differences in effective quantum yield, chlorophyll levels, absorptance, Pmax, αoxy, Ek, respiration, and the GPS to respiration ratio (GPS/R) as a function of nitrate treatment were evaluated using a one-way analisis of variance after testing for normality and homoscedasticity of the data (Sokal and Rohlf 1995). All pairwise multiple comparisons were conducted using Tukey's test. The correlation significance between seawater nitrate concentration, tissue carbon, tissue nitrogen, carbon to nitrogen ratios (C/N), effective quantum yield, GPS, and ETR values was tested using Pearson's product moment correlations. Minimum significance level was established at P < 0.05.
Results
Carbon and nitrogen concentrations in C. nodosa tissue varied in relation to the nitrate incubation treatment (Fig. 1). There was an increasing trend of carbon levels in the tissue from 38.6 ± 1.6% in shoots incubated at 0µM NO3- to 41.1± 1.7% in shoots incubated at 100 µM NO3- however, there were no statistical differences among treatments (P > 0.05, Fig. 1a). Nitrogen levels in the tissue increased linearly from 2.1 ± 1.7% in shoots incubated at 0µM NO3- to3.4±0.6% in shoots incubated at 100 µM NO3- (P < 0.05, Fig. 1b). While carbon levels increased 6.5%, nitrogen levels in the tissue augmented more than 60% when nitrate in the medium increased from 0 to 100 µM There was a 30% decrease in the C/N ratio in the tissue when nitrate in the medium increased from 0 to 100 µM (P < 0.05, Fig. 1c).

Figure 1 Carbon concentration (a), nitrogen concentration (b), and carbon to nitrogen ratio (C/N) (c) in the tissue of Cymodocea nodosa incubated at different nitrate levels.
Chlorophyll a + b levels in tissue of C. nodosa fluctuated as a function of nitrate levels in the seawater (Fig. 2a). The lowest chlorophyll levels (0.64 ± 0.12 mg g-1 FW) were found in shoots incubated at 0 µM NO3, and chlorophyll levels saturated (0.89 ± 0.11 mg g-1 FW) in shoots exposed to nitrate levels between 25 and 100 µM. Chlorophyll levels were approximately 30% greater (P < 0.05) in shoots exposed to 25-100 µM NO3 than in shoots exposed to 0µM NO3- Similar to chlorophyll contents, tissue absorptance fluctuated as a function of nitrate concentration in the seawater (Fig. 2b). The lowest absorptance levels (0.65 ± 0.05, P< 0.05) were observed in shoots incubated at 0-5 µM NO3- and absorptance saturated (0.74 ± 0.01) in those incubated at 25-100 µM NO3-.

Figure 2 Chlorophyll a + b concentration (a) and absorptance (b) in the tissue of Cymodocea nodosa incubated at different nitrate levels. Data points indicate the average of six samples ± standard deviation.
Maximum rates of oxygen evolution and electron transport in C. nodosa in general increased as a function of nitrate availability. In general, O2-based photosynthesis was saturated at lower irradiances relative to ETR (Fig. 3). Values of Pmax augmented by 25% when nitrate in the medium increased from 0 µM to more than 25 µM (P < 0.05, Fig. 4a). Except for ETRmax values for shoots incubated at 50 µM NO3, ETRmax values increased (P < 0.05) when nitrate in the medium increased (Fig. 4a). The initial slope of oxygen evolution (αoxy) increased (P < 0.05) from approximately 15 nmol O2 gFW-1 min-1 (µmol photon m-2 s-1)-1 in shoots with 0-5 µM NO3- in the medium to approximately 25 nmol O2 gFW-1 min-1 (µmol photon m-2 s-1)-1 shoots incubated at 25-50 µM NO3- In contrast to αoxy, the lowest values of αETR (0.28± 0.03µmol e-m-2 s-1 (µmol photon m-2 s-1)-1 P <0.05) were observed in shoots incubated at 0µM NO3- however, values saturated at approximately 0.43 ± 0.03 in shoots incubated at 2-100 µM NO3 (Fig. 4b). Values of Ek were approximately four-fold greater (P < 0.05) when determined by fluorimetric methods than when determined by oxygenic methods. Oxygenic Ek values remained relatively constant (25-30 µmol photon m-2 s-1) whereas fluorimetric Ek values decreased from approximately 120-130 µmol photon m-2 s-1 in shoots incubated at 0-25 µM NO3- to 67-98 µmol photon m-2 s-1 in shoots incubated at 50-100 µM NO3- (Fig 4c).

Figure 3 Relationship between gross photosynthesis and irradiance (a) and between electron transport rate and irradiance (b) in Cymodocea nodosa incubated at different nitrate levels. Data points indicate the average of six samples ± standard deviation. Error bars not shown are smaller than symbol size.

Figure 4 (a) Maximum oxygenic photosynthesis (Pmax, µmol O2 gFW-1 min-1) and maximum electron transport rate (ETRmax, µmol e m-2 s-1), (b) initial slope of the oxygenic photosynthesis vs irradiance relationship (αOXY, µmol O2 gFW-1 min-1 [µmol photon m-2 s-1]-1) and initial slope of the electron transport rate vs irradiance relationship (αETR, µmol e m-2 s-1 [µmol photon m-2 s-1]-1), and (c) subsaturation coefficient (Ek, µmol photon m-2 s-1) for Cymodocea nodosa incubated at different nitrate levels. Data points indicate the average of six samples ± standard deviation. Error bars not shown are smaller than symbol size.
GPS and ETR followed a linear relationship only in tissue incubated at 50 and 100 µM NO3- (Fig. 5). The GPS-ETR relationship deviated from the linear relationship in shoots with 0-25 µM NO3- in the medium, especially at high irradiances. In general, values showed little deviation from a linear model at irradiances below 100 µmol photon m-2 s-1 and deviation increased when tissues were incubated at irradiances above 300 µmol photon m-2 s-1. Deviation of the data from the linear model at high irradiances decreased as nitrate concentration increased in the treatments.
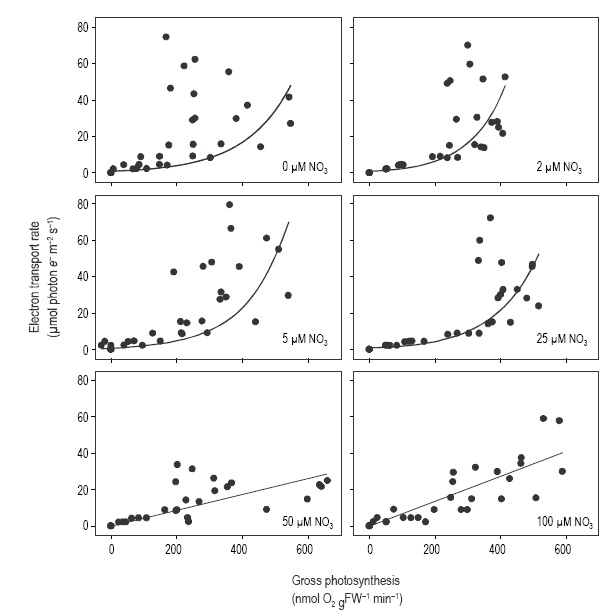
Figure 5 Relationship between electron transport rate (ETR) and oxygenic gross photosynthesis in Cymodocea nodosa incubated at different nitrate levels.
Respiration rates increased from approximately 44 ± 31 µmol O2 gFW-1 s-1 in shoots incubated at 0 µM NO3- to saturation values of 129 ± 34 µmol O2 gFW-1 s-1 in tissue incubated at 25-50 µM NO3- (Fig. 6a, P < 0.05). There was a three-fold increase in respiration rates as nitrate concentration augmented from 0 to 25-100 µM The GPS/R ratio decreased (P < 0.05) from 7.3 ± 1.4 in shoots incubated at 0 µM NO3 to 3.1 ± 0.8 in shoots incubated at 50-100 µM NO3 (Fig. 6b). The rapid decline in the GPS/R ratio was promoted by the rapid increase in respiration rate as nitrogen augmented in the medium, relative to the increase in GPS.

Discussion
In this study we demonstrate that chlorophyll concentration, absorptance, C/N ratios, optimum quantum yield, and GPS/R ratios in C. nodosa tissue are regulated by nitrate availability in the culture medium. Secondly, we demonstrate that the GPS-ETR relationship also depends on the nitrogen concentration in the tissue of C. nodosa . Similar findings have been reported for marine macroalgae such as Ulva rigida (Cabello-Pasini and Figueroa 2005), where nitrate concentration in the medium regulated oxygenic and fluorimetric photosynthesis as well as the GPS-ETR relationship.
The levels of external and internal nitrogen contents appear to play a critical role in tissue chlorophyll levels and absorptance of C. nodosa . Previous studies have demonstrated that chlorophyll levels in tissues of marine macrophytes can change within hours or days after a change in the nitrate concentration in the medium (Young and Beardall 2003, Cabello-Pasiniet al. 2004, Cabello-Pasini and Figueroa 2005). These changes in chlorophyll levels are consistent with the observed increase in chlorophyll content in phytoplankton as a result of increasing levels of nitrogen in the medium (Young and Beardall 2003). Furthermore, changes in absorptance levels in the tissue of C. nodosa are likely the result of changes in chlorophyll levels as observed in other macrophyte species (Cabello-Pasini and Figueroa 2005).
In marine macrophytes, the ETR-GPS relationship has been shown to be species-specific and dependent on light history, CO2 levels in the water, and the methods used to evaluate oxygen evolution and chlorophyll fluorescence (Beer and Bjork 2000, Franklin and Badger 2001, Gordillo et al. 2001, Carr and Bjork 2003, Figueroa et al. 2003, Beer and Axelsson 2004). Furthermore, the slope of the ETR-GPS relationship was observed to decrease in U. rigida as the nitrate concentration increased in the medium (Cabello- Pasini and Figueroa 2005). While Carr et al. (2003) observed that the relationship between ETR and GPS did not show a linear response in Ulva, findings by Cabello-Pasini and Figueroa (2005) show a linear relationship for the same genus. Our study suggests that the ETR-GPS relationship in C. nodosa deviates from a linear relationship only in tissue incubated at nitrogen levels below 25 µM. This suggests that at least in some plants, nitrogen concentration in tissues regulates the coupling of oxygen evolution and photon flux. It is also likely that an annual fluctuation of the ETR-GPS relationship will occur as a result of seasonal changes of nitrogen in the seawater or as a result of nutrient pulses such as those observed under upwelling conditions.
It has been demonstrated that under continuous light conditions, there is a general decrease in maximum ETR, which has been associated with an increase in the minimum requirements for O2 evolution (Herzig and Falkowski 1989). Furthermore, nitrogen limitation has been shown to regulate the photochemical efficiency of PSII during photochemical reactions, mainly due to an increase in thermal dissipation of absorbed excitation energy (Falkowski 1992). Such impact of nitrogen on the photochemical efficiency of PSII is similar to the photoinhibitory response observed in submerged aquatic vegetation. On the other hand, nitrogen limitation has also been observed to decrease respiratory rates, which in turn increase GPS/R ratios (Carr and Bjork 2003, Cabello-Pasini and Figueroa 2005). Respiration rates of C. nodosa decreased significantly as nitrogen levels in the medium decreased below 10 µ.M. This is consistent with previous findings where the addition of NO3 and NH4+, for example, resulted in a marked stimulation of dark respiration and dark carbon fixation in the microalga Selenastrumminutum (Elrifi and Turpin 1986). Apparently, decreases in protein synthesis (a major consequence of nitrogen limitation) reduce the demands for carbon skeletons and ATP in the respiratory pathway (Turpin 1991).
The ETR response in C. nodosa was found to be four- to ten-fold more variable than that observed in Ulva lactuca under low nitrate concentration (Carr and Bjork 2003, Cabello-Pasini and Figueroa 2005). Clearly, the dispersion of data of the ETR-GPS relationship increases as nitrogen in the medium and in tissue decreases. It is possible that the lower levels of chlorophyll in tissues incubated at low nitrate concentration could cause variability of the data. Absorptance also decreases and becomes more variable at low nitrate levels, suggesting that the absorbed light was not efficiently used for photochemistry. For example, photochemical efficiency decreases as a result of a lower number of functional PSII centers relative to antennae or because of an increase in the absorption cross-section of PSII, both which impact energy transfer between PSII reaction centers (Falkowski 1992).
The GPS-ETR relationship can vary in response to different nutrient sinks. In addition to carbon assimilation, other sinks, such as nitrogen assimilation, have been shown to regulate these ratios (Figueroa et al. 2003). The slopes of GPS vs ETR or ФPSII vs ФO2, for example, were lower in Ulva rotundata and Phorphyraleucosticta with the highest nitrogen assimilation capacity, estimated as nitrate reductase activity and internal nitrogen contents, relative to that observed in Ulva olivascens (Figueroa et al. 2003). As mentioned above, the basic assimilatory pathway for inorganic nitrogen is closely dependent on organic carbon and, hence, nitrogen limitation finally increases allocation of organic carbon to lipids and carbohydrates (Falkowski and Raven 1997). Babinet al. (1996) found maximum quantum yield of carbon fixation to roughly covary with the nitrate concentration in phytoplankton samples. In contrast, under nitrogen-enriched conditions (as in our study), the sudden nitrogen assimilation could inhibit RUBISCO activity and, consequently, electrons might be used for nitrate assimilation and the respiratory carbon flow would increase to provide carbon skeletons (Turpin 1991).
Overall, the C/N ratios observed in C. nodosa fall within the range described for marine macrophytes (Atkinson and Smith 1983). In marine macrophytes, most of the organic carbon and nitrogen is found in structural components, which suggests that dark respiration is strongly related to biomass formation. Thus, it is possible that the decrease in the C/N ratio with increasing nitrate levels in the medium might be the result of a transient suppression of photosynthetic carbon fixation due to a competition between the Calvin cycle and nitrogen assimilation. Whether other processes such as nitrogen storage (N pools) and remobilization are active in Cymodocea is unclear and require further investigation.
This study demonstrates that the relationship between GPS and ETR is dependent on the nitrogen status in the tissue of C. nodosa. Nitrate availability also affected a number of parameters such as carbon, nitrogen, and chlorophyll content in the tissue as well as the absorptance of the tissue. Consequently, it is possible that the sample-to-sample variation within and among studies may be the result of the differences in tissue nitrogen levels. This study also suggests that the relationship between GPS and ETR in natural seagrass populations may vary as a result of natural fluctuations in nutrient loads (i.e., upwelling events).

