


Serviços Personalizados
Journal
Artigo
 Inglês (pdf)
 Artigo em XML
 Referências do artigo
 Enviar este artigo por email
Indicadores
-
 Citado por SciELO
 -
 Acessos
Links relacionados
-
 Similares em
SciELO
Similares em
SciELO
Compartilhar

 Permalink
Ciencias marinas
versão impressa ISSN 0185-3880
Cienc. mar vol.31 no.4 Ensenada Dez. 2005
Artículos
On the variation of alkalinity during phytoplankton photosynthesis
Variación de la alcalinidad durante la fotosíntesis del fitoplancton marino
F. Fraga and X.A. Álvarez-Salgado*
CSIC, Instituto de Investigaciones Marinas Eduardo Cabello 6 36208 Vigo, Spain. * E-mail: xsalgado@iim.csic.es
Recibido en noviembre de 2004;
aceptado en mayo de 2005.
Abstract
The alkalinity of the organic constituents of marine phytoplankton and their participation in the total alkalinity (TA) change of seawater during photosynthesis are carefully assessed. Quantification of the contribution of phytoplankton chlorophyll, proteins and phosphorus compounds to the hydrogen ion balance of seawater in terms of total inorganic nitrogen (Δ[NT] = Δ[NH4+] + Δ[N2] + Δ[NO2-] + Δ[NO3-]) and total inorganic phosphorus (Δ[PT]) changes during photosynthesis yielded that the organic components of marine phytoplankton are alkaline by -0.06 x Δ[NT] - 0.49 x Δ[PT], and that the potential total alkalinity (TAP) during photosynthesis is TAP = TA - [NH4-] + 0.93 x [NO2-] + [NO3-] + 0.08 x [NT] + 0.23 x [PT] for unfiltered seawater samples and TAP = TA - [NH4-] + 0.93 x [NO2-] + [NO3-] + 0.02 x [NT] + 0.26 x [PT] for filtered seawater samples. These equations correct the traditionally used expression TAP = TA + [NO3-]. The TAP anomalies are produced, in order of increasing importance, by N2 fixation, DMSP production and CaCO3 fixation.
Key words: total alkalinity, carbon cycling, phytoplankton, primary production, mineralization.
Resumen
En este artículo se estima la alcalinidad de los compuestos orgánicos producidos por el fitoplancton marino y su contribución al cambio de alcalinidad total (TA) del agua de mar durante la fotosíntesis. Tras cuantificar la contribución de los pigmentos fotosintéticos, las proteínas y los compuestos de fósforo al balance de H+ del agua de mar referida a las variaciones de nitrógeno inorgánico (Δ[NT] = Δ[NH4+] + Δ[N2] + Δ[NO2-] + Δ[NO3-]) y fósforo inorgánico (Δ[PT]) totales durante la fotosíntesis, se obtiene que los constituyentes orgánicos del fitoplancton marino tienen una alcalinidad de -0.06 x Δ[NT] - 0.49 x Δ[PT], y que la alcalinidad potencial (TAP) durante la fotosíntesis es TAP = TA - [NH4-] + 0.93 x [NO2-] + [NO3-] + 0.08 x [NT] + 0.23 x [PT] para muestras no filtradas y TAP = TA - [NH4-] + 0.93 x [NO2-] + [NO3-] + 0.02 x [NT] + 0.26 x [PT] para muestras filtradas. Estas expresiones corrigen la ecuación tradicional de TAP = TA + [NO3-]. Procesos tales como la fijación de N2, la producción de DMSP y, sobre todo, la síntesis de CaCO3, producen desviaciones crecientes en el comportamiento conservativo de la TAP.
Palabras clave: alcalinidad total, ciclo del carbono, fitoplancton, producción primaria, mineralización.
Introduction
The theoretical definition of the total alkalinity (TA) of any natural sample is given by the well-known expression (Dickson, 1981; Millero, 1995):

The determination of TA requires titration with hydrochloric acid. According to the theoretical definition of Eq. (1), the endpoint of the TA titration should be the pH at which:

In the pH seawater scale (pHSWS), the [OH-] term includes the concentration of Mg(OH)+ and the [H+] term includes those of HSO42- and HF (Millero, 1995). Aside from the major HCO3-, CO32- and B(OH)4- species, a seawater sample has significant concentrations of other bases that can accept hydrogen ions during the TA determination. This paper will focus on the bases that play a part in the synthesis of the organic (carbohydrates, lipids, proteins, photosynthesis pigments, phosphorus compounds, DMSP) and inorganic (CaCO3, (Si2O5H2)n) products of marine phytoplankton photosynthesis. In this sense, although the inorganic carbon, phosphorus and silicon species have been traditionally considered in TA studies (Brewer et al., 1975; Dickson, 1981; Johansson and Wedborg, 1982; Millero, 1995), the contribution of the products of phytoplankton photosynthesis has still not been comprehensively examined.
Since the endpoint of the TA determination depends upon a group of poorly defined bases, the theoretical definition of TA is not operational, because the composition of bases in the sample should be known to either calculate the endpoint of the TA titration before the measurement is performed or to correct it after the determination. In addition, a strict application of the theoretical definition of TA would imply that the endpoint of the TA determination would be different for each sample. To overcome this issue, Dickson (1981) gave his own operational definition of TA: "The total (or titration) alkalinity of a natural water sample can be regarded as a measure of the proton deficit of the solution relative to an arbitrarily defined zero level of protons". Since the carbonic and boric acid systems are the main contributors to the TA of a natural sample, Dickson (1981) reasonably established that the operational endpoint of the TA titration should be the pH at which:

This equation can be simplified to:

This endpoint is at a pH ~4.4. Hence, Dickson (1981) arbitrarily defined that any acid with a pKA < 4.5 is a proton donor; consequently, it does not accept protons during the TA determination. Based on Dickson's (1981) definition, Millero (1995) provides the following operational definition of alkalinity: "The total (or titration) alkalinity (TA) of a natural water sample is arbitrarily (or operationally) defined as the concentration (in eq kg-1) of all bases able to accept a hydrogen ion at the equivalence point of the carbonic acid system species". In this work we have strictly applied this definition, without considering the arbitrarily established zero level of protons imposed by Dickson (1981). For a standard seawater sample of salinity 35.0 and temperature 25°C, the equivalence point of a TA determination occurs at a pHSWS of ~4.25 (hydrogen ion activity, aH = ~10-4.4).
Results and discussion
Total alkalinity changes during the synthesis of the organic components of marine phytoplankton
The stoichiometric equation for the photosynthesis of the major organic components of marine phytoplankton, with an average composition of C106H264O110N16P, was first established by Richards (1965), based on the classical work by Redfield etal. (1963). Subsequently, Anderson (1995) and Fraga et al. (1998) proposed new formulas, C106H175O42N16P and C106H171O42N16P respectively, which basically correct the overestimated H and O proportions of the original formula. The new formulas are more consistent with the biochemical composition of marine phytoplankton and with the variations of dissolved oxygen (O2) and inorganic carbon (CT), nitrogen (NT) and phosphorus (PT) observed in the water column during photosynthesis/mineralization processes in the oceans. The revised stoichiometric equation is (Fraga et al., 1998):

The inorganic carbon, nitrogen and phosphorus species in Eq. (5) have been written in their most abundant forms at the pHSWS of a standard seawater sample. Considering the acidity constants of carbonic and phosphoric acids in seawater of salinity 35.0 and temperature 25°C (table 1), HCO3- represents 84-94% of CT and HPO42- represents 77-91% of PT depending on the pHSWS, which ranges from 8.2 (aH = 10-84) to 7.6 (aH = 10-7.8), respectively. Regarding the NT species, phytoplankton is able to use NH4+, N2, NO3- and NO2- as inorganic nitrogen sources (Wada and Hattori 1991). Only NO3- will be considered in this section.
Although Eq. (5) can be used for common mass balance purposes, it is not suitable to study the TA change of seawater during the photosynthesis of marine phytoplankton (ΔTA). The accurate quantification of ΔTA requires consideration of the contribution of the other CT and PT species able to accept a hydrogen ion during the TA determination. In this case, ΔTA could be more easily calculated considering the complementary balance of strong cations minus strong anions. In the context of the operational definition of TA, a strong cation is any cation that is not able to donate a hydrogen ion at the equivalence point of the carbonic acid system species (e.g., Na+ and NH4+). Accordingly, a strong anion is any anion that is not able to accept a hydrogen ion in the same conditions (e.g., Cl- and NO3-). Based on this definition, Brewer et al. (1975) established that TA increases (decreases) 1 eq per mol of NO3- and PT consumed (produced) during the synthesis (early degradation) of the organic tissues of marine phy-toplankton, i.e. ΔTA/(ΔPT + NO3-) = -1, and defined the conservative chemical parameter "potential alkalinity" (TAP) as the sum of TA + [NO3-] + [PT]. Note that considering the pK'As of the phosphoric acid system, PT is not able to accept 1.016 eq of H+ per mol of P at pHSWS 4.25 (see the balance of charges ε4.25 in table 1). Culture experiments conducted by Brewer and Goldman (1976) and revisited by Goldman and Brewer (1980) confirmed the experimental validity of TAP. On the basis of those experiments, Broecker and Peng (1982) presented the following simplified version of Brewer et al.'s (1975) equation: ΔTA/ΔNO3- = -1, which frequently appears in the literature. In any case, these relationships between TA and NO3- or TA, NO3- and PT assume that the organic constituents of marine phytoplankton are neutral; that is, they do not play any part in the hydrogen ion balance of seawater. But, how accurate is this assumption?
Fraga and Pérez (1990) and Laws (1991) have reviewed in great detail the average composition of the phytoplankton carbohydrates, lipids, proteins, photosynthetic pigments and phosphorus compounds. Table 2 summarizes the average composition of these groups of biomolecules and shows the relative contribution of each group to the average composition of marine phytoplankton presented in Eq. (5). The assumption that the different groups of biomolecules are neutral is truthful for the carbohydrates, lipids and photosynthetic pigments. The alcohol (R-OH), aldehyde (R-HCO) and keton (R-CO-R') groups of the carbohydrates and the ester groups of the lipids (R-CO-O-R') are not alkaline and do not alter the alkalinity of seawater during photosynthesis. In regard to the photosynthetic pigments (chlorophylls a, b, c1 and c2), although the porphyrin of the chlorophylls does not contribute to the hydrogen ion balance, it alters the TA of seawater during photosynthesis:

that is, 0.500 eq of H+ per mol of chlorophyll N (Nchl), as is inferred from the balance of strong cations minus strong anions derived from the stoichiometric equation of phytoplankton chlorophyll photosynthesis:

Regarding the proteins, the amide groups (R-CO-NH-R') of the peptide bonds do not participate in the hydrogen ion balance of seawater. The amine groups (R-NH2) of the terminal amino acids should have to be considered, but their proportion is so low (an average protein consists of >25 amino acids) that they do not noticeably affect the hydrogen ion balance of seawater. In addition, the contribution of the side-chain functional groups of the basic (lysine, arginine and histidine) and acid (aspartic and glutamic) amino acids should also be taken into account. Considering the acid constants of the side-chain amine group of lysine (pK'A = 10.53), the guanidine group of arginine (pK'A = 12.48), the imidazole group of histidine (pK'A = 6.0) and the carboxylic acid groups of aspartic (pK'A = 3.86) and glutamic (pK'A= 4.25) acids, they are able to accept 0.000 eq of H+ per mol (eq mol-1) of lysine and arginine, 0.969 eq mol-1 of histidine, 0.224 eq mol-1 of aspartic acid and 0.414 eq mol-1 of glutamic acid during the alkalinity titration from a standard pHSWS of 8.0 (aH = 10-8 2) to the equivalence point pHSWS of 4.25. These numbers have been obtained by subtracting the balance of charges at pHSWS 4.25 (ε4.25) from the balance of charges at pHSWS 8.0 (ε8.0; table 1). In addition, lysine, arginine and histidine are not able to donate 1.000, 1.000 and 0.976 eq of H+ per mol at the equivalence point pHSWS of 4.25 (ε4.25). On the contrary, aspartic and glutamic acids are not able to accept 0.776 and 0.586 eq of H+ per mol in the same conditions. Lysine, arginine and histidine represent 7.8%, 14.5% and 7.9% of the total N content of phy-toplankton proteins (Fraga and Pérez, 1990), with the average composition presented in table 2. Part of the carboxylic acid groups of aspartic and glutamic acids are really in the form of neutral amide groups in proteins, such as asparagine and glutamine, respectively. Therefore, although aspartic and glutamic acids represent 7.0% and 8.9% of the total N content of phytoplankton proteins, only 4.5% and 5.7% are in the carboxylic acid form, respectively (Fraga and Pérez, 1990). Considering these proportions and the corresponding balances of charges in table 1, the total charges of phytoplankton proteins are +0.033 eq per mol of protein N (Nprot) at pHSWS 4.25 and -0.027 eq per mol of Nprot at pHSWS 8.0. Consequently, phytoplankton proteins are alkaline by 0.059 eq of H+ per mol of Nprot (table 2). They also alter the TA of seawater during photosynthesis:

that is, 1.084 eq of H+ per mol of Nprot, as indicated by the balance of strong cations minus strong anions derived from the stoichiometric equation of phytoplankton protein photosynthesis:

The phosphorus compounds are constituted by RNA, DNA, nucleotides, phospholipids, phosphoproteins, phosphosugars, phosphate and polyphosphates, which represent 30.0%, 9.5%, 2.6%, 7.4%, 4.8%, 4.1%, 38.5% and 3.1% of P, respectively (Miyata and Hattori, 1986). Phosphorus in RNA, DNA, phos-pholipids and phosphoproteins is in the form of phosphate diester (R-O-HPO2-O-R'). It does not accept a hydrogen ion during the alkalinity titration from a standard pHSWS of 8.0 to the equivalence point pHSWS of 4.25 (ε8.0-ε4.25 = -0.002; table 1), and it is not able to accept 0.998 eq of H+ per mol of P at pHSWS 4.25 (ε4.25 = -0.998; table 1). These numbers are also applicable to the phosphate diesters of the nucleotids (essentially ATP) and the polyphosphates. Phosphorus in the phosphosugars (H2PO3-O-R) is able to accept 0.976 eq of H+ per mol of P during the TA determination and it is not able to accept 1.016 eq of H+ per mol of P at pHSWS 4.25. Again, these numbers are also applicable to the terminal phosphorus of the nucleotids and polyphosphates, although the contribution of the latter can be negligible.
Aside from the phosphate esters, the possible contribution of the nucleosides of the purine (adenosine and guanosine) and pyrimidine (uridine, cytidine and thymidine) bases of the nucleotids and nucleic acids should be considered. Thus, during the TA determination, 1 mol of adenosine is able to accept 0.074 eq of H+; 1 mol of guanosine, 0.100 eq; 1 mol of uridine, 0.091 eq; 1 mol of cytidine, 0.613 eq; and 1 mol of thymidine, 0.025 eq (see ε8.0 - ε4.25 in table 1). While ε4.25 is nil for uridine and thymidine, it is +1.074 eq of H+ per mol (eq mol-1) for adenosine, +1.002 eq mol-1 for guanosine and +0.613 eq mol-1 for cytidine. Therefore, the possible pairs adenosine/thymidine, adenosine/uridine and guanosine/cytidine would contribute with 0.049, 0.082 and 0.357 eq mol-1 of P to the TA determination. Assuming that the adenosine/thymidine and guanosine/ cytidine pairs occur in the same proportions in RNA, they would be able to accept 0.203 eq mol-1 of P. Accordingly, the bases of RNA are not able to donate 0.672 eq mol-1 of P at pHSWS 4.25. In the case of DNA, if the adenosine/uridine and guanosine/cytidine pairs occur in the same proportions, they would be able to accept 0.219 eq mol-1 of P during the TA determination and are not able to donate 0.672 eq mol-1 of P at pHsws 4.25. Considering the phosphate diester and the purine and pyrimidine bases, the nucleic acids as a whole can accept 0.205 (RNA) and 0.222 (DNA) eq mol-1 of P during the TA determination and they are not able to accept 0.326 eq mol-1 of P at pHSWS 4.25. Accordingly, taking into account the adenosine, the phosphate diesters and the terminal phosphate ester of the ATP, the nucleotids accept 0.351 eq mol-1 of P during the TA determination, but they are not able to accept 0.646 eq mol-1 of P at pHSWS 4.25.
It is also necessary to consider the contribution of the N bases of the phosphoproteins. In this sense, 78.3% of the phos-phoprotein N is in the form of a protein and the remaining 21.7% is in the form of RNA (Fraga and Pérez, 1990). Therefore, considering the phosphate diester and the N bases, the phosphoproteins overall accept 0.992 eq of H+ per mol of P during the TA determination and they are not able to donate 0.112 eq of H+ per mol of P at pHSWS 4.25. Finally, it is also necessary to account for the contribution of the side-chain basic functional groups of the phospholipids (ethanolamine, coline, etc.). Assuming that it is essentially ethanolamine, this basic group can accept 0.180 eq of H+ per mol of P during the TA determination and it is not able to donate 1.000 eq of H+ per mol of P at pHsws 4.25. Consequently, considering the phosphate diester and the ethanolamine, the phospholipids in sum accept 0.182 eq of H+ per mol of P during the TA determination and they are not able to donate 0.002 eq of H+ per mol of P at pHSWS 4.25.
Considering all these numbers together, the total charge of phytoplankton phosphorus compounds is -0.604 eq per mol of P at pHSWS 4.25 and -1.233 eq per mol of P at pHSWS 8.0. Consequently, phosphorus compounds are alkaline by 0.629 eq of H+ per mol of phytoplankton P (Pphy) (table 2) and they are able to alter the TA of seawater during photosynthesis:

that is, 2.812 eq of H+ per mol of Pphy, as inferred from the balance of strong cations minus strong anions derived from the stoichiometric equation of synthesis of phytoplankton phosphorus compounds:

Finally, the ΔTA during the synthesis of marine phy-toplankton pigments, proteins and phosphorus compounds will be:

According to the relative contribution of chlorophylls, proteins and phosphorus compounds to the average composition of marine phytoplankton (table 2), ΔTA = -17.427 eq of H+ per mol of PT or -1.090 eq of H+ per mol of NO3-. In addition, phytoplankton proteins and phosphorus compounds are alkaline by 0.059 x Δ[Nprot] + 0.629 x Δ[Pphy] = 1.424 eq of H+ per mol of Pphy. Consequently, the traditionally neglected alkalinity of these organic constituents of marine phytoplank-ton (1.424 eq of H+ per mol of P; table 2) is as important as the regularly accounted alkalinity of PT (1.133 eq of H+ per mol ofP; table 1).
Eq. (12) can be expressed in terms of NO3- and PT, the chemical variables usually measured in hydrographic studies, as follows:

Considering that Δ[NO3-] = -Δ[Nchl] -Δ[Nprot] -Δ[Pphy] x 12/5 and that Δ[Nchl]/Δ[Nprot] = 1.61 x 10⁻² is the constant ratio usually found in marine phytoplankton (Fraga and Pérez, 1990), the alkalinity of phytoplankton proteins and phosphorus compounds in terms of NO3- and PT changes is -0.60 x Δ[NO3-] - 0.49 x Δ[PT].
Total alkalinity changes due to ammonium, nitrite and molecular nitrogen utilization
Aside from NO3-, phytoplankton can use NH4+, NO2- and N2 as nitrogen sources during photosynthesis, affecting ΔTA in different ways. In the case that the nitrogen source is NH4+, then Eq. (13) should be corrected considering that a strong anion (NO3-) is substituted by a strong cation (NH4+) in Eqs. (6), (8) and (10), producing a ΔTA change of -2.000 eq of H+ per mol of NO3- substituted by NH4+ (Goldman and Brewer, 1980). Therefore:

Concerning NO2-, there is great disagreement in the literature about the pK'A value of the nitrous acid, which ranges from ~2.80 (Santaballa, 1985) to 4.36 (Spencer, 1975), so e425 could range from -0.975 to -0.532, respectively. Therefore, the substitution of NO3- by NO2- could produce a ΔTA of only -0.025 to as much as -0.477 eq of H+ per mol of NO3-substituted by NO2-. The experimental work conducted by Goldman and Brewer (1980) in seawater of salinity 32 and temperature 19°C supports the behaviour of HNO2 as a strong acid (pK'A = 3.25). For the purpose of this work, we will assume the latter value as the pK'A of HNO2. Consequently, e425 is -0.934 and the substitution of NO3- by NO2- produces a ΔTA of -0.066 eq of H+ per mol of NO3- substituted by NO2-. In any case, a rigorous assessment of this pK'A in natural seawater is necessary.

Finally, in the case that N2 is the nitrogen source, then Eq. (13) should be corrected considering that a strong anion (NO3-) is substituted by a neutral form (N2), producing a ΔTA change of -1.000 eq of H+ per mol of NO3- substituted by N2:

Therefore, combining Eqs. (13), (14), (15) and (16) the TA change due to the synthesis of phytoplankton pigments, proteins and phosphorus compounds should be:

or:

where 
Total alkalinity changes during the synthesis of dimethylsulfoniumpropionate (DMSP)
Certain groups of phytoplankton, mainly Dinophyceae and Prymnesiophyceae, are able to produce and release large amounts of DMSP, (CH3)2S+ (CH2)2COO-, a major form of reduced sulfur in marine particulate matter (Simó et al., 2000). It may constitute up to 10-20% of cellular organic carbon (Matrai and Keller, 1994), becoming a major organic constituent in phytoplankton known to produce large amounts of DMSP.
Although the sulfonium group of DMSP does not participate in the hydrogen ion balance of seawater, the carboxylic acid group (pK'A = 4.87) should be considered. It does accept 0.806 eq of H+ per mol of S (SDMSP) during the alkalinity titration from a standard pHSWS of 8.0 to the equivalence point pHSWS of 4.25 (ε8.0 -ε4.25 = -0.806; table 1) and it is not able to accept 0.193 eq of H+ per mol of SDMSP at pHSWS 4.25 (ε4.25 = -0.193; table 1). In addition, DMSP is able to alter the TA of seawater during the photosynthesis of phytoplankton:

that is, 2.807 eq of H+ per mol of SDMSP, as indicated by the balance of strong cations minus strong anions derived from the stoichiometric equation of phytoplankton DMSP photosynthesis:

Therefore, for the case of phytoplankton that produces DMSP and uses NO3- as nitrogen source, Eq. (9) should be corrected to:

In addition, the organic constituents of marine phytoplank-ton that produce DMSP are alkaline by 0.059 x Δ[Nprot] + 0.629 x Δ[Pphy] + 0.806 x Δ[SDMSP].
Since intracellular DMSP concentration varies widely among species, it is unlikely to give an average ΔTA change during the photosynthesis of phytoplankton able to produce DMSP. Therefore, we have considered the cases that 5%, 10% and 20% of cellular organic carbon are DMSP, representing 1.12, 2.36 and 5.30 mol of SDMSP per mol of cellular carbon, respectively. So, ΔTA would be -20.571, -24.052 and -32.304 eq of H+ for 5%, 10% and 20% of cellular organic carbon as DMSP, which can be compared with the value of -17.427 eq of H+ that we obtained for phytoplankton that does not produce DMSP. The corresponding alkalinity of the organic constituents of this phytoplankton would be 2.327, 3.326 and 5.696 eq of H+ per mol of PT, comparable to the value of 1.424 eq of H+ obtained for phytoplankton that does not produce DMSP. Therefore, the synthesis of DMSP has a dramatic impact on the TA change of seawater during photosynthesis.
Total alkalinity changes during the synthesis of the inorganic components of marine phytoplankton
The TA calculations presented in the previous sections are incomplete when coccolithophores or diatoms play a part in photosynthesis. In these cases, the synthesis of calcareous (Eq. 22) and siliceous (Eq. 23) structures should also be considered:
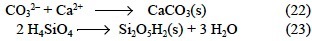
As noted by Broecker and Peng (1982), the synthesis of calcareous structures severely affects the ΔTA of the water column: ΔTA is as much as -2.000 eq of H+ per mol of CaCO3 (Eq. 22). Accordingly, the synthesized CaCO3(s) is alkaline by 2.000 eq of H+ per mol of C and would accept hydrogen ions during the TA determination because the coccoliths collected in the sample dissolve completely at pHSWS < 5.5 in less than 30 s (Balch et al., 1996). Therefore, in order to determine the ΔTA provoked by the synthesis of CaCO3(s) in the water column, it is mandatory to filter the sample before the TA titration (Robertson et al., 1994). Of course, the filter will also retain the alkaline organic tissues of marine coccolithophores, which are species that produce large amounts of DMSP (Matrai and Keller, 1994). Considering that DMSP represents 10% of cellular organic carbon of marine coccolithophores, then the ΔTA provoked by the organic constituents of this phytoplank-ton in a sample filtered before the TA determination would not be -24.049, but -20.723 eq of H+. Therefore, for coccolitho-phores with an average Corg:CaCO3 molar ratio of 1:1 (Buitenhuis et al., 1999) and 10% of cellular organic carbon as DMSP, ΔTA = -0.113 eq of H+ per mol of CT for an unfiltered seawater sample and ΔTA = +0.902 eq of H+ per mol of CT for a filtered seawater sample.
Finally, the synthesis of diatom frustules slightly affects the hydrogen ion balance of seawater, because the pK'A of the silicic acid at salinity 35 and temperature 25°C is 9.54 (table 1). Accordingly, e80 = -0.045 and e425 = 0.000 eq per mol of Si. Contrary to the case of the synthesis of calcareous structures, the opal of the diatom frustules (Si2O5H2) does not dissolve under the acid conditions of a TA determination. Consequently, filtration of the sample is not necessary to observe the ΔTA provoked by synthesis of Si2O5H2(s) in the water column.
Concluding remarks
The contribution of the organic components of marine phy-toplankton to the hydrogen ion balance of seawater has been carefully assessed for the first time. Inclusion of chlorophyll, proteins and phosphorus compounds in the balance of strong cations minus strong anions during photosynthesis of marine phytoplankton of average composition C106H171O42N16PS03 using NH4+, NO2- or NO3- as nitrogen source, produces the following revised expression for TAP of seawater:

The alkaline nature of the phytoplankton calcareous structures requires filtration of the sample before the TA determination in order to assess the TA changes in the water column during the photosynthesis of coccolithophores. In any case, even when coccolithophores do not contribute to photosynthesis, since phytoplankton proteins and phosphorus compounds are alkaline, the TA change of seawater would be overestimated if the sample were not filtered. In this sense, the most correct expression for the potential alkalinity of filtered seawater would be:

Since N2 is not a universal nitrogen source, and DMSP and CaCO3 are not universal products of phytoplankton photosynthesis, they are determined only in process orientated studies. For this reason, we have not included them in the revised definition of TAP. Consequently, TAP anomalies should be observed during N2 and CaCO3 fixation and DMSP production. Whereas N2 fixation has a limited effect on the TA change of seawater, only -0.08xΔ[N2] for unfiltered samples and -0.02 x Δ[N2] for filtered samples, the synthesis of DMSP and, in particular, CaCO3 produces more substantial changes. In this sense, TAP anomalies have been traditionally used to estimate CaCO3 synthesis (ΔCaCO3 = ΔCT - 0.5 x ΔTAP). Calculation of TAP with eq. (25) would underestimate CaCO3 synthesis during a coccolithophore bloom with a Corg:CaCO3 ratio of 1:1 only by 1.1%, 2.2% and 5.0% for 5%, 10% and 20% of cellular organic carbon as DMSP, respectively.
Acknowledgements
This study received financial support from the Spanish Comisión Interministerial de Ciencia y Tecnología (CICYT), through grants MAR99-1039-C02-01 and REN2000-0880-C02-01.
References
Anderson, L.A. (1995). On the hydrogen and oxygen content of marine phytoplankton. Deep-Sea Res., Part I, 42: 1675-1680. [ Links ]
Balch, W.M., Fritz, J. and Fernández, E. (1996). Decoupling of calcification and photosynthesis in the coccolithophore Emiliania huxleyi under steady-state light-limited growth. Mar. Ecol. Prog. Ser., 142: 87-97. [ Links ]
Brewer, P.G. and Goldman, J.C. (1976). Alkalinity changes generated by phytoplankton growth. Limnol. Oceanogr., 21: 108-117. [ Links ]
Brewer, P.G., Wong, G.T.F., Bacon, M.P. and Spencer, D.W. (1975). An ocean calcium problem. Earth Planet. Sci. Lett., 26: 81-87. [ Links ]
Broecker, W.S. and Peng, T.H. (1982). Tracers in the Sea. Eldigio Press. [ Links ]
Buitenhuis, E.T., Baar, J.W. de and Veldhuis, J.W. (1999). Photosynthesis and calcification by Emiliania huxleyi (Prymnesiophyceae) as a function of inorganic carbon species. J. Phycol., 35: 949-959. [ Links ]
Dawson, R.M.C., Elliot, D.C., Elliot, W.H. and Jones, K.M. (1986). Data for Biochemical Research. 3rd ed. Clarendon Press. [ Links ]
Dickson, A.G. (1981). An exact definition of total alkalinity and a procedure for the estimation of alkalinity and total inorganic carbon from titration data. Deep-Sea Res., 28: 609-623. [ Links ]
Fraga, F. y Pérez, F.F. (1990). Transformaciones entre composición química del fitoplancton, composición elemental y relación de Redfield. Sci. Mar., 54: 69-76. [ Links ]
Fraga, F., Ríos, A.F., Pérez, F.F. and Figueiras, F.G. (1998). Theoretical limits of oxygen:carbon and oxygen:nitrogen ratios during photosynthesis and mineralisation of organic matter in the sea. Sci. Mar., 62: 161-168. [ Links ]
Goldman, J.C. and Brewer, P.G. (1980). Effect of nitrogen source and growth rate on phytoplankton-mediated changes in alkalinity. Limnol. Oceanogr., 25: 352-357. [ Links ]
Johansson, O. and Wedborg, M. (1982). On the evaluation of potentiometric titrations of seawater with hydrochloric acid. Oceanol. Acta, 5: 209-218. [ Links ]
Laws, E.A. (1991). Photosynthetic quotients, new production and net community production in the open ocean. Deep-Sea Res., 38: 143-167. [ Links ]
Matrai, P.A. and Keller, M.D. (1994). Total organic sulfur and dimethylsulfoniopropionate in marine phytoplankton: intra-cellular variations. Mar. Biol., 119: 61-68. [ Links ]
Millero, F.J. (1995). Thermodynamics of the carbon dioxide system in the oceans. Geochim. Cosmochim. Acta, 59: 661-677. [ Links ]
Miyata, K. and Hattori, A. (1986). A simple fractionation method for determination of phosphorus components in phytoplankton: application to natural population of phytoplankton in summer surface waters of Tokyo Bay. J. Oceanol. Soc. Japan, 42: 255-265. [ Links ]
Redfield, A.C., Ketchum, B.H. and Richards, F.A. (1963). The influence of organisms on the composition of seawater. In: M.N. Hill (ed.), The Sea. Vol. 2. Interscience, pp. 26-77. [ Links ]
Richards, F.A. (1965). Anoxic basins and fjord. In: J.P. Riley and G. Skirrow G (eds.), Chemical Oceanography. Vol. 1. Academic Press, pp. 611-645. [ Links ]
Robertson, J.E., Robinson, C., Turner, D.R., Holligan, P., Watson, A.J., Boyd, P., Fernández, E. and Finch, M. (1994). The impact of a coccolithophore bloom on oceanic carbon uptake in the northeast Atlantic during summer 1991. Deep-Sea Res., Part I, 41: 297-314. [ Links ]
Santaballa, J.A. (1985). Efectos isotópicos del disolvente sobre las reacciones de nitrosación de la pireracina y el P-naftol. Ph.D. thesis, Universidad de Santiago de Compostela, 316 pp. [ Links ]
Simó, R., Pedrós-Alió, C., Malin, G. and Grimalt, J.O. (2000). Biological turnover of DMS, DMSP and DMSO in contrasting open-ocean waters. Mar. Ecol. Prog. Ser., 203: 1-11 [ Links ]
Spencer, C.P. (1975). The micronutrient elements. In: J.P. Riley and G. Skirrow (eds.), Chemical Oceanography. 2nd ed. Academic Press, New York, pp. 245-300. [ Links ]
Wada, E. and Hattori, A. (1991). Nitrogen in the Sea: Forms, Abundances and Rate Processes. CRC Press, Boca Raton, 208 pp. [ Links ]

