


Serviços Personalizados
Journal
Artigo
 Inglês (pdf)
 Artigo em XML
 Referências do artigo
 Enviar este artigo por email
Indicadores
-
 Citado por SciELO
 -
 Acessos
Links relacionados
-
 Similares em
SciELO
Similares em
SciELO
Compartilhar

 Permalink
Ciencias marinas
versão impressa ISSN 0185-3880
Cienc. mar vol.31 no.3 Ensenada Set. 2005
Artículos
Oceanographic conditions west of the Baja California coast, 2002-2003: A weak El Niño and subarctic water enhancement
Condiciones oceanográficas frente a la costa occidental de Baja California, 2002-2003: Influencia de un El Niño débil y del incremento de agua subártica
Reginaldo Durazo1*, Gilberto Gaxiola-Castro2, Bertha Lavaniegos2, Rubén Castro-Valdez1, José Gómez-Valdés2 and Affonso Da S. Mascarenhas Jr.3
1 Facultad de Ciencias Marinas 3 Instituto de Investigaciones Oceanológicas Universidad Autónoma de Baja California Apartado postal 453 Ensenada, CP 22860, Baja California, México. * E-mail: rdurazo@uabc.mx
2 Centro de Investigación Científica y de Educación Superior de Ensenada Km. 107 carretera Tijuana-Ensenada Ensenada, Baja California, México.
3 Instituto de Investigaciones Oceanológicas Universidad Autónoma de Baja California Apartado postal 453 Ensenada, CP 22860, Baja California, México.
Recibido en abril de 2004;
aceptado en abril de 2005.
Abstract
Oceanographic conditions in the Pacific waters off Baja California are described for the period 2002-2003. Anomalies in the temperature-salinity relationships were observed from October 2002 to April 2003, with a clear contribution of low salinity and low temperature subarctic water in the upper 100 m of the water column. Below 100 m, physical data suggested weak El Niño conditions. Weakened or poleward winds were not observed. The pelagic ecosystem during the intrusion of subarctic waters showed strong seasonal changes, with localized centers of high chlorophyll and zooplankton in July 2002, followed by a strong decrease in the following autumn and winter seasons. Both chlorophyll and zooplankton rebounded in April 2003, but zooplankton showed a stronger onshore-offshore gradient. There was no strong biological signal. The zooplankton taxa that showed an increase during El Niño 2002-2003 were salps and chaetognaths. The increase of salps did not appear to be related to this event, due to their seasonal occurrence limited to the northern region. In contrast the increase of chaetognaths presented a similar pattern to that observed in El Niño 1997-1998.
Key words: El Niño, California Current System, Baja California, bio-physical coupling.
Resumen
En este trabajo se describen las condiciones oceanográficas del Océano Pacífico frente a Baja California durante el periodo 2002-2003. De octubre de 2002 a abril de 2003 se observaron relaciones anómalas entre la temperatura y la salinidad debidas a la fuerte presencia de agua de origen subártico, con baja salinidad y baja temperatura, en los 100 m superiores de la columna de agua. Por debajo de los 100 m de profundidad los datos físicos sugirieron condiciones que indican la presencia de un evento El Niño débil. Durante el periodo de estudio no se observó una disminución en los vientos dominantes o vientos con dirección hacia el polo. El ecosistema pelágico mostró fuertes cambios estacionales debidos a la intrusión de agua subártica, con zonas de alta clorofila y zooplancton en julio de 2002, con un fuerte decremento durante el otoño e invierno siguientes. Tanto la clorofila como el zooplancton resurgieron en abril de 2003, con un mayor gradiente costa-océano en el zooplancton. No se presentó una fuerte señal biológica durante el período. Los grupos de zooplancton que mostraron un incremento durante El Niño 2002-2003 fueron las salpas y los quetognatos. El incremento de salpas no parece estar asociado al evento, ya que su incidencia fue estacional y restringida a la región norte. En cambio el incremento en quetognatos presentó un patrón similar al de El Niño 1997-1998.
Palabras clave: El Niño, Sistema de la Corriente de California, Baja California, acoplamiento físico-biológico.
Introduction
The California Current System (CCS) is comprised of the near-surface equatorward California Current (CC), the subsurface poleward California Undercurrent (CU), and the nearshore seasonally intermittent California Countercurrent (CCC). These currents change in strength at seasonal and inter-annual scales. Interannual variability is closely linked to changes in the mid-latitude atmospheric circulation associated with El Niño events. During El Niño, the Aleutian low pressure cell strengthens and produces stronger winter storms (Strub and James, 2003), weakened clockwise (cyclonic anomaly) atmospheric circulation (Schwing et al., 2002), increased onshore Ekman transport and a deeper thermocline. These were in general the changes observed along the northeastern Pacific during the 1997-1998 El Niño event.
The anomalous conditions off Baja California described above coincided with near-surface coastal poleward currents, warmer and saltier than usual waters (up to 9°C and 0.8, respectively), an expansion of the volume of the CU (Durazo and Baumgartner, 2002), and a shifting in the species composition of zooplankton (Lavaniegos et al., 2002). The conditions observed were seen as the response to anomalous cyclonic atmospheric circulation, which displaced the CC core offshore and favored the poleward intrusion of subtropical waters into the coastal region (Durazo and Baumgartner, 2002).
During the period 2002-2003, an El Niño event took place. For the equatorial Pacific, this climatic episode was described as moderate (McPhaden, 2004), with sea surface temperature (SST) anomalies developing between September and December 2002. These SST anomalies occurred in conjunction with strong, sustained eastward surface current anomalies that began in July (Lagerloef et al., 2003) and were detected in the eastern equatorial Pacific in the second half of 2002 (McPhaden, 2004). Within the CCS, El Niño 2002-2003 was marked by cold and fresh surface waters during 2002 and weak warming in early 2003 (Venrick et al., 2003). Off California, cold and fresh conditions have been associated with an excess of subarctic water (Bograd and Lynn, 2003). There have been no reports that indicate such conditions off Baja California. The purpose of this paper is to analyze the oceanographic conditions in the southern portion of the CCS during El Niño 2002-2003, using hydrographic data collected during this period, and define whether subarctic waters reached southern latitudes. Relevant biological data were also analyzed to study the pelagic ecosystem response.
Methods
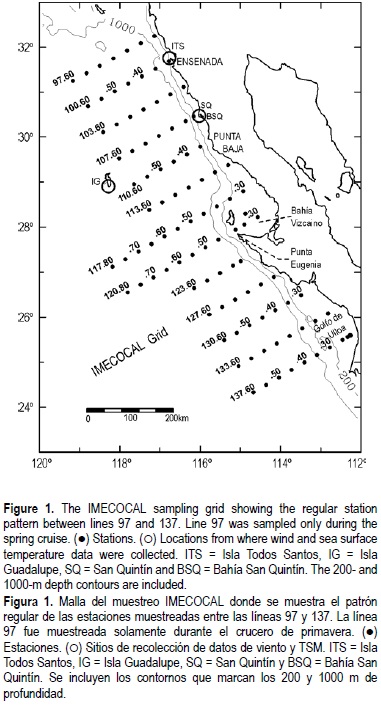
Winds were measured using Aanderaa meteorological stations at four selected locations along the northern Baja California coast, from January 2000 to July 2003. These include two coastal stations, one at Isla Todos Santos (ITS) and another at Bahía San Quintín (BSQ); one inland station at San Quintín (SQ); and an oceanic station at Isla Guadalupe (IG) (see table 1 and fig. 1). The ITS station is located in the northern part of the island, about 15 km west of Ensenada. The BSQ station is located near the shoreline north of San Quintín Bay, while the SQ station is about 20 km inland. The IG station is located in the southern part of the island. The time frame of measurements differs among the four stations but the basic statistics of all data at each station are included here in order to provide a reference for future works.
Starting in November 1998, SST was measured at IG adjacent to the meteorological station, using a SBE 26 SEAGAUGE. Accuracy and resolution of the temperature sensor are 0.02°C and 0.01°C, respectively. An analysis of the temperature time series from 2000 to 2003 is presented, although a seasonal mean was obtained with all available data.
Since 1997, the Investigaciones Mexicanas de la Corriente de California (IMECOCAL) program conducts quarterly surveys off Baja California along a subset grid of the original California Cooperative Fisheries Investigations (CalCOFI) program (fig. 1). This report analyzes data gathered mainly during cruises conducted in July and October 2002, and January/February and April 2003 (hereafter cruises 0207, 0210, 0301 and 0304, respectively). Some previous data are also analyzed. At each oceanographic station, CTD casts were made to 1000 m (bottom depth permitting) and water samples were collected from seven depths (0, 10, 20, 50, 100, 150 and 200 m) for the determination of dissolved oxygen and chlorophyll a. To determine chlorophyll a, samples were screened through Whatman GF/F filters with 0.7-µ.m nominal pore size in order to collect phytoplankton cells, and analyzed by the fluorometric technique with a Turner Designs AU-05 fluorometer (Holm Hansen et al., 1965; Yentsch and Menzel, 1963; Venrick and Hayward, 1984).
Standard (0.505-mm mesh) double oblique bongo tows from 210 m depth (or from 10 m above the bottom) to the surface were carried out at each station. A flow meter in the net entrance was used to measure the volume of water strained (Smith and Richardson, 1977). Zooplankton volume was measured by displacement in a graduated cylinder (Smith and Richardson, 1977), one month after the end of each cruise. Taxonomic analyses were done for cruises 0207 and 0301, and for previous winter and summer IMECOCAL cruises (9801, 9807, 9901, 9908 and 0001). Samples were subdivided with a Folsom splitter to 1/8 or 1/16 and in some cases to 1/32. All specimens in the subsample were counted. Zooplankton volume and abundance were standardized to 1 m3 of filtered water. Mean and confidence intervals were estimated from log-transformed data. Zooplankton volume data from previous CalCOFI cruises conducted off Baja California were used to estimate seasonal anomalies. First, CalCOFI data collected in January, April, July and October from 1951 to 1984 were selected and log-transformed. Then, seasonal means for the period 1951-1984 were computed. Finally, mean zooplankton volumes for each cruise (0207, 0210, 0301 and 0304) were compared to seasonal means to compute anomalies. The area was divided into north (lines 100-110) and central (lines 113130) regions as described in Lavaniegos et al. (2002).
Results
Wind observations
For each station, ellipse components were computed in order to determine the axis of maximum variability. Because the coastline and major axis orientations are very similar (table 1), wind velocity components were rotated so as to define alongshore and across-shore components to coincide with the major and minor axes, respectively. Time series of the alongshore wind component for all stations, as well as SST at IG superimposed on the annual fit, are shown in figure 2. Right panels (fig. 2a-d) denote wind direction frequency distributions. In this paper, wind and SST anomalies are defined as those observations above (weaker wind or lower SST) or below (stronger wind or higher SST) the seasonal mean of the alongshore component (or SST), plus or minus the standard error (shaded band in fig. 2). It is important to note that since records are short, seasonal fits may not adequately reflect the true seasonal variability. The results may therefore change at a later stage when larger data sets are obtained.

Data reveal generally equatorward winds (negative alongshore component) and a dominance of northwesterly (~315°) winds, strongest around May/June and weakest in January. Except for the SQ station (inland, fig. 2c), a relative maximum in intensity is also seen in October. At the ITS and SQ coastal stations (fig. 2a, c), large variability in the frequency distributions and the presence of winds in the cross-shore direction suggest the influence of the local topography and breezes. The amplitude of the seasonal mean is larger for the oceanic station (~2 m-1 at IG, fig. 2d). The IG station presents the more intense and persistent winds, with high variability of alongshore wind speed around the seasonal mean. The ITS station shows the largest variability relative to SQ and BSQ, due to the diurnal breeze. Mean wind speed (table 1) is maximum at the oceanic station (IG) and minimum at the inland location (SQ). Anomalously weak winds signaling El Niño conditions were not recorded at any of the stations, except for events lasting two to three weeks at IG during winter (late 2002 and early 2003).
On the other hand, the SST time series for IG exhibits a strong seasonal cycle, with a relative maximum (~20°C) around September and a minimum (~15°C) around March (fig. 2e). Above normal temperatures were observed from January to September 2000 and in early 2003.
Thermohaline characteristics
Temperature-salinity (T-S) diagrams are used here to illustrate the main thermohaline characteristics that prevailed during the surveys (fig. 3). In order to better visualize changes in the existing conditions, T-S data pairs are contrasted to cli-matological profiles (±1 standard deviation) for each season, computed from the 1950-1978 CalCOFI and the 1997-2003 IMECOCAL data. Mean temperature and salinity were computed over selected density ranges. Red and green thick curves depict the climatological and cruise means, respectively. Care was taken to compare T-S diagrams and the corresponding mean profiles for the same oceanic stations occupied during each cruise. Cruise mean curves (green) indicate that near normal conditions persisted during the summer of 2002 (fig. 3a), since data points for the 0207 cruise fall near the climatological mean. The exception for this cruise are warm surface waters (σt < 24), which are not observed in the climatological mean. Starting in October 2002 (fig. 3b), fresher than usual waters are observed for 24.5 <σt < 25, while in January (0301) and April (0304) near-surface waters were fresher than the mean profile for σt < 24.6 and σt < 25.5, respectively. Besides the difference in salinity, data from October 2002 (fig. 3b) also showed lower than seasonal mean surface temperatures (~2-3 °C). These last three cruises showed the presence of less saline water (S ~ 33) around the near-surface salinity minimum (σt ~25, 0-100 m). This minimum is associated with the CC core, a water mass of subarctic origin. The presence of this relative salinity minimum suggests that during these months, subarctic water entered the region through intensification of equatorward flows or larger spatial extension, or both, of the CC.
Below the σt = 26 isopycnal (200-500 m), mean T-S curves derived from the four cruises are near normal; however, T-S value pairs differing up to two standard deviations from the climatological mean profile are discernible during July, October and January. The presence of more saline waters along 26 < σt < 26.5 suggests a slight increment in the volume of water carried by the CU between 200 and 500 m depth (see Durazo and Baumgartner, 2002).
Geostrophic flow
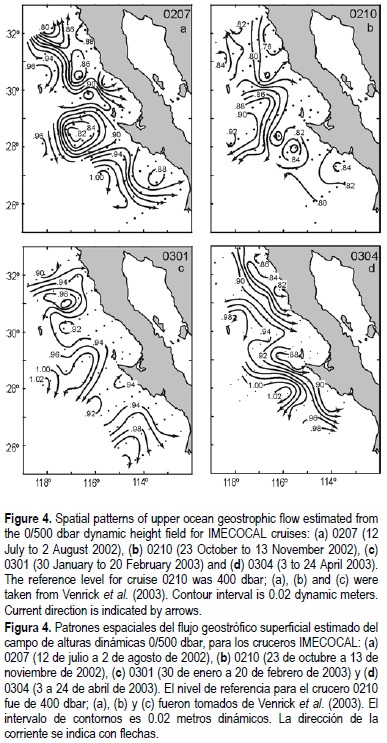
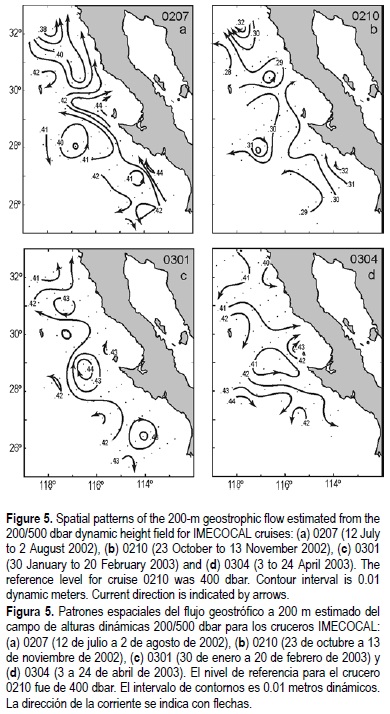
Dynamic height anomalies at 0 and 200 dbar over the 500 dbar level, except for October 2002 when the length of the hydrographic cable permitted sampling only to 400 m, are used to describe the surface and subsurface fields of flow, respectively (figs. 4, 5). Note that near-surface currents for cruises 0207, 0210 and 0301 have been described in Venrick et al. (2003).
Near-surface dynamic heights depict in general an equator-ward flow with considerable mesoscale features (fig. 4a-d). There are indications of poleward flows only at selected coastal locations associated with coastal prominences and upwelling, or near the coast of Punta Eugenia during July 2002 when the northward flow is due to the presence of a cyclonic gyre centered around 200 km offshore. Thus, the expected northward flow carrying waters from the south, as is usually seen for an El Niño event, was not present.
Below the surface, geostrophic flows at 200 dbar for cruises 0207, 0210 and 0301 (fig. 5a-c) show poleward flows depicting the presence of the CU, adjacent to the coast and the shelf break (July and October 2002) or displaced offshore and circulating around clockwise eddies (January 2003). During the spring of 2003 (fig. 5d), the CU is not clearly discernible in the dynamic height anomaly field.
Temperature and salinity anomalies
A measure of the changes induced by local and remote forcing during 2002-2003 are temperature and salinity anomaly fields for line 120 (fig. 6), a line that represents the locus of the greatest latitudinal variability of water properties within the CCS. Anomalies are referred to climatological means derived from 33 years of historical data (CalCOFI and IMECOCAL).
The data from summer 2002 (fig. 6a, b) show cores of negative temperature anomalies (ó3.5°C) at about 70 m depth (fig. 6a) and positive salinity anomalies (~0.3) between 100 and 150 m depth (fig. 6b). Saltier conditions could indicate El Niño conditions with southern waters being carried northward along the coast. However, as is suggested by the surface and 200 dbar geostrophic currents (figs. 4a, 5a), the cores of colder and saltier water are apparently associated with a cyclonic gyre off Punta Eugenia.
The October 2002 temperature and salinity anomalies (fig. 6c, d) show colder and fresher (-2°C, -0.3) than usual conditions over the upper 100 m. This was reflected in the T-S curves of figure 3b as a shifted relative salinity minimum along the σt ~ 25 isopycnal surface. These anomalous conditions suggest that more volume of the CC, that is, an excess of subarctic water, reached the survey region during this season. At around 200 dbar, positive temperature and salinity anomalies for this cruise, as well as the large dispersion of T-S points along the σt = 26 in figure 3b, suggest an increment of the volume of water of equatorial origin carried by the CU (fig. 5b).
Small temperature anomalies (~1°C) during January 2003 (fig. 6e) depict near-normal conditions, while near-surface salinity values lower than the mean (--0.3, fig. 6f) suggest that a greater volume of subarctic waters encroached upon the Baja California survey region. As in the October cruise, this is substantiated by the shifting in the T-S diagrams towards lower salinities above the σt > 25.3 (fig. 3c). Below 100 m depth, positive temperature and salinity anomalies (1°C, 0.2) suggest, as in cruise 0207, an enhancement of flow of the equatorial waters (CU, fig. 5c).
Finally, the April 2003 (0304) data depicted warmer than usual waters (~3°C, fig. 6g) in a core centered at 70 m depth. As suggested by the near-surface geostrophic currents of figure 4, this anomalous warming could be of local origin. This can result from surface waters being transported into Vizcaíno Bay, recirculated inside in an almost permanent clockwise gyre (Palacios-Hernández et al., 1996) and later transported outside (warmer), to be incorporated again into the southern flow of the CC (fig. 4). Lower than normal (-0.4 to 0) salinities were found throughout most of the section, but they were largest (ó0.4) in a subsurface core centered between 100 and 150 m adjacent to the shelf break (fig. 6h). The T-S diagram (fig. 3d) and the geostrophic velocities depicting equa-torward flow and absence of poleward flows (CU) at 200 m (figs. 4, 5d), indicate that these waters come from a northern source, namely the subarctic.
Biological patterns
The July 2002 cruise (0207) exhibited high zooplankton biomass (100-500 µL m-3) over most of the survey area (fig. 7a), separated by two zonal bands of lower biomass (<100 µL m-3). In the Gulf of Ulloa (~24.5-26.5°N) even higher biomass was found (>500 m-3). Zooplankton biomass anomalies during cruise 0207 (logarithms, fig. 7e) were highly variable from one sampled station to another; however, a negative tendency was evident in the coastal zone off northern Baja California and a positive one in the central lines and the Gulf of Ulloa.
Phytoplankton chlorophyll a in summer 2002 was high (>1.0 mg m-3, fig. 8) near the coastal locations of lines 100 and 120 (fig. 8a, e). These low chlorophyll concentrations are associated with warm and low nutrient waters recirculated by the Southern California Bight Eddy (Lynn and Simpson, 1987). Nearshore locations with the highest chlorophyll were related to 10-m water with temperature below 15°C (Venrick et al., 2003), indicating that coastal upwelling processes during this survey increased phytoplankton production. High chlorophyll concentrations extending offshore in line 120 (fig. 8e) appear to be related to nutrient-rich waters advected from the coast and circulated through a cyclonic gyre off Punta Eugenia.
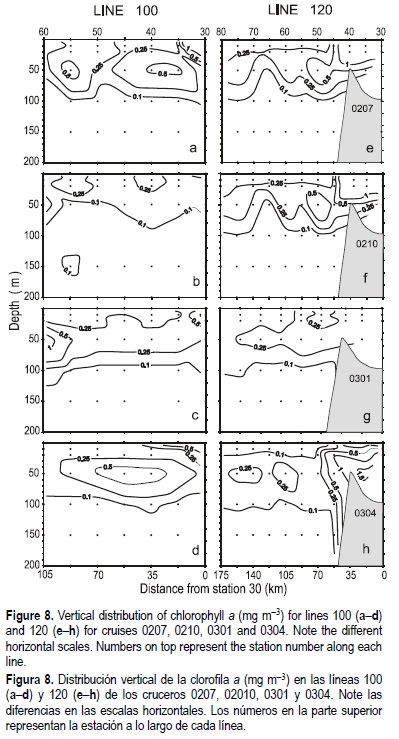
Zooplankton biomass decreased during the autumn survey (0210, fig. 7b), with volumes lower than 100 µL m-3 over most of the IMECOCAL grid. It remained slightly higher at some coastal locations and offshore south of Punta Eugenia. Logarithmic anomalies were negative in most of the area, indicating a season less rich than the historic mean (fig. 7f). Generally, low phytoplankton biomass (fig. 8) was related to decreased coastal upwelling and increased near-surface temperatures (Venrick et al., 2003). High concentrations of chlorophyll (>1.0 mg m-3) were only located inside Vizcaíno Bay, and at one inshore station of line 120 (fig. 8f). For most of the sampled area phytoplankton chlorophyll was below 0.25 mg m-3, with high concentrations only at nearshore stations of line 120.
Winter (0301) zooplankton biomass was extremely low (fig. 7c), with values less than 100 µL m-3 over most of the region; however, the maximum negative anomalies were found toward the north (fig. 7g). Chlorophyll concentrations were also very low, with values >1.0 mg m-3 only in offshore subsurface waters of line 100 (fig. 8c). The 10-m temperature had a north-south gradient (see Venrick et al., 2003), which indicated that coastal upwelling processes were absent or very weak during this period. Phytoplankton biomass showed a typical condition of winter season, with low near-surface values and small vertical changes in the water column.
Zooplankton volumes along the coast rebounded during April 2003 (fig. 7d), surpassing 500 µL m-3 in coastal prominences such as Punta Colonet (~30.8°N), Vizcaíno Bay and Punta Abreojos (~26.5°N). This recovery appears to be due to the increased phytoplankton biomass (fig. 8d). Zooplankton positive anomalies (fig. 7h) indicate that this rebound over the coastal zone was higher than usual for spring 2003. Chlorophyll concentrations were high (fig. 8d, h), mainly at inshore locations associated with an increase of wind stress (fig. 2d) and equatorward flow (fig. 4).
Total zooplankton abundance and structure for northern and central Baja California are depicted in figure 9. Abundances for summer (0207) and winter (0301) (fig. 9a, b) follow the tendency observed in biomass, with high values in July 2002 and low values in February 2003. Total abundance was similar in the northern and central zones during the 0207 cruise (antilogged mean = 49 ind m-3), whereas in 0301 it was lower in the northern than in the central region (antilogged means = 10 and 22 ind m-3, respectively). The seasonal change was similar to that observed in previous summer to winter transitions for the period 1999-2000. Winter 1998 was anomalous, displaying abundances in the range usually observed during the summer, while in other winters they were low (fig. 9a, b).

The zooplankton structure did not show clear seasonal differences, but there were interannual and regional differences (fig. 9c, d). While copepods usually occupy 50-60% of the zooplankton abundance in the central region, they represented only 36-44% during winter 1998 and its transition to La Niña in 1999, due mainly to the presence of salp blooms (fig. 9d). In the northern region, salps were abundant only in January 1999 and July 2002 (fig. 9c). A high percentage of chaetognaths was a feature of winter 1998, observed again in February 2003 (mainly in the central region), and could be related to the weak El Niño conditions. The larger size of salps, compared to chaetognaths, could explain the main differences in biomass between both cruises. The high percentage of salps found in July 2002 was also observed in July 1998, although restricted to the central region. These regional differences could be related to the kind of species present in each case. For example, Thalia orientalis was dominant during cruise 9807 (Hereu et al., 2003), while the large Pegea socia was very abundant in 0207.
Discussion
Near-surface thermohaline data, the absence of poleward coastal flow and the typical northwesterly winds reported here, do not indicate the presence of an El Niño during 2002-2003, as has been defined from previous events, e.g. 1997-1998 (Lynn et al., 1998; Hayward et al., 1999; Bograd et al., 2000; Durazo and Baumgartner, 2002; Lynn and Bograd, 2002). The T-S relationships indicated that waters above 25.5 σt (0-100 m) had lower salinity than the climatological mean for most of the cruises. Low-salinity waters were observed near the surface from July 2002 through April 2003. The lowest salinity values (S ~ 33) were measured in October 2002 and January 2003. Only during October 2002 were these low salinity waters associated with negative temperature anomalies. Lower than the mean salinities may be seen as a logical consequence of stronger than usual equatorward winds that transport more volume of water of northern origin. More intense winds are the typical conditions of a La Niña event. However, the wind records presented above and the T-S diagrams for 2002-2003 indicated that the atmospheric and hydrographic conditions were substantially different than those reported for La Niña 1999-2000 (Durazo et al., 2001; Durazo and Baumgartner, 2002). During La Niña, increased upwelling rises the nutricline in the coastal region of Baja California (Espinosa-Carreón et al., 2004) and brings higher salinity waters to the surface; therefore, the relative salinity minimum between 25 and 25.5 σt, signaling the core of the CC, is not as evident (Durazo and Baumgartner, 2002).
Subarctic water is the source of low salinity in the northeastern Pacific (Lynn and Simpson, 1987), and it has been influencing the CCS since the summer of 2002 (Huyer, 2003; Kosro, 2003; Venrick et al., 2003). The results shown here suggest that the subarctic water enhancement observed at northern latitudes, reached as far south as 28°N during the period from July 2002 to April 2003. In consequence, the weak El Niño 2002-2003 could have been concealed by the subarctic influence.
Below approximately 100 m depth, a well-developed CU and the dispersion of T-S data towards higher salinities along the 26-26.5 σt suggested that El Niño was present from July 2002 to January 2003. The timing of the positive anomalies observed differs from the findings of Venrick et al. (2003), who reported a moderate El Niño over southern California waters only during early 2003. When compared to anomalies recorded during the 1997-1998 El Niño event, the magnitude of the temperature and salinity anomalies (1-2°C, 0.2-0.4) indicated that its effect was weak.
The chlorophyll a data also substantiate the absence of surface warming associated with El Niño conditions. Even April 2003 showed increased phytoplankton biomass at coastal locations, two-fold higher than those reported by Lavaniegos et al. (2003) for waters off Baja California during the 1997-1998 El Niño event. The increased chlorophyll levels in April 2003 could also be interpreted as the end of El Niño, since January/ February 2003 reported almost normal conditions for the eastern and central equatorial Pacific, and by May 2003 the anomalous warm conditions had completely dissipated (http://www.cpc.ncep.noaa.gov; McPhaden, 2004).
Changes in zooplankton biomass followed a similar pattern, responding to the increase in chlorophyll with anomalously high values in nearshore stations; however, the situation was conspicuously different to that observed during the previous strong El Niño 1997-1998 in Baja California (Lavaniegos et al. , 2002). The zooplankton biomass maintained a typical level during autumn 1997, with a small increment in January 1998 (Lavaniegos et al., 2002), while winter 2003 exhibited impoverished conditions, both in biomass and total abundance.
The seasonal changes in zooplankton biomass distribution showed the typical maximum in summer and minimum in winter (Lavaniegos et al., 1998), as well as the strong onshore-offshore spring gradient. The anomalies in zooplankton distribution suggest that the transition from summer to autumn in 2002, as well as the transition from winter to spring in 2003, were more drastic than usual because of the presence of abundant salps in summer, decreasing thereafter. Salps are large pelagic tunicates, which impact the measurements based on biovolume. However, this acute transition from July to October 2002 does not appear to be influenced by a pattern typical of El Niño because of the unusual surface cooling observed during these months (e.g., Bograd and Lynn, 2003). A subarctic influence originated 10-m temperature anomalies in the range of -3°C to 0°C during cruise 0207, and of -2°C to 0°C during 0210. The species observed during El Niño 1997-1998 were related to saline water from the southwest (Hereu et al., 2003), while the blooms of Pegea socia present in northern Baja California during the summer of 2002 seem to be transported to the region from northern latitudes.
The zooplankton community structure of major taxa revealed drastic changes in tunicates and large carnivores, while other groups kept more conservative proportions. Tuni-cates are an important herbivorous assemblage in the CCS (Berner, 1967; Smith, 1985; Lavaniegos and Ohman, 2003), significantly altering the flux of matter in the pelagic ecosystem (Fortier et al., 1994). Although the causes triggering salps and other tunicate blooms must still be investigated, it has been suggested that these may be driven by periods of stratification followed by wind-induced mixing (Ménard et al., 1994). The thermal and saline fronts often recorded off Baja California (Roden, 1971) may provide the appropriate niches for the development of these organisms, which would find good conditions for grazing at moderate phytoplankton concentrations in the region. The ocean off Baja California is a very unstable area because of the strong replacement of species that occurs.
Acknowledgements
Funding was provided by CONACYT (projects G0041T, G35326-T, SEP-2003-C0242569 y U40822-F), CICESE and UABC (program 311). We are grateful to the captain and crew of the R/V Francisco de Ulloa for their help during the field work. Thanks to all the students and technicians that participated during the IMECOCAL surveys and the sample analyses. J. García processed all the CTD data. M. de la Cruz, J.M. Domínguez and F. Ponce worked on some figures. Wind data were obtained by E. Gil. Historical data of zooplankton volumes were provided by Paul Smith. The comments and suggestions made by three reviewers greatly improved this manuscript.
References
Berner, L.D. (1967). Distributional Atlas of Thaliacea in the California Current region. CalCOFI Atlas, 8: 1-322. [ Links ]
Bograd, S.J. and Lynn, R.J. (2003). Anomalous subarctic influence in the southern California Current during 2002. Geophys. Res. Lett., 30, 8020, doi: 10.1029/2003GL017446. [ Links ]
Bograd, S.J., DiGiacomo, P.M. Durazo, R., Hayward, T.L., Hyrenbach, K.D., Lynn, R.J., Mantyla, A.W., Schwing, F.B., Sydeman, W.J., Baumgartner, T., Lavaniegos, B. and Moore, C.S. (2000). The state of the California Current, 1999-2000: Forward to a new regime? CalCOFI Rep., 41: 26-52. [ Links ]
Durazo, R. and Baumgartner, T. (2002) Evolution of oceanographic conditions off Baja California: 1997-1999. Prog. Oceanogr., 54: 7-31. [ Links ]
Durazo, R., Baumgartner, T.R., Bograd, S.J., Collins, C.A., de la Campa, S., García, J., Gaxiola-Castro, G., Huyer, A., Hyrenbach, D., Loya, D., Lynn, R.J., Schwing, F.B., Smith, R.L., Sydeman, W.J. and Wheeler, P. (2001) The state of the California Current 2000-2001: A third straight La Niña year. CalCOFI Rep., 42: 29-60. [ Links ]
Espinosa-Carreón, T.L., Strub, T., Bier, E., Ocampo, F. and Gaxiola-Castro, G. (2004). Seasonal and interannual variability of satellite derived chlorophyll, surface height and temperature off Baja California. J. Geophys. Res., 109, C03039, doi:10.1029/2003JC002105. [ Links ]
Fortier, L., Lefevre, J. and Legendre, L. (1994). Export of biogenic carbon to fish and to the deep-ocean. The role of large planktonic microphages. J. Plankton Res., 16: 809-839. [ Links ]
Hayward, T.L., Baumgartner, T.R., Checkley, D.M., Durazo, R., Gaxiola-Castro, G., Hyrenbach, K.D., Mantyla, A.W., Mullin, M.M., Murphree, T., Schwing, F.B., Smith, P.E. and Tegner, M.J. (1999). The state of the California Current in 1998-1999: Transition to cool-water conditions. CalCOFI Rep., 40: 29-62. [ Links ]
Hereu, C.M., Jiménez-Pérez, L.C. and Lavaniegos, B.E. (2003). Effects of the El Niño 1997-1998 and the rapid transition to cool conditions in the winter 1998-1999 on the copepods and salps of the California Current. 3rd International Zooplankton Production Symp., 20-23 May 2003, Gijón, Spain, Program and Abstracts, p. 53. [ Links ]
Holm Hansen, O., Lorenzen, C.J., Holmes, R.W. and Strickland, J.D.H. (1965). Fluorometric determination of chlorophyll. J. Cons. Int. Explor. Mer, 30: 3-15. [ Links ]
Huyer, A. (2003). Prefase to special section on enhanced subarctic influence in the California Current, 2002. Geophys. Res. Lett., 30, 8019, doi:10.1029/2003GL017724. [ Links ]
Kosro, P.M. (2003). Enhanced southward flow over the Oregon shelf in 2002: A conduit for subarctic water. Geophys. Res. Lett., 30, doi: 10.1029/2003GL017436. [ Links ]
Lagerloef, G.S.E., Lukas, R., Bonjean, F., Gunn, J.T., Mitchum, G.T., Bourassa, M. and Busalacchi, J. (2003) El Niño tropical Pacific Ocean surface current and temperature evolution in 2002 and outlook for early 2003. Geophys. Res. Lett., 30, 1514, doi:10.1029/2003GL017096. [ Links ]
Lavaniegos, B.E. and Ohman, M.D. (2003). Long-term changes in pelagic tunicates in the California Current. Deep-Sea Res. II, 50: 2493-2518. [ Links ]
Lavaniegos, B.E., Gómez-Gutiérrez, J., Lara-Lara, J.R. and Hernández-Vázquez, S. (1998). Long-term changes of zooplankton volumes in the California Current System. The Baja California region. Mar. Ecol. Prog. Ser., 169: 55-64. [ Links ]
Lavaniegos, B.E., Jiménez-Pérez, L.C. and Gaxiola-Castro, G. (2002). Plankton response to El Niño 1997-1998 and La Niña 1999 in the southern region of the California Current. Prog. Oceanogr., 54: 33-58. [ Links ]
Lavaniegos, B.E., Gaxiola-Castro, G., Jiménez-Pérez, L.C., González-Esparza, M.R., Baumgartner, T. and J. García-Córdova (2003). 1997-98 El Niño effects on the pelagic ecosystem of the California Current off Baja California, Mexico. Geofís. Int., 42: 483-494. [ Links ]
Lynn, R.J. and Simpson, J.J. (1987) The California Current system: The seasonal variability of physical characteristics. J Geophys. Res., 92: 12947-12966. [ Links ]
Lynn, R.J. and Bograd, S. (2002). Dynamic evolution of the 19971999 El Niño-La Niña cycle in the southern California Current System. Prog. Oceanogr., 54: 59-75. [ Links ]
Lynn, R.J., Baumgartner, T., García, J., Collins, C.A., Hayward, T.L., Hyrenbach, K.D., Mantyla, A.W., Murphree, T., Shankle, A., Schwing, F.B., Sakuma, K.M. and Tegner, M.J. (1998). The state of the California Current, 1997-1998: Transition to El Niño conditions. CalCOFI Rep., 39: 25-49. [ Links ]
McPhaden, M.J. (2004). Evolution of the 2002-2003 El Niño. Bull. Am. Meteor. Soc., 85, 677, doi:10.1175/BAMS-85-5-677. [ Links ]
Ménard, F., Dallot, S., Thomas, G. and Braconnot, J.C. (1994). Temporal fluctuations of two Mediterranean salp populations from 1967 to 1990. Analysis of the influence of environmental variables using a Markov chain model. Mar. Ecol. Prog. Ser., 104: 139-152. [ Links ]
Palacios-Hernández, E., Argote, M.L., Amador, A. y Mancilla, M. (1996). Simulación barotrópica inducida por viento en Bahía Sebastián Vizcaíno, B.C. Atmósfera, 9: 171-188. [ Links ]
Roden, G.I. (1971). Aspects of the transition zone in the northeastern Pacific. J. Geohys. Res., 76: 3462-3475. [ Links ]
Schwing, F.B., Murphree, T., de Witt, L. and Green, P.M. (2002). The evolution of oceanic and atmospheric anomalies in the northeast Pacific during the El Niño and La Niña events of 1995-2001. Prog. Oceanogr., 54: 459-491. [ Links ]
Smith, P.E. (1985). A case history of an anti-El Niño to El Niño transition on plankton and nekton distribution and abundances. In: W.S. Wooster and D.L. Fluharty (eds.), El Niño north - Niño effects on the eastern subarctic Pacific Ocean. Washington Sea Grant Program, Seattle, pp. 121-142. [ Links ]
Smith, P.E. and Richardson, S.L. (1977). Standard techniques for pelagic fish egg and larva surveys. FAO Fish. Tech. Pap., 175: 1-100. [ Links ]
Strub, P.T. and James, C. (2003). Altimeter estimates of anomalous transports into the California Current during 2000-2002. Geophys. Res. Lett., doi: 10,1029/2003GL017513. [ Links ]
Venrick, E.L. and Hayward, T.L. (1984). Determining chlorophyll on the 1984 CalCOFI surveys. CalCOFI Rep., 25: 74-79. [ Links ]
Venrick, E., Bograd, S., Checkley, D., Cummings, S., Durazo, R., Gaxiola-Castro, G., Hunter, J., Huyer, A., Hyrenbach, K.D., Lavaniegos, B.E., Mantyla, A., Schwing, F.B., Smith, R.L., Sydeman, W.J. and Wheeler, P.A. (2003). The state of the California Current, 2002-2003: Tropical and subarctic influences vie for dominance. CalCOFI Rep., 44: 28-60. [ Links ]
Yentsch, C.S. and Menzel, D.W. (1963). A method for the determination of phytoplankton chlorophyll and phaeophytin by flourescence. Deep-Sea Res., 10: 221-231. [ Links ]

