


Servicios Personalizados
Revista
Articulo
 Inglés (pdf)
 Artículo en XML
 Referencias del artículo
 Enviar artículo por email
Indicadores
-
 Citado por SciELO
 -
 Accesos
Links relacionados
-
 Similares en
SciELO
Similares en
SciELO
Compartir

 Permalink
Ciencias marinas
versión impresa ISSN 0185-3880
Cienc. mar vol.30 no.4 Ensenada dic. 2004
Artículos
Assessment of the Pacific red snapper (Lutjanus peru) fishery in the southwestern Gulf of California
Evaluación de la pesquería del huachinango (Lutjanus peru) en el suroeste del Golfo de California
J. Gabriel Díaz-Uribe1a, Ernesto A. Chávez2, Juan F. Elorduy-Garay2
1 Centro de Estudios Sustentables Universidad Autónoma de Baja California Sur Apartado postal 19-B La Paz, CP 23080, Baja California. Sur, México.E-mail: diazjuan@prodigy.net.mx
a Current Address: Instituto Nacional de la Pesca. Centro Regional de Investigación Pesquera - La Paz, Carretera a Pichilingue Km. 1, La Paz 23020, BCS, México.
2 Departamento de Pesquerías y Biología Marina Centro Interdisciplinario de Ciencias Marinas Instituto Politécnico Nacional Apartado postal 592 La Paz, CP 23000, Baja California. Sur, México.
Recibido en julio de 2003;
aceptado en mayo de 2004.
Abstract
The Pacific red snapper (Lutjanus peru) fishery in the southwestern Gulf of California was analyzed with an age-structured simulation model. In addition to natural mortality (M) and fishing mortality (F), the model incorporates juvenile by-catch mortality (f caused by the shrimp fishery in the zone. Four simulated scenarios were tested in which different levels of mortality were combined. Contrary to what is established in the National Fishing Charter, simulation outputs showed that the Pacific red snapper fishery cannot be developed if both F and f are kept unregulated as presently occurs. According to the model, the fishery could only be developed with an effective regulation of these mortality sources, which implies control measures for both the artisanal fleet and the shrimp fleet.
Key words: Lutjanidae, Pacific red snapper, stock assessment, Gulf of California, small-scale fisheries.
Resumen
Se analizó la pesquería del huachinango (Lutjanus peru) en la región suroeste del Golfo de California con un modelo de simulación estructurado por edades. Además de la mortalidad natural (M) y la mortalidad por pesca (F), el modelo incorpora la mortalidad incidental de juveniles (f) que se da por la pesca de camarón en la zona. Se probaron cuatro escenarios de simulación en donde se combinaron diferentes niveles de mortalidad. Contrario a lo que señala la Carta Nacional Pesquera, los resultados del modelo mostraron que la pesquería no tiene posibilidades de desarrollarse si F y f continúan sin ser reguladas como hasta ahora. De acuerdo al modelo, la pesquería podría desarrollarse mediante una regulación efectiva de ambas fuentes de mortalidad, lo que implica medidas de control tanto para la flota artesanal, como para la flota camaronera.
Palabras clave: Lutjanidae, huachinango, evaluación pesquera, Golfo de California, pesquerías artesanales.
Introduction
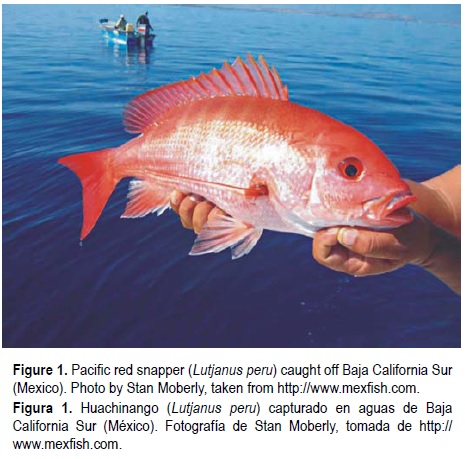
The Pacific red snapper (Lutjanus peru) (fig. 1) is one of the most important fish resources landed by artisanal fleets along the Mexican Pacific coast, both by catch volume and by commercial value (INP, 2001). In some northwestern regions of Mexico, such as the eastern coast of Baja California Sur, the multi-species fishing cycle mainly depends on this species because, according to the landing records of 1998-2000, Pacific red snapper can contribute up to 25% of the income by first-sales at the beach.
Despite its importance, assessment studies for the Pacific red snapper are so scarce that the status of the fishery is not clear. In Nayarit and Colima, the fishery appears to be below its maximum yield (Cruz-Romero et al., 1996; Del Monte-Luna et al., 2001), while there is evidence of overexploitation in Guerrero (Santamaría and Chávez, 1999). In some official documents, the Pacific red snapper fishery is considered to have potential for development along the Pacific coast (SEMARNAP, 2000a; INP, 2001); however, the National Fishing Charter (Carta Nacional Pesquera) states that the fishery only has potential for development in the state of Baja California Sur (BCS), because in the rest of the country it is captured at its maximum sustainable yield (Diario Oficial de la Federación, August 28, 2000).
Without previous assessment studies for this fishery in BCS, the potential for development can be called into question. For instance, in the bays of La Paz and La Ventana (fig. 2), where the Pacific red snapper fishery is most productive in BCS, nearly 50% of the commercial landings are composed of fish under 40 cm, and 94% of them are sexually immature (Rocha-Olivares, 1991). Moreover, juveniles have been recorded in the shrimp fishery by-catch (Pérez-Mellado and Findley, 1985); therefore, in this area, where both fisheries operate (Ross-Terrazas, 1988), the incidental mortality of juveniles is an important factor affecting the dynamics of the population. The purpose of this work is to evaluate the state of the Pacific red snapper fishery in the bays of La Paz and La Ventana through a simulation model that integrates the effect of juvenile mortality.

Methods
Basic parameters
From March 1989 to February 1991, 1230 specimens were collected from commercial landings at the bays of La Paz and La Ventana (fig. 2). Length, weight and sex were determined for each specimen. The age at first maturity (tm) and the age at first catch (tc) were estimated with the growth parameters and the length-age key estimated by Rocha-Olivares (1998). Total mortality (Z) was estimated by fitting the exponential decay model to the descending limb of the age-structure. Natural mortality (M) was calculated by the methods of Pauly (1980), Ralston (1987) and Jensen (1997), and for further analysis, the median of these estimates was used. When it was needed, an environmental temperature of 17°C (Lavín et al., 1997) was used. Fishing mortality (F) was calculated by subtracting M from Z. Catch records for 1978-1982 were obtained from official annual fishing statistics for the study area. Catch records for 1983-2000 were obtained from the landing records fishermen deliver at fisheries offices in their locality.
Age-structure reconstruction
The catch number per age group in a given year was estimated using the age-length key, the growth parameters and the length-weight relationship. Thereafter, population abundance at each age was estimated using the catch equation:

where Ca is the number of fish caught at age a, Na is the number of fish at age a, F is the fishing mortality rate, and M is the natural mortality rate. This routine was done for the historical catch series, assuming a stable age structure in the population. Fine-tuning was done by fitting the exponential decay model to each cohort present in the time series. The age structure with the highest estimated abundance is hereafter referred to as the initial age structure (IAS) and it was used as an input for the simulation model described below.
Recruitment parameters
With the reconstructed age structure in the historical series, the Beverton and Holt recruitment model was fitted as follows:
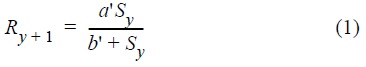
where Ry+1 is the number of recruits at age 1 in year y+1, Sy is the number of adults in year y, a' is the maximum number of recruits, and b' is the number of adults needed to reach a'/2 recruits. Parameters a' and b' were simultaneously fitted by the Newton iteration method using the minimum squares criterion and the restriction loge a'/b' = 1.9 (Myers et al., 1999).
Total costs and income
Direct field inquiries were made during 1999 at different fishing camps to estimate the number of fishing trips, first-sale price and average cost per trip. Total income from first-sale at beach was obtained from the local landing records of that year.
Simulation analysis
The following exponential decay model was used:

where Na,y is the number of fish at age a at the beginning of year y; Na+1, y+1 is the number of fish in the cohort that survived to the next year; f is the juvenile by-catch mortality rate; Fy is the fishing mortality rate during year y; M is the natural mortality rate; and sa and Sa are switches that allowed f and Fy to be applied to different age groups according to the following criteria: sa = 1 when a < tm, otherwise sa = 0; Sa = 0 when a < tc, otherwise Sa = 1. Recruits for a given year were calculated by equation 1 and its fitted parameters. To start the model, IAS was taken as an input and seed values were assigned to mortality rates f and Fy' and thereafter the catch number was calculated by:

where Ca,y is the number of fish at age a caught in year y. Then the simulated annual yield was estimated by:

where YSIM a,y is the simulated yield for year y, wa is the average individual weight at age a, tc is the age at first capture, and k is the maximum age in the population.
The abundance of each cohort was fitted year by year, varying Fy in equation 2 until the simulated yield matched the recorded yield, that is, YSIM,y = YREC,y. Since this condition was fulfilled with different values of f, the maximum juvenile mortality (fmax) that the simulated population could withstand to resemble the 1978-2000 historical catch series was evaluated. Thus, the simulation model was calibrated by fitting the values of Fy with f = 0.5fmax.
The benefit-cost (B/C) ratio was based on the equations:
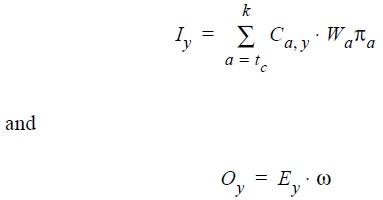
where Iy is the total income from first-sales at beach in year y; tc, k, Ca,y and wa are the same variables as in equation 3; na is the price per kilogram at age a; Oy is the total cost of the fishing trips in year y; Ey is the estimated number of trips in year y; and ω is the average cost of a fishing trip. With effort and fishing mortality data from 1999, the catchability coefficient q was calculated considering that F = qE → q = F/E. The catchability estimated in this way was assumed constant for estimating total costs in other years. The B/C ratio was analyzed over time assuming constant prices.
Reference points
To estimate equilibrium conditions, the model was run keeping F and f constant until population abundance stabilized. This routine was repeated for f = 0 and f = 0.5 fmax combined with 0 ≤ F ≤ 2. Three equilibrium points of interest were identified: (1) maximum sustainable yield (MSY), (2) maximum economic yield (MEY), and (3) economic equilibrium yield (EEY).
Simulation scenarios
Four scenarios were tested by combining two F-levels with two f-levels. Each level was chosen to represent different management situations. At level F = FEEY, the artisanal fleet is considered unregulated and the fishery tends toward its economic equilibrium level. At level F = FCUR, fishing effort is prevented from increasing, so F is kept as estimated for 2000. At level f = 0.5fmax, the shrimp fleet is still by-catching juveniles in the fishing area. At level f = fnull juvenile by-catch is considered completely prevented. For each scenario, 600 simulations for 100 years were run, leaving the model parameters to vary within their 95% confidence limits assuming a uniform distribution. The model outputs analyzed were: annual yield, B/C ratio, stock biomass, and harvest rate. The confidence limits for the outputs were calculated by the equation:

where  is the simulated average of the output,
  is the standard error of , and zα is the tabulated 100 α percentile (Efron and Tibshirani, 1986).
Results
Basicparameters
The length interval observed in commercial catches was 10-99 cm TL, which represents a range of 1.5 to 31 years. Age groups 1 and 2 are not fully recruited to the fishery, and organisms older than 20 years represent less than 0.5% of the population (fig. 3a). Accumulated length frequency of adults showed that the length at first maturity is 33 cm TL (fig. 3b), corresponding to 3.4 years. For the simulation analysis, we considered tm = tc = 3 years and the maximum age was 20 years. No additional groups were considered for simulation analysis.

The age structure showed two different slopes, with the steeper one between 3 and 7 years (fig. 3a). Because M was assumed constant, changes in slope were attributed to F, meaning that younger individuals from the exploitable stock are subject to greater fishing pressure than the older ones. Since the ratio F3-7/F>7 = 0.36, the difference was considered in the simulation model, assigning Sa = 0.36 in equation 2 when a > 7 years.
According to the field inquiries, 140 boats in the study area exploit Pacific red snapper. During the fishing season (April to November), each boat makes one fishing trip per day on average; thus we estimated that between 21,000 and 28,000 fishing trips were made in 1999. Field inquiries also showed that the average cost per trip is US$37 (ranging from US$16 to US$74), and that the first-sale price at beach, depending on size, is US$2.32 per kilogram for small individuals (0.35-1 kg) and US$1.27 per kilogram for larger individuals. The rest of the fitted parameters are shown in table 1.
Calibration of the simulation model
Based on the basic parameters, the historical yield series (1978-2000) could only be simulated within the interval 0 ≤; f ≤ 0.45. Therefore, the simulation model was calibrated with f = 0.5fmax = 0.225 yr-1 and the fishing mortality estimated for the year 2000 was used in the simulation scenarios as FCUR = 0.177 yr-1 (fig. 4).

Reference points
The equilibrium simulations showed that, whenever the juvenile by-catch mortality increases from fnull to 0.5fmax, the reference points MEY, MSY and EEY decrease by 45% and are reached with a lower fishing mortality rate (fig. 4). Therefore, the economic equilibrium scenarios were run with FEEY = 0.227 yr-1 when f = fnull and FEEY = 0.406 yr-1 when f=0.5 fmax.
The model fitted to the historical series showed that the yields in 1978-2000 were directly related to fishing mortality. Most of the yield recorded was ≤ 320 t yr-1, just between the equilibrium curves estimated by the model. Yields >375 t yr-1 were recorded in 1980, 1982, 1996 and 1998, above the equilibrium curves and should be interpreted as extraordinary events (fig. 4).
Simulation analysis
When f = 0.5fmax, the simulation analysis showed that the fishery behaves very similar at two tested F-levels. Average simulated yield remained similar to the historical series (P < 0.05), while the B/C ratio and stock biomass tended to decrease (fig. 5). When f = fnull, the fishery behavior differed depending on the F-level. If fishing mortality is allowed to reach F = FEEY, the average yield could double in the short term; however, in the long term the B/C ratio and biomass are significantly reduced (P < 0.05), while the harvest rate significantly increases to 20-25% of the total biomass (P < 0.05). If fishing mortality is kept at F = FCUR, the status of the fishery improves because the average yield significantly increases by 50% (P < 0.05). The B/C ratio and the stock biomass also tend to increase by 20-30%, although the increment is not statistically significant (P > 0.05).
Discussion
Although artisanal fisheries have been recognized worldwide as an important source of food and employment, most of them lack specific monitoring programs and operate without specific regulations and management programs (Ralston and Polovina, 1982). Because basic information is seldom available for applying conventional assessment methods, it is of paramount importance to explore alternative strategies of analysis in this kind of fisheries. In this sense, the analysis developed in this study represents an alternative to overcome the sparse information problem because the simulation model integrates available biological information (Allen, 1987; Reyna-Trujillo, 1993; Rocha-Olivares and Gómez-Muñoz, 1993; Díaz-Uribe, 1994; Rocha-Olivares, 1998), life-history constants (Pauly, 1980; Ralston, 1987; Myers et al., 1997, 1999; Jensen, 1997), and auxiliary information about the fishing operation (CES-UABCS, 2000). This approach allowed us to rebuild historical age-structure of the stock and to assess its population dynamics under different exploitation scenarios, which cannot be tested in the field.
Most assumptions used for the reconstruction of the age structure are the same as those used in Virtual Population Analysis (VPA), that is, there are no live individuals older than the maximum age, natural mortality rate is known, and there is no net immigration or emigration. Problems and implications derived from these assumptions have been thoroughly discussed in classic literature (Hilborn and Walters, 1992; Sparre and Venema, 1997; Haddon, 2001). An additional assumption in this work is that the fishery started in the year first recorded. This implies that the population abundance in that year was maximum or at least higher than it could be under exploitation pressure. Thus, selection of IAS for calibrating the simulation model was based on the most abundant age structure. Although it is known that the Pacific red snapper fishery started before 1978, there is evidence of a very low exploitation level in that period. During and before the 1970s, sharks dominated the landings of the artisanal fleets. In that decade, there was also a transition from wind-propelled boats to outboard-motorized boats; hence, before 1978, the deep fishing grounds where Pacific red snapper are caught, were inaccessible to artisanal fleets.
Another assumption in the analysis refers to the initial slope in the recruitment model. For the simulation model, it was established that loge a'/b' = 1.9, whose value was originally estimated for the northern red snapper Lutjanus campechanus (Myers et al., 1999). This slope represents the maximum recruitment rate (αmax) when population density is low. This is probably one of the most important population parameters because it is intimately related to the population growth rate (r) and extinction probability, and is frequently used to establish biological reference points for fisheries management (Mace, 1994; Cook et al., 1997; Myers et al., 1997). To estimate this parameter, however, recruitment level should be measured when the stock is at very low abundance, which poses a paradoxical situation (Hilborn and Walters, 1992). Recently, Myers et al. (1999) demonstrated that αmax is relatively constant between species in the same family; thus, without enough information, as in the case of L. peru, the value of αmax for a related species can be useful to improve the performance of simulation analysis. When this value was not considered in the fit of the recruitment model, the maximum recruitment (a') estimated was three-fold higher, and the simulated historical series resulted in growing population abundance during the exploitation phase. For a supposed virgin stock at the beginning of the historical series, this situation is contradictory, so the restriction used for αmax was considered reasonable and consistent.
According to the calibrated model, catch volumes >320 t yr-1 are related to greater fishing intensity. Since M and q were considered constant, these captures could only be explained by an explosive increment in fishing effort (fig. 4). Although there is no precise record of the fishing effort in the area, national statistics do not show large oscillations in the growth of artisanal fleets (SEMARNAP, 2000b). An alternative explanation is that the highest catches could be related to environmental conditions, since they coincided with the El Niño events of 1982/83 and 1997/98 (SEMARNAP, 2000a). This suggests that the highest catches are possibly the result of higher resource availability. Although the available information on L. peru does not allow an explanation about its relation to the environment (Allen, 1987; Gutiérrez-Vargas, 1990; Reyna-Trujillo, 1993; Rocha-Olivares and Gómez-Muñoz, 1993; Díaz-Uribe, 1994; Cruz-Romero et al., 1996; Rocha-Olivares, 1998; Santamaría and Chávez, 1999; Del Monte-Luna et al., 2001), catches >320 t yr-1 in this part of the Gulf of California should be considered an extraordinary event rather than a potential level of production.
Compared with other stocks, Pacific red snapper from the southwestern Gulf of California has a relatively low exploitation rate (table 2). Nevertheless, we suspect that the fishery tends to reach the economic equilibrium point (F→FEEY), since the artisanal fleet thus far operates under an open access scheme without specific regulations. On the other hand, although the use of trawling nets inside La Paz Bay was recently banned (Diario Oficial de la Federación, October 30, 2002), this measure does not include La Ventana Bay, an important reproductive area for Pacific red snapper (Reyna-Trujillo, 1993). Therefore, the by-catch mortality of juveniles has not been totally eliminated from the region. According to the simulation model, under this scenario, the fishery tends to reach MSY or even surpass it. Considering that MSY is no longer regarded as an optimum reference point but a reference limit beyond which the persistence of the population is at risk (Caddy and Mahon, 1996), it is recommended that management measures for the Pacific red snapper fishery in this region be undertaken.
The only possibility for the fishery to develop is to simulta-neously regulate the artisanal and shrimp fleets. The problem with this measure is that yield increase would likely not be significantly reflected in the B/C ratio or stock abundance (fig. 5). An alternative would be to raise the age of first catch to 4 years (fig. 6). This alternative would imply three concrete management measures: (1) prevent more boats from catching Pacific red snapper in this region, (2) extend restriction on the use of trawling nets to include La Ventana Bay, and (3) modify the selectivity of fishing gear to capture fish larger than 37 cm instead of 30 cm TL. These measures could produce several application and control problems, but there are three aspects that, in some way, facilitate their application: (1) restricting the growth of the artisanal fleet does not imply limitations for established fishermen to continue fishing; (2) regional fisheries committees have recently been formed in BCS through which a more direct communication with local fishermen can be established; and (3) perhaps the most important, the status of the fishery seems to be at a level that allows preventive management measures to be undertaken, which in turn, allows a wider margin of negotiation with stakeholders than if restrictive and population recovery measurements were to be taken.

Acknowledgements
The 1989-1991 samples were obtained from the study "Biología de peces de importancia comercial en la bahía de La Paz y zonas adyacentes", financed by DGICSA-SEP (grants C89-01-0191 and C90-01-0406 to Juan F. Elorduy-Garay). Yield records and fleet operation data came from the study "Diseño de propuestas de co-manejo para pesquerías ribereñas del Golfo de California, en condiciones de sustentabilidad: División BCS", funded by grants from the World Wildlife Fund and Conservation International México to Hernán Ramírez-Aguirre. During the survey, J. Gabriel Díaz-Uribe held a fellowship from the Consejo Nacional de Ciencia y Tecnología for doctoral studies at Centro de Investigaciones Biológicas del Noroeste (CIBNOR). Ernesto A. Chávez and Juan F. Elorduy-Garay received fellowships from the Comisión para el Fomento de Actividades Académicas and Estímulo al Desempeño de Investigación, from the Instituto Politécnico Nacional. We thank Miguel Ángel Cisneros-Mata, Sergio Hernández-Vázquez, Daniel Lluch-Belda, Juana López-Martínez, and anonymous reviewers for their comments and suggestions that helped to improve the manuscript. We also thank the editorial staff at CIBNOR for revising the English manuscript.
References
Allen, G.R. (1987). Synopsis of the circumtropical fish genus Lutjanus (Lutjanidae). In: J.J. Polovina and S. Ralston (eds.), Tropical Snappers and Groupers: Biology and Fisheries Management. Westview Press, New York, pp. 33-87. [ Links ]
Caddy, J.F. y Mahon, R. (1996). Puntos de referencia para la ordenación pesquera. FAO, Documento Técnico de Pesca, 347 pp. [ Links ]
CES-UABCS. (2000). Diseño de Propuestas de Co-manejo para Pesquerías Ribereñas del Golfo de California en Condiciones de Sustentabilidad. Reporte Técnico. Centro de Estudios Sustentables. Universidad Autónoma de Baja California Sur. La Paz, BCS, México. [ Links ]
Cook, R.M., Sinclair, A. and Stefansson, G. (1997). Potential collapse of North Sea cod stocks. Nature, 358: 521-522. [ Links ]
Cruz-Romero, M., Chávez, E.A., Espino, E. and García, A. (1996). Assessment of a snapper complex (Lutjanus spp.) of the Eastern Tropical Pacific. In: F. Arreguín-Sánchez, J.L. Munro, M.C. Balgos and D. Pauly (eds.), Biology, Fisheries and Culture of Tropical Groupers and Snappers. ICLARM Conf. Proc. 48, pp. 324-330. [ Links ]
Del Monte-Luna, P., Guzmán-Jiménez, G., Moncayo-Estrada, R., Sánchez-González, S. y Ayala-Cortés, A. (2001). Máximo rendimiento sostenible y esfuerzo óptimo de pesca del huachinango (Lutjanus peru) en la Cruz de Huanacaxtle, Nayarit, México. Cienc. Pesq., (14): 159-164. [ Links ]
Díaz-Uribe, J.G. (1994). Análisis trofodinámico del huachinango (Lutjanus peru) en las bahías de La Paz y La Ventana, BCS. México. Tesis de maestría, Centro de Investigación Científica y de Educación Superior de Ensenada, México. [ Links ]
Efron, B. and R. Tibshirani. (1986). Bootstrap methods for standard errors, confidence intervals, and other measures of statistical accuracy. Stat. Sci., 1: 54-75. [ Links ]
Gutiérrez-Vargas, R. (1990). Tasas de crecimiento, mortalidad, reclutamiento, rendimiento y biomasa relativos por recluta de Lutjanus peru (Persiformes: Lutjanidae) en el Pacífico Noroeste de Costa Rica. Rev. Biol.. Trop., 38(2B): 441-447. [ Links ]
Haddon, M. (2001). Modelling and Quantitative Methods in Fisheries. Chapman and Hall, Boca Raton, Florida, 406 pp. [ Links ]
Hilborn, R. and Walters, C.J. (1992). Quantitative Fisheries Stock Assessment: Choice, Dynamics and Uncertainty. Chapman and Hall, New York, 570 pp. [ Links ]
INP (2001). Sustentabilidad y Pesca Responsable en México: Evaluación y Manejo. Instituto Nacional de la Pesca (INP). Secretaría de Agricultura, Ganadería, Desarrollo Rural, Pesca y Alimentación, México, 1111 pp. [ Links ]
Jensen, A.L. (1997). Origin of the relation between K and Linf and synthesis of relations among life history parameters. Can. J. Fish. Aquat. Sci., 54: 987-989. [ Links ]
Lavín, M.F., Beier, E. y Badán, A. (1997). Estructura hidrográfica y circulación del Golfo de California: Escalas estacional e interanual. En: M.F. Lavín (ed.), Contribuciones a la Oceanografía Física en México. Unión Geofísica Mexicana, Monografía 3, pp. 141-171. [ Links ]
Mace, P.M. (1994). Relationships between common biological reference points used as threshold and targets of fisheries management strategies. Can. J. Fish. Aquat. Sci., 51: 110-122. [ Links ]
Myers, R.A., Mertz, J. and Fowlow, S. (1997). Maximum population growth rates and recovery times of Atlantic cod, Gadus morhua. Fish. Bull., 95: 762-772. [ Links ]
Myers, R.A., Bowen, K.G. and Barrowman, N.J.. (1999). Maximum reproductive rate of fish a1 low population sizes. Can. J. Fish. Aquat. Sci., 56: 2404-2419. [ Links ]
Pauly, D. (1980). On the interrelationships between natural mortality, growth parameters and mean environmental temperature in 175 fish stocks. J. Cons. Int. Explor. Mer., 39: 175-192. [ Links ]
Pérez-Mellado, J. y Findley, L.T. (1985). Evaluación de la ictiofauna acompañante del camarón capturado en las costas de Sonora y norte de Sinaloa, México. En: A. Yáñez-Arancibia (ed.), Recursos Pesqueros Potenciales de México: La Pesca Acompañante del Camarón. Programa Universitario de Alimentos, Instituto de Ciencias del Mar y Limnología, UNAM. Instituto Nacional de la Pesca, pp. 201-254. [ Links ]
Ralston, S. (1987). Mortality rates of snappers and groupers. In: J.J. Polovina and S. Ralston (eds.), Tropical Snappers and Groupers: Biology and Fisheries Management. Westview Press, New York, pp. 375-403. [ Links ]
Ralston, S. and Polovina, J.J. (1982). A multispecies analysis of the commercial deep-sea handline fishery in Hawaii. Fish. Bull., 80(3): 435-448. [ Links ]
Reyna-Trujillo, M.M. (1993). Desarrollo gonádico y época de desove del huachinango (Lutjanus peru) Nichols y Murphy, 1922 (Pisces: Lutjanidae) en la Bahía de La Paz, Baja California Sur, México. Tesis de licenciatura, Universidad de Guadalajara, México. [ Links ]
Rocha-Olivares, A. (1991). Edad y crecimiento del huachinango del Pacífico Lutjanus peru (Nichols y Murphy, 1922) (Perciformes: Lutjanidae) en la Bahía de La Paz y zonas adyacentes, BCS, México. Tesis de licenciatura, Universidad Autónoma de Baja California Sur, México, 121 pp. [ Links ]
Rocha-Olivares, A. (1998). Age, growth, mortality and population characteristics of the Pacific red snapper, Lutjanus peru, off the southeast coast of Baja California, Mexico. Fish. Bull., 96: 562-574. [ Links ]
Rocha-Olivares, A. y Gómez-Muñoz, V.M. (1993). Validación del uso de otolitos para determinar la edad del huachinango del Pacífico Lutjanus peru (Perciformes: Lutjanidae), en la Bahía de La Paz y aguas adyacentes, BCS, México. Cienc. Mar., 19(3): 321-331. [ Links ]
Ross-Terrazas, M.J. (1988). Evaluación poblacional de dos especies de camarón que sostienen la pesquería de alta mar en el norte y centro del Golfo de California. Tesis de licenciatura, Universidad Autónoma de Baja California Sur, México, 70 pp. [ Links ]
Santamaría, A. y Chávez, E.A. (1999). Evaluación de la pesquería de Lutjanus peru (Pisces: Lutjanidae) de Guerrero, México. Rev. Biol. Trop., 47(3): 571-580. [ Links ]
SEMARNAP (2000a). La Gestión Ambiental en México. Secretaría de Medio Ambiente, Recursos Naturales y Pesca, México, 374 pp. [ Links ]
SEMARNAP (2000b). Anuario Estadístico de Pesca 1999. Secretaría de Medio Ambiente, Recursos Naturales y Pesca, México, 256 pp. [ Links ]
Sparre, P. y Venema, S.C. (1997). Introducción a la evaluación de recursos pesqueros tropicales. Parte 1: Manual. FAO Documento Técnico de Pesca, 306/1. [ Links ]

