


Serviços Personalizados
Journal
Artigo
 Inglês (pdf)
 Artigo em XML
 Referências do artigo
 Enviar este artigo por email
Indicadores
-
 Citado por SciELO
 -
 Acessos
Links relacionados
-
 Similares em
SciELO
Similares em
SciELO
Compartilhar

 Permalink
Ciencias marinas
versão impressa ISSN 0185-3880
Cienc. mar vol.30 no.1a Ensenada Fev. 2004
Artículos
Use of digital multispectral videography to assess seagrass distribution in San Quintín Bay, Baja California, Mexico
Uso de videografía multiespectral digital para evaluar la distribución del pasto marino en Bahía San Quintín, Baja California, México
David H. Ward1*, T. Lee Tibbitts1, Alexandra Morton2, Eduardo Carrera-González3 and Richard Kempka2
1 U. S. Geological Survey, Alaska Science Center. 1011 E, Tudor Rd. Anchorage, Alaska 99503, USA. *E-mail: david_ward@usgs.gov
2 National Headquarters, Ducks Unlimited Inc. One Waterfowl Way Memphis, Tennessee 38120-2351, USA.
3 Ducks Unlimited de Mexico. Ave. Vasconcelos 209 Ote. Residencial San Agustín Garza García CP 66260, Nuevo Leon, México.
Recibido en septiembre de 2002;
Aceptado en mayo de 2003.
Abstract
Apparent threats to the spatial distribution of seagrass in San Quintín Bay prompted us to make a detailed assessment of habitats in the bay. Six coastal habitats and three seagrass subclasses were delineated using airborne digital multispectral videography (DMSV). Eelgrass, Zostera marina, was the predominant seagrass and covered 40% (1949 ha) of the areal extent of the bay in 1999. Eelgrass grew over a wide range of tidal depths from about -3.0 m mean lower low water (MLLW) to about 1.0 m MLLW, but greatest spatial extent occurred in intertidal areas -0.6 m to 1.0 m MLLW. Exposed-continuous (i.e., high density) eelgrass was the most abundant habitat in the bay. Widgeongrass, Ruppia maritima, was the only other seagrass present and covered 3% (136 ha) of the areal extent of the entire bay. Widgeongrass grew in single species stands in the upper intertidal (≥ 0.4 MLLW) and intermixed with eelgrass at lower tidal depths. Overall accuracy of the six habitat classes and three subclasses in the DMSV map was relatively high at 84%. Our detailed map of San Quintín Bay can be used in future change detection analyses to monitor the health of seagrasses in the bay.
Key words: San Quintín Bay, airborne digital multispectral videography, seagrass distribution, Ruppia maritima, Zostera marina.
Resumen
Dada la existencia de aparentes amenazas para la distribución espacial del pasto marino, se llevó a cabo una evaluación detallada de los hábitats de Bahía San Quintín. Se delimitaron seis hábitats costeros y se identificaron tres subclases de pasto marino usando videografía multiespectral digital (DMSV) aérea. El pasto Zostera marina fue el predominante, cubriendo en 1999 el 40% (1949 ha) de la extensión superficial de la bahía. Zostera marina crecía sobre un amplio rango de profundidades de marea desde -3.0 m del nivel medio inferior de bajamar (MLLW) hasta cerca de 1.0 m del MLLW, pero su mayor extensión superficial ocurrió en la zona entre mareas de -0.6 m a 1.0 m MLLW. De todos los hábitats de la bahía, los mantos continuos (i.e. de gran densidad) de Z. marina expuesta fueron los más abundantes. El único otro pasto marino presente fue Ruppia maritima, que cubría el 3% (136 ha) de la extensión superficial total de la bahía. Este pasto se encontraba creciendo en mantos monoespecíficos en la intermareal superior (≥ 0.4 MLLW), e intercalado con Z. marina a bajas profundidades de marea. La precisión global de las 6 clases de hábitat y de las 3 subclases en el mapa de DMSV fue relativamente alta en un 84%. El mapa detallado obtenido para Bahía San Quintín puede ser utilizado para detectar cambios futuros y dar seguimiento al estado de salud de los pastos marinos en la bahía.
Palabras clave: Bahía San Quintín, videografía multiespectral digital, distribución de pastos marinos, Ruppia maritima, Zostera marina.
Introduction
Embayments in Baja California are coming under increasing pressure from commercial and residential development (Ibarra-Obando and Escofet, 1987; Fermán-Almada et al., 2000; Aguirre-Muñoz et al., 2001). Anthropogenic changes to the coastal environment, especially those that affect water transparency, such as eutrophication and siltation, have been linked to reductions of seagrasses worldwide (Short and Wyllie-Echeverria, 1996; Hemmiga and Duarte, 2000). Losses have been reported for coastal areas of Europe (den Hartog and Polderman, 1975), southeast Asia (Fortes, 1988), Australia (Preen et al., 1995), and North America (Orth and Moore, 1983; Short and Burdick, 1996). Alterations to seagrass distribution and cover can, in turn, directly impact population status and distribution of associated marine organisms, including fish (Hobjoy et al., 1999; Matheson et al., 1999), waterbirds (Wilson and Atkinson, 1995), and marine mammals (Preen and Marsh, 1995).
The global scale of seagrass decline has highlighted the need to inventory and monitor these valuable natural resources. Local and regional assessments of seagrass spatial distribution and abundance can be used to focus conservation and management efforts. Spatial assessments can also enhance coastal research projects; for example, data can be used to evaluate the carrying capacity of seagrass beds for resident and migratory fauna, such as salmon (Simenstad and Cordell, 2000) and geese (Wilson and Atkinson, 1995), and serve as reference data for predictive spatial models (Camacho-Ibar et al., 2003). Programs that promote the use of standardized methods to assess cover and habitat changes in seagrass beds (e.g., Dobson et al., 1995; SeagrassNet, http://www.seagrassnet.org) have recently been established. Nevertheless, for many places in the world, including Mexico, no comprehensive monitoring effort exists that specifically targets seagrasses.
Although traditionally assessed through ground surveys, seagrass distribution is now commonly mapped using remote sensing techniques, such as aerial photography (Ferguson et al., 1993; Sheppard et al., 1995), airborne digital multispectral sensors (Mumby et al., 1997a, b), and satellite imagery (Ferguson and Korfmacher, 1997; Ward et al., 1997; Ward et al., 2003). Maps made from aerial photographs and digital multispectral data are considered better for monitoring spatial extent of seagrass meadows than maps from satellite images, because the former resolve data at higher spatial resolutions (1-3 m vs 10-30 m, respectively) allowing for more precise estimates (Dobson et al., 1995; Mumby et al., 1997a, b). High-resolution seagrass assessments can also be made with underwater sensors, such as side-scan hydroacoustics (McRoy and Bridges, 1998) and videography, but these sensors are usually cost-effective for small scale projects only (e.g., assessments around piers or docks) (Norris et al., 1997).
As part of a regional program to develop a data base of biological information on the coastal embayments of Baja California (Palacios, 2000), we assessed the distribution of seagrasses in San Quintín Bay, an ecologically and economically important embayment (Massey and Palacios, 1994; Aguirre-Muñoz et al., 2001; Perez-Arteaga et al., 2002) situated on the Pacific coast of the Baja California Peninsula. Ward et al. (2003) conducted a change detection analysis of habitats in this bay between 1987 and 2000 using satellite imagery and found that seagrass extent had declined during this period, but this analysis was made at a relatively coarse-scale (20-25 m resolution) and did not differentiate between seagrass species. Our approach in this current study was to develop a more detailed baseline map of seagrass extent for San Quintín Bay that can be used to monitor future changes in this valuable habitat at a finer scale. Accordingly, we used airborne digital multispectral videography (DMSV) to assess spatial distribution of seagrasses and other habitats in San Quintín Bay.
Material and methods
Study area
San Quintín Bay (30°25' N, 116°00' W) is a 49-km2, hyper-saline embayment consisting of one permanent entrance and two sub-basins, locally know as Falsa Bay and San Quintín Bay and referred to in this paper as west bay and east bay, respectively (fig. 1). San Quintín Bay is characterized by extensive intertidal flats, shallow subtidal shoals, and narrow tidal channels. Tides are mixed semidiurnal with a maximum range of 2.0 m (Barnard, 1962). The climate is Mediterranean, with mean annual daily air and water temperatures ranging from 11°C to 22°C and 15°C to 22°C, respectively (Cabello-Pasini et al., 2003). The bay receives little freshwater influence either from rainfall, averaging about 15 cm yr-1, or from ground water drainage of the 2000-km2-wide San Simón River watershed (Ibarra-Obando et al., 2001). Nutrient dynamics of this bay are driven primarily by a coastal upwelling system (Camacho-Ibar et al., 2003).
The seagrass meadows in San Quintín Bay are composed of unispecific and mixed stands of eelgrass, Zostera marina L., and widgeongrass, Ruppia maritima L. In general, eelgrass, the dominant seagrass in the bay, occurs in the low intertidal, whereas widgeongrass is found in the high intertidal. Macro-algae, primarily Ulva spp. and Enteromorpha spp., occur throughout the bay but are generally found intermixed in eelgrass meadows. Cordgrass (Spartina foliosa), salt-wort (Batis maritima), pickleweed (Salicornia spp.), and sea-blite (Sueda spp.) are the predominant salt marsh vegetation, and adjacent upland habitats are covered mostly by agricultural fields and coastal sage shrub vegetation (Wiggins, 1980; Aguirre-Muñoz et al., 2001). A few small-scale motels, trailer parks, and private residences are located along the northern shores of the east bay, and a small fishing village (<25 residences) and three oyster processing facilities with several outbuildings are located along the shores of the west bay.
Data collection
We acquired DMSV of San Quintín Bay on 15 January 1999 following standard photographic procedures for seagrass mapping (Dobson et al., 1995) and using a four-camera system (SpecTerra Systems, Ltd., Mark 1) mounted to the belly of a Partenavia twin-engine aircraft. Each video camera was fitted with a different wavelength color filter (i.e., 450, 550, 650, or 750 nm) to optimize spectral delineation of seagrasses above and below the water surface. The aircraft maintained an altitude of 3000 m and flew 15 flight lines to cover the bay. The tide was low (-0.2 m mean lower low water [MLLW]) and winds were light (<10 km/h) during the image acquisition period (1.6 h). Although acquisition occured about three months after maximum aboveground biomass for eelgrass in this bay (Poumián-Tapia and Ibarra-Obando, 1999), this probably did not negatively bias assessments of seagrass cover and distribution because the data were obtained during an extreme low tide period with good water clarity for detecting seagrasses. Moreover, while shoot area decreases between October and January at San Quintín Bay, shoot density remains constant over this period (Cabello-Pasini et al., 2003), thus minimizing seasonal differences in seagrass cover.
Approximately 85 overlapping frames were joined together using corresponding tie-points in each four-banded raster image. The mosaic routine incorporated a simple model to adjust scene scale and position while maintaining overall spatial continuity. To minimize distortion in the final mosaicked image, the bay was partitioned into four quadrants and each quadrant was geo-referenced independently to a 1:22,000 scale base map (see below) using an array of differentially-corrected global positioning satellite (DGPS) ground control points positioned around the entire bay. The final mosaicked image was rectified to an UTM (Universal Transverse Mercator) projection and WGS-84 datum (1984 World Geodetic System) with a 2-m pixel resolution. Spatial accuracy of the image was <10 m and within mapping accuracy standards for submerged vegetation (Dobson et al., 1995).
No accurate reference map existed for San Quintín Bay to guide the mosaicking of the digital images; therefore, we created a base map of the bay from color aerial photographs. The photographs were taken from a twin-engine aircraft specially equipped for large format, vertical photography and obtained from 770 m altitude during a low tide (0.1 m MLLW) on16 January 2000. The photographs were edge-matched together and geo-rectified using nearly 100 DGPS ground control points and a 1999 Indian Remote Satellite image (20-m resolution) as a backdrop. In addition to the base map, the color photographs also provided habitat information about a few small areas (<25 ha in total) in the DMSV coverage that had either been missed during the initial videography (e.g., salt marsh along the coast of the east bay) or were affected by geometric distortions caused by aircraft motion.
We classified the four-banded DMSV data using unsupervised image classifications techniques (Swain and Davis, 1978) and an isodata clustering algorithm to identify statistically separable spectral classes. We assigned each pixel to a spectral class using a maximum likelihood classifier. We subsequently evaluated all spectral classifications based on our knowledge of the area, review of the color photographs, and validation from ground samples. Grid cells were then assigned to one of six classes: channel (i.e., submerged unvegetated), eelgrass (>90% of seagrass in each grid cell was eelgrass), widgeongrass (>90% of seagrass in each grid cell was widgeongrass), mixed seagrasses (either species constituted >10% of the seagrass present in each grid cell), mudflat (i.e., exposed unvegetated), or salt marsh. Eelgrass stands were further divided into three subclasses based on the spectral characteristics of the habitat relative to the height of the tide (covered or not covered by water) and shoot density (percent cover) following Ward et al. (2003). The three subclasses were: (1) exposed-continuous, defined as eelgrass with ≥ 50% cover that occurred at or above the water surface (i.e., ≥ -0.2 m MLLW); (2) exposed-patchy, defined as eelgrass with <50% cover that occurred at or above the water surface; and (3) submerged, defined as eelgrass of any shoot density that occurred below the water surface (i.e., < -0.2 m MLLW). The relative shallowness of submerged seagrass beds at San Quintín Bay allowed us to easily define the deep edge of all beds in the DMSV imagery.
We did not classify the dominant macroalgae, Ulva and Enteromorpha, because these macroalgae commonly occurred within eelgrass meadows where they could not be differentiated spatially or spectrally from eelgrass. In most cases, mats of Ulva and Enteromorpha formed on the substrate at the base of eelgrass shoots and were generally undetectable when viewed from above. It was also problematic to classify pure macroalgae mats because this spectral signature could not be verified with ground points (see below); macroalgae mats moved unknown distances via tidal currents, wind, and waves over the two- to six-month period between image acquisition and ground-truthing.
We verified class and subclass distinctions by visiting numerous field collection sites that were spread across the full spectrum of vegetational and physiographic conditions that existed in the bay. We made these ground truth assessments at 175 points in November and July 2000, and at 50 points in January 2002. At each point, we collected information on percent cover of each habitat class, average length and width of leaves of each seagrass species, and water depth.
We measured the accuracy of our habitat assessments using standard methods (Congalton, 1991). To gauge the accuracy of the enhanced DMSV classified map we used 275 independent points to calculate percent correct, errors of commission, and the Kappa statistic. Percent correct is simply the ratio of numbers of grid cells that were correctly classified by the total number of grid cells examined. Error of commission is a measure of the capability of the mapping technique to correctly identify areas where a habitat class is present; thus, an error of commission would occur when the DMSV classified image predicted that a habitat class was present at a site but the class was not observed at the site. We calculated error of commission by dividing the number of correctly classified grid cells in a reference set by the predicted number of grid cells in that set. Values of 100% for each test represent perfect agreement between what the spectral data predict and what is present on the ground. The Kappa statistic is a measure of accuracy that incorporates the possibility of random chance agreements (Congalton, 1991); it ranges between -1 and 1 and a value of 1 means that there is 100% agreement between the classified map and the validation points. We determined the amount (hectares) of each habitat class using GIS software ARC/INFO.
Results
Seagrass, primarily eelgrass, was the most abundant habitat type in San Quintín Bay, comprising 46% (2220 ha) of the areal extent of bay in 1999 (table 1; fig. 1). Eelgrass grew over a wide range of tidal depths from about -3.0 m MLLW to about 1.0 m MLLW, but greatest extent occurred in intertidal areas at or above -0.1 m MLLW. Stands of eelgrass with continuous cover (>50%) dominated both the intertidal and subtidal areas of the bay and, overall, exposed-continuous eelgrass was the most abundant seagrass subclass in the bay.
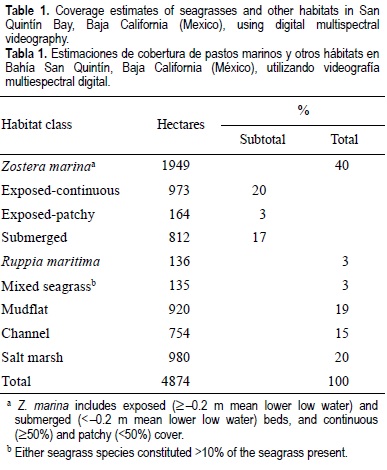
Slightly more eelgrass (55%) was located in the east bay, particularly in the northern portion and adjacent to the river delta (fig. 1). Widgeongrass covered 3% (136 ha) of the areal extent of the entire bay and comprised about 6% of the total coverage of seagrasses (table 1; fig. 1). Small patches of low density widgeongrass were scattered throughout the bay, most commonly between 0.4 and 0.7 m MLLW. Below about 0.4 m, widgeongrass grew sporadically and usually intermixed with eelgrass. Largest and densest stands of widgeongrass were situated in the east bay adjacent to the San Simón River delta (fig. 1). Most of the mixed seagrass beds (3% of total area, 135 ha) grew in three distinct stands; the largest stand was located in the west bay directly north of the bay entrance and the two smaller stands were in the east bay adjacent to the channel near the San Simón River delta. Mixed stands were located primarily in the intertidal, between 0.3 and 0.0 m MLLW. The largest mixed stand was composed mainly of eelgrass, whereas the two smaller ones were dominated by widgeongrass.
Salt marshes (20%, 980 ha) and mudflats (19%, 920 ha) were the next most abundant habitats in the bay (table 1). The largest salt marshes occurred along the extreme northern and southern margins of the bay, and the most expansive mudflats were associated with the river delta and entrance of the bay (fig. 1). Salt marshes dominated by pickleweed and cordgrass comprised about 66% (651 ha) and 9% (89 ha) of this habitat type, respectively. Channels covered 15% of the bay during the -0.2 m low tide (table 1; fig. 1).
Overall, the accuracy of the DMSV classified map was high; 84% of the 275 control points were correctly classified and the Kappa statistic was 81%, indicating that there was high map representation of the six habitat classes and the three subclasses of eelgrass. Errors of commission ranged from 50% to 91%. Fewest errors of commission occurred when classifying the exposed-continuous eelgrass areas (91%, 55 points), channels (90%, 52 points), submerged eelgrass (89%, 83 points), and mudflats (81%, 38 points), while most errors occurred in pure widgeongrass areas (69%, 14 points), mixed seagrass areas (50%, 12 points), and exposed-patchy eelgrass areas (71%, 21 points). Habitat classification was particularly problematic when distinguishing between widgeongrass and mudflats (50% of the commission errors), exposed-patchy and exposed-continuous eelgrass (33% of errors), and exposed-patchy eelgrass and mudflats (50% of errors). When seagrass habitat types were collapsed into one seagrass class and no subclasses, the overall accuracy of the DMSV classified map increased to 89% and error of commission for seagrass areas to 91%, indicating that DMSV was more accurate at a coarser scale of classification.
Discussion
DMSV was an effective technique for conducting a detailed assessment of seagrasses in San Quintín Bay. Using digital data, we were able to delineate six coastal habitats (including five seagrass classes and subclasses) at a fine scale (2-m resolution) with relatively high overall accuracy. This map provides the most finely discriminated estimates of intertidal and subtidal habitats for any embayment along the Pacific coast of Mexico and improves upon previous habitat maps of San Quintín Bay made using ground survey data in 1960 (Dawson, 1962) and 1974 (Kramer, 1976), and satellite imagery in 1994 (Landsat-5 Thematic Mapper: Ducks Unlimited de Mexico, unpublished data), 1987, and 2000 (Satellite Pour l'Observation de la Terre [SPOT] and Landsat-7 Enhanced Thematic Mapper Plus [ETM+], respectively: Ward et al., 2003). These other efforts are less comprehensive as they discriminate fewer habitat types and are delineated at coarser scales, but they are useful for giving a historical perspective of seagrass distribution in the bay.
To make our estimates of seagrass extent directly comparable to estimates from other studies of San Quintín Bay and elsewhere in the region, we lumped widgeongrass into the eel-grass class and retained the three eelgrass subclasses. After these manipulations we found that the overall accuracy of the DMSV map was slightly higher (87% vs 81%) than that of a similar map of San Quintín Bay (six coastal habitats, three sea-grass classes) that was created from a 2000 satellite image of the Landsat-7 ETM+ (Ward et al., 2003). The high accuracy of the DMSV map can be attributed to the quality of this airborne imagery and our use of color aerial photography and extensive ground surveys to assist with habitat delineations. Interpretation of the aerial photography was especially useful for determining habitat types in small portions of the digital image (primarily in the west bay) that were afflicted with spectral radiometric problems (i.e., brightness differences between flightlines) caused by scattered high clouds during the original scanning.
Other studies have indicated that seagrass biomass (and indirectly areal extent) in San Quintín Bay did not differ between winter 1999 and winter 2000 (Cabello-Pasini et al., 2003; S. Ibarra-Obando and M. Poumián-Tapia, unpublished data). Yet, the estimate of seagrass areal extent was 6% higher in 1999 using the DMSV (2220 ha: this study) than in 2000 using Landsat-7 ETM+ (2068 ha: Ward et al., 2003). We attribute this slight difference to the greater spatial resolution of the DMSV map and the capacity of this technique to detect smaller patches of seagrass that would be missed in the satellite image. In contrast, the 1999 DMSV estimate was lower than the earliest remote imagery assessment of seagrass extent in San Quintín Bay made in 1987 (2390 ha) using SPOT imagery (Ward et al., 2003), suggesting that a loss of seagrass cover has occurred in San Quintín Bay over the last 13 years. A similar loss was detected by Ward et al. (2003) during a spatial change detection analysis comparing the SPOT and Landsat-7 ETM+ imagery.
Eelgrass, particularly high density intertidal meadows, is the predominant habitat in San Quintín Bay. These meadows represent some of the most extensive stands of intertidal eelgrass in the region (Ward et al., 2003). The abundance of intertidal eelgrass at San Quintín Bay is a unique feature of this bay relative to other embayments in Mexico, where eelgrass grows primarily subtidally (Meling-López and Ibarra-Obando, 1999; Cabello-Pasini et al., 2003). It is also one of the major factors contributing to the use of this bay by a variety of waterbirds (Massey and Palacios, 1994), including nearly the entire Pacific flyway population of black brant, Branta bernicla nigricans (Reed et al., 1998; Conant and Voelzer, 2002). The bay's significance for wintering and migrating black brant has prompted a recommendation for its designation as a wetland of international importance under the Ramsar Convention (Perez-Arteaga et al., 2002).
While the predominance of eelgrass in San Quintín Bay has been well known since the 1950s (Dawson, 1951, 1962), the presence and distribution of widgeongrass in the bay is less well documented. In 1992, Delgadillo et al. (1992) reported low densities of high intertidal widgeongrass in the bay, and we first noted dense patches (>75% cover) of widgeongrass during the El Niño winter of 1997/1998. During this winter, widgeongrass grew in dense patches near the San Simón River delta and in sparse to moderately dense stands in the north end of the east bay and at the entrance to the west bay where none, or very low densities of this plant, had been observed in these areas in the previous 20 years (S. Ibarra-Obando and D. Ward, unpublished data). These same areas continued to support sparse to dense stands of widgeongrass in the winters of 1998/1999 and 1999/2000 based on interpretation of the DMSV (this study) and satellite (Ward et al., 2003) images. This apparent expansion of widgeongrass in San Quintín Bay may be in response to the rise in sea level (Cabanes et al., 2001) and sea-surface temperature (Zveryaev et al., 2000) that has occurred in this region, especially during the 1990s. Widgeongrass is an abundant intertidal seagrass in embayments south of San Quintín Bay along the Pacific coast of Baja California (S. Ibarra-Obando and D. Ward, unpublished data), where intertidal areas are more extensive and annual sea-surface temperatures are warmer than in this bay (Cabello-Pasini et al., 2003).
We found it difficult to reliably map the distribution of widgeongrass and mixed seagrass stands using the DMSV data alone (i.e., accuracy was about 30-40% without ground reference data). This is not unusual; researchers rarely use remote sensing techniques to distinguish between species of seagrass because of problems with spectral and spatial overlap (Mumby et al., 1997b). At San Quintín Bay, widgeongrass and mixed seagrass habitats comprised only a small portion (<13%) of the seagrass in the bay and primarily occurred at the interface between eelgrass stands and mudflats. The spectral signal of the mixed species stands was not entirely distinct from the signals of either eelgrass or widgeongrass alone, and the spectral signal of single species stands of widgeongrass was often indiscernible from the signal of mudflat areas. The latter problem occurred because this plant grew in low densities (averaging ~ 40% cover) and abundance (<10 gDW m-2) (D. Ward, unpublished data). We were able to circumvent these mapping problems by using the spectral data in combination with photo interpretation and ground surveys to attain reasonably good mapping accuracy for the widgeongrass (69%) and mixed seagrass (50%). The improved accuracy was possible because beds of widgeongrass and mixed seagrass occurred in isolated (i.e., fixed) locations in the bay and could be differentiated with ground points. Species differentiation using remote sensing techniques combined with ground surveys may not be possible in other embayments where there are more than two species and spectral and spatial overlap is highly variable. Estimating widgeongrass areal coverage was important in our study because this species appears to be expanding its distribution in San Quintín Bay and a baseline map depicting widgeongrass extent will likely be useful in future seagrass assessments.
Future seagrass mapping efforts that require detailed assessments of seagrasses should consider using airborne digital imagery and/or color aerial photography. These techniques provide cost-effective high resolution products (Mumby et al., 1999). Table 2 outlines a comparison of the strength and weaknesses of airborne and space platforms for sensing sea-grass distribution. Although satellite imagery can be obtained at lower cost than airborne imagery (Mumby et al., 1999), it is often difficult to obtain images from the desired area that were collected under environmental conditions appropriate for detecting seagrasses (e.g., no clouds, light winds, low tide) (Dobson et al., 1995). Other types of sensors are more expensive, but they allow more flexibility in timing of data collection. Currently, aerial photography and airborne digital sensors provide higher spatial resolution (Mumby et al., 1997a); however, future satellites will likely contain higher resolution sensors (1-5 m) that may improve their accuracy and reliability for mapping seagrass. Digital multispectral sensors are capable of collecting seagrass data over the widest electromagnetic spectrum range (400-580 nm) and therefore provide the greatest spectral resolution, while aerial photography has the narrowest range (one-analog band) (Mumby et al., 1997a). Satellite imagery requires the least amount of postprocessing time because data are already digital and mosaicking of images is rarely necessary. Digital sensors require less post-processing time than aerial photography, but the frames still need to be joined together for both of these techniques. With regard to accuracy, aerial photography and digital sensors have the advantage over satellite imagery, especially for detailed mapping. At coarse scale mapping, satellite imagery can be comparable with other imagery (Mumby et al., 1999).
Although we did not conduct a detailed cost analysis, we found that the costs of mapping seagrass in San Quintín Bay, including those associated with post-processing, were comparable between DMSV and color aerial photography. However, for the purpose of assessing all habitats, DMSV was superior to aerial photography because it could differentiate among sea-grass species and cover types. Either technique should be used in conjunction with ground surveys that refine image classification and validate accuracy of the classified map. The frequency at which change detection analyses should be conducted is a critical issue and ultimately depends on the rate of change expected for an area. Given the current rate of development (Fermán-Almada et al., 2000; Aguirre-Muñoz et al., 2001) and environmental change (Zveryaev et al., 2000; Cabanes et al., 2001) that is occurring in and around San Quintín Bay, as well as the recent (1987-2000) seagrass loss in the bay (Ward et al., 2003), we recommend a seagrass assessment within the next five years to determine if there is a negative trend in seagrass distribution and cover in San Quintín Bay.
Acknowledgements
This study was funded by the U.S. Fish and Wildlife Service through the North American Wetlands Conservation Act, Ducks Unlimited de Mexico, and the Alaska Science Center of U.S. Geological Survey. Jim Bredy and Al Cilurso of U.S. Fish and Wildlife Service-Region 2 collected the aerial photography. Ocean Imaging Corporation acquired and processed the digital multispectral videography. We are especially grateful to Matthew Anderson, Adrian Gall, Tyler Lewis, Danielle Mather, Ryan Mathis, Dina Roberts, and Marnie Shepherd for assistance collecting the reference data. We also thank Alejandro Cabello-Pasini, the staff of San Diego National Wildlife Refuge, Richard and Dorothy Wheeler, and James White for providing logistical support and assistance. Reviews by Sandy Wyllie-Echeverria and Isaí Pacheco-Ruíz improved the manuscript.
References
Aguirre-Muñoz, A., Buddemeier, R.W., Camacho-Ibar, V., Carriquiry, J.D., Ibarra-Obando, S.E., Massey, B.W., Smith, S.V. and Wuff, F. (2001). Sustainability of coastal resource use in San Quintin Bay, Mexico. Ambio, 30: 142-149. [ Links ]
Barnard, J.L. (1962). Benthic marine exploration of Bahía San Quintín, Baja California. Pacific Naturalist, 3: 251-274. [ Links ]
Cabanes, C., Cazenave, A. and Le Provost, C. (2001). Sea level rise during past 40 years determined from satellite and in situ observations. Science, 294: 840-842. [ Links ]
Cabello-Pasini, A., Muñiz-Salazar, R. and Ward, D.H. (2003). Annual variations of biomass and photosynthesis in Zostera marina L. along the Pacific coast of Baja California, Mexico. Aquat. Bot., 1633: 1-17. [ Links ]
Camacho-Ibar, V.F., Carriquiry, J.D. and Smith, S.V. (2003). Non-conservative P and N fluxes and net ecosystem production in San Quintín Bay, Mexico. Estuaries, 26(5): 1220-1237. [ Links ]
Conant, B. and Voelzer, J.F. (2002). Winter waterfowl survey: Mexico west coast and Baja California. U.S. Fish and Wildlife Service Annual Report, Anchorage, AK. [ Links ]
Congalton, R.G. (1991). A review of assessing the accuracy of classifications of remotely sensed data. Remote Sensing of Environment, 37: 35-46. [ Links ]
Dawson, E.Y. (1951). A further study of upwelling and associated vegetation along Pacific Baja California, Mexico. J. Mar. Res., 10: 39-58. [ Links ]
Dawson, E.Y. (1962). Marine and marsh vegetation of Bahía San Quintín, Baja California. Pacific Naturalist, 3: 275-280. [ Links ]
Delgadillo, J., Peinado, M., de la Cruz, M., Martínez-Parras, J.M., Alcaraz, F. and de la Torre, A. (1992). Análisis fitosociológico de los saladares y manglares de Baja California, México. Acta Botánica Mexicana, 19:1:35. [ Links ]
Den Hartog, C. and Polderman, P.J.G. (1975). Changes in the seagrass populations of the Dutch Waddenzee. Aquat. Bot., 1: 141-147. [ Links ]
Dobson, J.E., Bright, E.A., Ferguson, R.L., Field, D.W., Wood, L.L., Haddad, K.D., Iredale, H., Jensen, J.R., Klemas, V.V., Orth, R.J. and Thomas, J.P. (1995). NOAA coastal change analysis program (C-CAP): Guidance for regional implementation. National Oceanic and Atmospheric Administration Tech. Rep. 123, U.S. Department of Commerce, Seattle, Washington. [ Links ]
Ferguson, R.L. and Korfmacher, K. (1997). Remote sensing and GIS analysis of seagrass meadows in North Carolina, USA. Aquat. Bot., 58: 241-258. [ Links ]
Ferguson, R.L., Wood, L.L. and Graham, D.B. (1993). Monitoring spatial change in seagrass habitat with aerial photography. Photogrammetric Engineering Remote Sensing, 59: 1033-1036. [ Links ]
Fermán-Almada, J.L., Arredondo-García, C. and García-Gastelum, A. (2000). Ecological program for the San Quintín Valley of Baja California. Technical Report for the State of Baja California, Institute of Marine Sciences, University of Baja California. [ Links ]
Fortes, M.D. (1988). Mangrove and seagrass beds of East Asia: habitats under stress. Ambio, 17: 207-213. [ Links ]
Hemminga, M.A. and Duarte, C.M. (2000). Seagrass Ecology. Cambridge Univ. Press. [ Links ]
Hobjoy, D.K., Officer, R.A. and Perry, G.B. (1999). Changes to demersal fish communities over two decades: 1970-1991. Mar. Freshwater Res., 50: 397-407. [ Links ]
Ibarra-Obando, S.E. and Escofet, A. (1987). Industrial development effects on the ecology of a Pacific Mexican estuary. Environ. Conserv., 14: 135-141. [ Links ]
Ibarra-Obando, S.E., Camacho-Ibar, V.F., Carriquiry, J.D. and Smith, S.V. (2001). Upwelling and lagoonal ecosystems of the dry Pacific coast of Baja California. In: U. Seeliger and B. Kjerfve (eds.), Coastal Marine Ecosystems of Latin America. Springer-Verlag, Germany, pp. 315-329. [ Links ]
Kramer, G.W. (1976). Winter ecology of black brant at San Quintin Bay, Baja California, Mexico. M.Sc. thesis, Humboldt State University, Arcata, California. [ Links ]
Massey, B.W. and Palacios, E. (1994). Avifauna of the wetlands of Baja California, Mexico: Current status. Stud. Avian Biol., 15: 45-57. [ Links ]
Matheson, R.E. Jr., Camp, B.K., Sorgard, S.M. and Bjorgo, K.A. (1999). Changes in seagrass assessments of fish and crustacean communities of Florida Bay mud banks: The effects of recent ecosystem change. Estuaries, 22: 534-551. [ Links ]
Meling-López, A.E. and Ibarra-Obando, S.E. (1999). Annual life cycles of two Zostera marina L. populations in the Gulf of California: Contrasts in seasonality and reproductive effort. Aquat. Bot., 65: 59-69. [ Links ]
McRoy, C.P. and Bridges, K.W. (1998). Eelgrass survey of eastern Prince William Sound. U.S. Army Corps of Engineers. Unpublished Final Report, Anchorage, Alaska. [ Links ]
Mumby, P.J., Green, E.P., Edwards, A.J. and Clark, C.D. (1997a). Coral reef habitat-mapping: How much detail can remote sensing provide? Mar. Biol., 130: 193-202. [ Links ]
Mumby, P.J., Green, E.P., Edwards, A.J. and Clark, C.D. (1997b). Measurement of seagrass standing crop using satellite and digital airborne remote sensing. Mar. Ecol. Prog. Ser., 159: 51-60. [ Links ]
Mumby, P.J., Green, E.P., Edwards, A.J. and Clark, C.D. (1999). The cost-effectiveness of remote sensing for tropical coastal resources assessment and management. J. Environ. Manage., 55: 157-166. [ Links ]
Norris, J.P., Wyllie-Echeverria, S., Mumford, T., Bailey, A. and Turner, T. (1997). Estimating basal area coverage of subtidal seagrass beds using underwater videography. Aquat. Bot., 58: 269-287. [ Links ]
Orth, R.J. and Moore, K.A. (1983). Chesapeake Bay: An unprecedented decline in submerged aquatic vegetation. Science, 22: 51-52. [ Links ]
Palacios, M.C.E. (2000). Inventory of coastal wetlands of Baja California. Technical report. Pro Esteros, 4492 Camino de la Plaza, Ensenada, Mexico. [ Links ]
Perez-Arteaga, A., Gaston, K.J. and Kershaw, M. (2002). Undesignated sites in Mexico qualifying as wetlands of international importance. Biol. Conserv., 107: 47-57. [ Links ]
Poumián-Tapia, M. and Ibarra-Obando, S.E. (1999). Demography and biomass of the seagrass Zostera marina in a Mexican coastal lagoon. Estuaries, 22: 879-889. [ Links ]
Preen, A.R. and Marsh, H. (1995). Response of dugongs to large-scale loss of seagrass from Hervey Bay, Queensland, Australia. Wildlife Res., 22: 507-519. [ Links ]
Preen, A.R., Lee Long, W.J. and Coles, R.G. (1995). Flood and cyclone related loss, and partial recovery of more than 1000 km2 of seagrass in Hervey Bay, Queensland, Australia. Aquat. Bot., 52: 3-17. [ Links ]
Reed, A., Ward, D.H., Derksen, D.V. and Sedinger, J.S. (1998). Brant (Branta bernicla). In: A. Poole and F. Gill (eds.), The Birds of North America, No. 337. The Birds of North America, Philadelphia, PA. [ Links ]
Simenstad, C.A. and Cordell, J.R. (2000). Ecological assessment criteria for restoring anadromous salmonid habitat in Pacific Northwest estuaries. Ecol. Eng., 15: 283-302. [ Links ]
Sheppard, C.R.C., Matheson, K., Bythell, J.C., Murphy, P., Blair-Myers, C. and Blake, B. (1995). Habitat mapping in the Caribbean for management and conservation: Use and assessment of aerial photography. Aquatic Conservation: Marine Freshwater Ecosystems, 5: 277-298. [ Links ]
Short, F.T. and Burdick, D.M. (1996). Quantifying eelgrass habitat loss in relation to housing development and nitrogen loading in Waquoit Bay, Massachusetts. Estuaries, 19: 730-739. [ Links ]
Short, F.T. and Wyllie-Echeverria, S. (1996). A review of natural and human-induced disturbance of seagrasses worldwide. Environ. Conserv., 23: 17-27. [ Links ]
Swain, P.H. and Davis, S.M. (1978). Remote Sensing: The Quantitative Approach. McGraw-Hill, New York. [ Links ]
Ward, D.H., Markon, C.J. and Douglas, D.C. (1997). Distribution and stability of eelgrass beds at Izembek Lagoon, Alaska. Aquat. Bot., 58: 229-240. [ Links ]
Ward, D.H., Morton, A., Tibbitts, T.L., Douglas, D.C. and Carrera-González, E. (in review). Long-term spatial change in eelgrass distribution at Bahía San Quintín, Baja California, Mexico, using satellite imagery. Estuaries, 26(6): in press. [ Links ]
Wiggins, I.L. (1980). Flora of Baja California. Stanford Univ. Press. [ Links ]
Wilson, U.W. and Atkinson, J.R. (1995). Black brant and spring-staging use at two Washington coastal areas in relation to eelgrass abundance. Condor, 97: 91-98. [ Links ]
Zveryaev, I.I. and Selemenov, K.M. (2000). Decadel scale changes in the annual cycle of the north Pacific sea-surface temperature. Int. J. Climatol., 20: 1639-1651. [ Links ]

